Asset Allocation Bi-Weekly – A Commodity Update (March 21, 2022)

by the Asset Allocation Committee | PDF

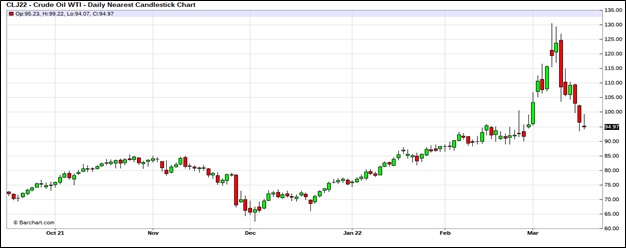
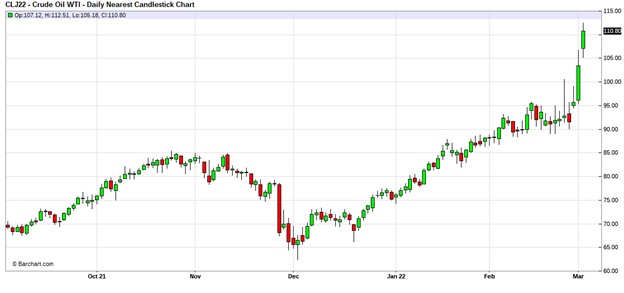
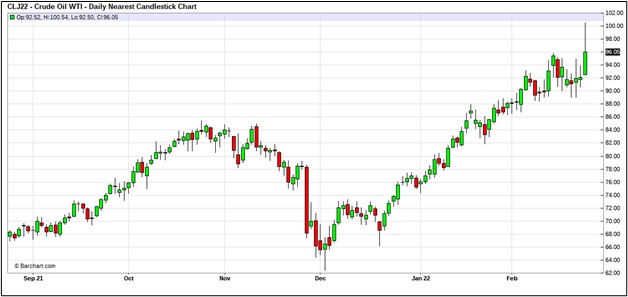
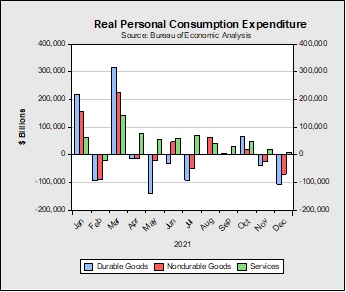
Since the beginning of the year, commodities, as measured by the Bloomberg Commodity Index, have been up 15.4%.  All other major asset classes are down for the year.  Among the S&P 500 sectors, only energy is positive.  Commodity prices were strong going into the war in Ukraine, but the incursion coupled with the subsequent sanctions have triggered a historic rally.  In this report, we put this rally in context and examine if it will continue.

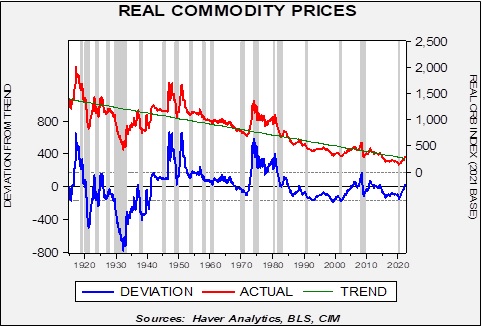
In this chart, we deflate the CRB Index, starting in 1915, and regress the real index against a time trend.  The fact the green line declines over time shows why it is hard to be a commodity producer.  Over time, commodity prices adjusted for inflation tend to decline.  Market economies tend to use less “stuff” when making goods and services, meaning that the final product that a commodity producer makes doesn’t keep up with inflation.  However, as the deviation line on the chart shows, there are periods where commodity prices move well above trend.  The three spikes above-trend that occurred before 1970 were caused by war—WWI, WWII, and Korea.  The WWII spike was delayed until after the end of the war because of rationing and price controls.  The spike that lasted from 1973 to 1981 was partly due to the Vietnam War but was mostly a result of the monetary uncertainty triggered by Nixon’s decision to leave the Bretton Woods Agreement.  That bull market ended with the combination of the Reagan/Thatcher deregulation[1] and the Volcker’s interest rate shock in the early 1980s.  Since then, we have not had a major commodity bull market.  The one observed from 2000 to 2007 can be seen on the chart, but compared to earlier events, it was rather modest.

The above chart raises two questions.  First, will the war in Ukraine have an effect comparable to other major conflicts?  Second, if a commodity bull market is in the offing, will it look similar to those before 1981 or the one in 2000-07?  Let’s tackle the first question.  On its face, it seems unlikely that the war in Ukraine will become a resource-heavy industrialized conflict.  Although Moscow likely has designs on further expansion, an attack on a NATO nation could escalate to a superpower confrontation.  Thus, we expect Russia to use some degree of discretion before even considering expansion

However, even without a major mobilization similar to those of the pre-1980 wars, the impact on commodities could be similar.  There are two reasons.  First, Russia is a substantial commodity supplier, and the sanctions levied on Moscow have already disrupted commodity flows.  Without a quick resolution to the Ukraine War, these will likely stay in place indefinitely, and the longer they are in effect, the more consumers will adjust to higher prices.  Second, and even more concerning, are the financial sanctions effectively rendering most of Russia’s foreign reserves worthless.  Reserve managers worldwide must now account for the fact that if their nation becomes a target of the U.S., they could see similar treatment.  Thus, what assets are now reserve assets?  Again, as long as a nation has good relations with the U.S., it is probably safe to hold dollars and Treasuries.  But, if there is any chance of soured relations, the question of viable reserve assets becomes critical.  Russia found that euro assets proved to have the same problem as dollar assets, and even moving gold in quantity is difficult under sanction.  Reserve managers may conclude that the only assets that may have value in a crisis are commodities.  In other words, it would not surprise us to see nations start expanding stockpiles of commodities that would act as a buffer in a sanction crisis.

The answer to the second question probably rests on the behavior of central banks.  Part of the reason we saw commodity price spikes after WWII and during the Korean War was that the Federal Reserve was not independent.  During WWII, the Fed was forced to fix interest rates across the entire Treasury yield curve.  It led to a massive expansion of the Fed’s balance sheet.

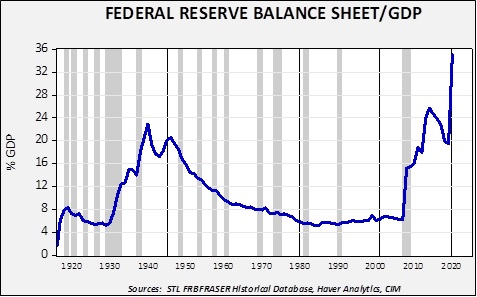
Into WWII, the balance sheet rose to 22.9% of GDP and remained elevated into the early 1950s.  However, after the Fed’s independence in 1951, it gradually declined to around 6% of GDP…until the Great Financial Crisis.  The bouts of quantitative easing that occurred in the last decade led to a steady expansion of the balance sheet until quantitative tightening began in 2018.  That policy was abandoned in 2019 due to financial stress, and then quantitative easing resumed in earnest during the pandemic.  One could argue that the Federal Reserve accommodated the rise in commodity prices through its balance sheet practices in the 1940s into the early 1950s.  Given the vast expansion of the balance sheet since 2009, it is arguable that there is ample liquidity to accommodate another commodity bull market.

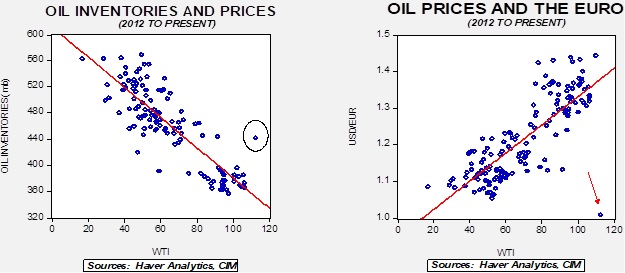
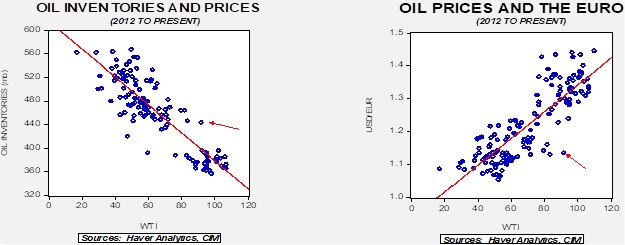
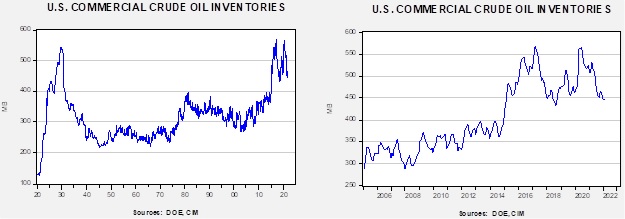
Finally, relative to GDP, the CRB Index remains undervalued.

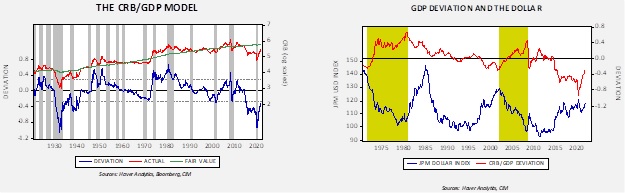
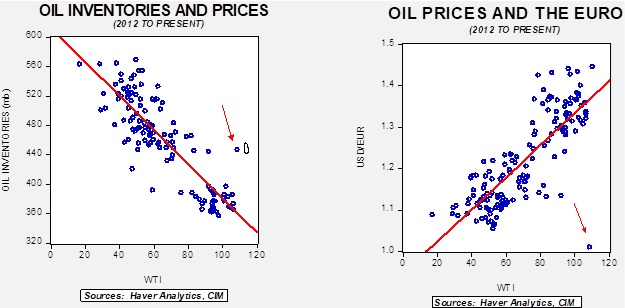
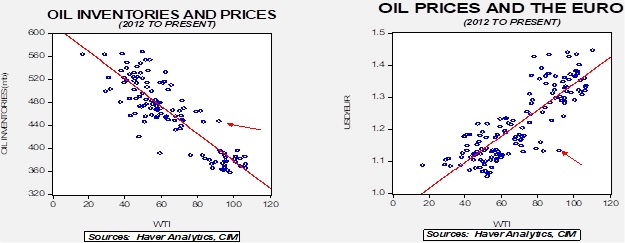
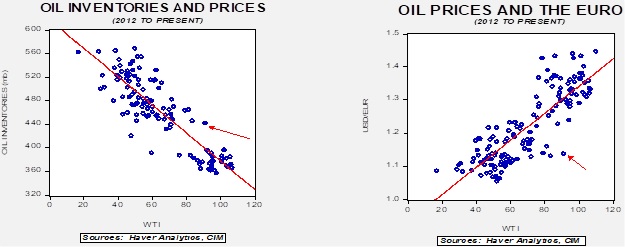
The chart on the left shows the CRB Index, log-transformed, regressed against the level of nominal GDP.  Note that since around 2014, when oil prices fell, the CRB has been trading well below GDP.  In fact, the commodity market since 2014, relative to GDP, looks familiar to the 1930s commodity bear market.  A rally to fair value would put the CRB Index at 323.09 (from the current 295.41) and to a standard error above fair value; with the usual definition of a commodity bull market, the level would be 428.98.  However, the chart on the right suggests that a primary component to a major commodity bull market will be a weaker dollar.  So far, the dollar has been mostly rangebound, although the greenback has benefited recently from flight to safety flows triggered by the war.

In conclusion, even with the strong rally seen recently in commodities, market conditions and geopolitical factors suggest further upside is probable.  Yet, the next substantial “leg” higher in commodities will likely require a weaker dollar.  If reserve managers begin to shun the dollar, a decline in the greenback is certainly possible.

View PDF


[1] To be historically accurate, deregulation began under President Carter, but that policy is mostly tied to President Reagan.

Weekly Energy Update (March 17, 2022)

by Bill O’Grady, Thomas Wash, and Patrick Fearon-Hernandez, CFA | PDF

Oil prices have fallen to near pre-invasion levels.  The initial rally was driven by short covering, and price volatility has reduced market participation.

(Source: Barchart.com)

Crude oil inventories unexpectedly rose 4.3 mb compared to a 1.6 mb draw forecast.  The SPR declined 2.0 mb, meaning the net build was 2.4 mb.

In the details, U.S. crude oil production was unchanged at 11.6 mbpd.  Exports rose 0.5 mbpd, while imports fell 0.4 mb.  Refining activity rose 1.1% and is now 90.4% of capacity.

(Sources: DOE, CIM)

This chart shows the seasonal pattern for crude oil inventories.  Even though inventories rose this week, they remain below last year and well below the seasonal average.

These charts make evident that the normal relationships between the dollar, inventory, and oil prices are currently broken.  However, the chart on the left indicates the degree of overvaluation has narrowed.  Last week is represented by the circle; we have seen prices move in (the average daily price during the month of March is used for this dot).  Overall, the market is consolidating after the major war spike.  We look for continued consolidation, although we note that the situation with Ukraine remains fluid, and prices could move strongly in either direction on war news.

 Market news:

  • The oil market has been rocked by massive price volatility. As the above chart shows, we are seeing giant swings in the market. The spike we have seen recently appears to be a product of short covering.

As the chart above shows, we have seen a bout of short covering.  Producing hedgers often use short positions in the futures markets or in over-the-counter instruments.  When prices spike higher, a hedged producer will see the value of the short hedges fall rapidly. Eventually, of course, the producer will sell higher-priced crude into the cash market, but until the sale is made, the hedger will face margin calls to maintain the short hedges.  Essentially, a hedger trades price risk for liquidity risk.  The current extreme situation is creating conditions of liquidity risk for the oil industry (metals too, as seen by the LME closing the nickel trading pit) and creating calls for central bank support.

It is hard to justify increased investment into declining demand; the odds of creating stranded assets are elevated.

 Geopolitical news:

  • The biggest geopolitical news continues to be the Ukraine War, but it isn’t the only event that matters. The Iran nuclear deal remains a significant issue.  The Biden administration has pushed to return to the 2015 deal.  A return has looked imminent for weeks, yet the talks remain stalled.  The most recent snag is that Russia wants guarantees it could continue to invest in Iran and avoid sanctions.  It appears that hurdle has been overcome; the agreement narrows the sanctions relief only to areas affected by the JCPOA.  Now the U.S. will need to approve this arrangement.  It remains unclear whether the Biden administration will accept this loophole, but Moscow claims it has “written” relief.
  • With the loss of Russian oil, the U.S. has moved to improve relations with Venezuela. So far, despite last week’s release of prisoners by Caracas, the U.S. hasn’t moved to ease sanctions.  Nevertheless, we might see the U.S. ease up on Venezuela in an attempt to pull Caracas out of Russia’s orbit.
  • While there are reports that Ukraine and Russia are formulating a ceasefire arrangement, the removal of sanctions remains uncertain. And, the disinvestment that has occurred will not likely be reversed anytime soon.
  • As we have noted, the U.S. has been trying to “pivot to Asia” since the Obama administration. The JCPOA was an attempt to reduce America’s commitment to the Middle East.  This signal of withdrawal has raised tensions between nations in the region and Washington.  The KSA has invited General Secretary Xi to visit Riyadh and is in talks to price oil in CNY, a significant departure from pricing oil in dollars.  Pricing oil in dollars was part of the agreement between the U.S. and the KSA after the Arab Oil Embargo.  Although this agreement may be limited (holding CNY in reserve when China has a restricted capital account seems less than optimal), it indicates Saudi displeasure with the path of relations.

Alternative energy/policy news:

  View PDF

Weekly Energy Update (March 10, 2022)

by Bill O’Grady, Thomas Wash, and Patrick Fearon-Hernandez, CFA | PDF

Oil prices have spiked but are being hit by waves of profit-taking.

(Source: Barchart.com)

Crude oil inventories unexpectedly fell 1.9 mb compared to a 1.5 mb draw forecast.  The SPR declined 2.5 mb, meaning the net draw was 4.4 mb.

In the details, U.S. crude oil production was unchanged at 11.6 mbpd.  Exports fell 1.4 mbpd, while imports surged 1.9 mb.  Refining activity rose 1.6%.

(Sources: DOE, CIM)

This chart shows the seasonal pattern for crude oil inventories.  This week’s report suggests inventories are mostly holding steady, meaning the seasonal deficit is continuing to widen.

These charts make evident that the normal relationships between the dollar, inventory, and oil prices are currently broken.  Both these variables would suggest oil prices are wildly overvalued, but the war clearly overrules their impact.

High gasoline prices tend to be a political and social problem. Gasoline is just about the only product consumers buy where the prices are prominently displayed.  Recently, U.S. average prices rose above $4.00 per gallon, leading the media to point out this level is near all-time highs.  However, that price isn’t scaled in any fashion.  Rather than scale by consumer prices, we like to scale gasoline prices relative to the hourly wage for non-supervisory workers.  Using that measure, we are not at new lows in terms of what an hour’s worth of work can buy in gasoline.

Currently, an hour’s worth of work will buy about 6.7 gallons of gasoline.  The average since 1965 is 8.6 gallons, with a standard deviation of 1.9 gallons. That means the current level is about one standard deviation from the mean.  The level of gasoline prices isn’t yet a major crisis but breaking below 6 gallons will likely be the point where demand destruction emerges.

 Market news:

Geopolitical news:

Alternative energy/policy news:

  View PDF

Asset Allocation Bi-Weekly – Believe It or Not, Fiscal Policy Is Tightening (March 7, 2022)

by the Asset Allocation Committee | PDF

The U.S. economy and government economic policies have many moving parts, but investors often latch onto just one or two indicators or policy initiatives to gauge where asset prices are heading.  These days, their focus has been on consumer price inflation and the Federal Reserve’s plan to hike its benchmark short-term interest rate to combat it.  Tighter monetary policy should help cut demand, leading to lower inflation, but it will also have a direct negative impact on asset prices.  In this report, we argue investors aren’t paying enough attention to another aspect of economic policy.  Investors might not realize it, but federal fiscal policy is also tightening, which will further weigh on economic growth.  It will be an additional challenge for asset prices.

Investors are often incensed at the enormous numbers that get bandied about when talking about government spending, but it’s important to keep in mind that the overall economy is also enormous.  U.S. gross domestic product (GDP) totaled about $23 trillion in 2021.  In the decade leading up to the coronavirus pandemic, total federal receipts averaged 16.3% of GDP, while federal spending averaged 21.6% of GDP.  The budget deficit averaged 5.3% of GDP.  However, to cushion the blow of the pandemic starting in early 2020, the government passed trillions of dollars of emergency spending, ranging from forgivable loans for affected businesses to enhanced unemployment benefits and cash grants for individuals.  As shown in the chart, total federal outlays in the year ended March 2021 were up a massive 65.7% from the prior year, even as federal receipts were essentially flat.

The added spending during the pandemic undoubtedly helped preserve economic activity.  It also blew out the budget deficit and, against a backdrop of pandemic supply disruptions, has contributed to today’s high inflation as well.  However, the chart above shows that this fiscal stimulus has already gone into reverse.  In the year ended December 2021, spending was essentially unchanged from the previous year.  Because of the rapid economic recovery, government receipts (mostly income taxes) were up 25.7%.  Flat spending against a huge jump in tax income helped cut the budget deficit to “just” $2.577 trillion in 2021, or $771.4 billion narrower than in 2020.  The deficit in 2021 was only about 11.4% of GDP, roughly half what it was in 2020.

The $771.4 billion in deficit reduction during 2021 was a drag on the economy, but it wasn’t very noticeable because companies and individuals had so much pent-up demand.  In addition, companies and individuals still had a lot of excess cash and savings left over from the stimulus programs earlier in the pandemic.  The experience in 2022 could be very different.  For one thing, forecasts from authorities such as the White House Office of Management and Budget and the Congressional Budget Office suggest the deficit will fall dramatically again this year.  In dollar terms, the deficit is expected to narrow by some $1.3 trillion, mostly because of higher income tax receipts and reduced transfer payments to states, local governments, and individuals.  That’s exactly like taking $1.3 trillion out of the economy, just as many firms and individuals start to deplete their savings and face much higher price inflation.

As shown in this chart, the fiscal tightening that began in 2021 has been shaving more than two percentage points off the annualized U.S. growth rate for the last several quarters.  Taking another $1.3 trillion in net federal spending out of the economy in 2022 will cut several additional percentage points out of the growth rate, on top of the other headwinds to demand.  This fiscal drag will be offset partially by factors such as the Biden administration’s new infrastructure spending and reduced demand for imports.  Nevertheless, we still expect it to have a major impact in slowing demand, just as the Fed looks set to impose multiple interest-rate hikes.  The chart shows that the Fed’s recent rate-hiking campaigns have all occurred during periods of negative fiscal impacts, but none of those periods had fiscal tightening on the scale we’re about to see.  This simultaneous tightening of fiscal and monetary policy may help ease inflation pressures.  It also means real economic growth in 2022 may be a little better than the anemic rates seen in the decade before the pandemic.  That will likely limit the upside for equities and commodities this year.  At the same time, it should also limit the downside for bond prices and keep yields from rising as much as some investors now fear.

View PDF

Weekly Energy Update (March 3, 2022)

by Bill O’Grady, Thomas Wash, and Patrick Fearon-Hernandez, CFA | PDF

Oil prices are moving sharply higher as sanctions expand against Russia.

(Source: Barchart.com)

Crude oil inventories unexpectedly fell 2.6 mb compared to a 2.5 mb draw forecast.  The SPR declined 2.4 mb, meaning the net build was 5.0 mb.

In the details, U.S. crude oil production was unchanged at 11.6 mbpd.  Exports rose 1.1 mbpd, while imports dropped by the same amount.  Refining activity rose 0.3%.

(Sources: DOE, CIM)

This chart shows the seasonal pattern for crude oil inventories.  This week’s report shows we are “splitting the difference” between last year’s plunge and the usual rise seen in the 5-year average.  Given all the turmoil in markets, it is more likely that inventories hold steady in the coming weeks until refineries begin to ramp up for summer driving.

Based on our oil inventory/price model, fair value is $70.37; using the euro/price model, fair value is $54.44.  The combined model, a broader analysis of the oil price, generates a fair value of $63.09.  Current prices are being driven by ESG and geopolitics, so the usual impact of inventory and the dollar has been overwhelmed.  However, the analysis shows that any sort of normalization will likely lead to lower oil prices; presumably, “normalization” may not return any time soon.

 Market news:

  • As part of the war response, the U.S. and other nations announced a 60 mb oil release from SPRs. We are not sure this action will have much of a positive impact (it hasn’t thus far).  As we noted last week, we expect the correlation between price and inventory to flip to positive in the coming weeks as consumers scramble to secure supply.  One of the primary reasons for creating SPRs was to discourage hoarding.  If consumers believe the SPRs can provide oil in a shortfall, they should be confident enough to avoid hoarding.  Unfortunately, the U.S. has been steadily releasing oil from the U.S. SPR, so the psychological impact of the news has dampened.

(Sources:  DOE, CIM)

  • This chart shows the weekly level of the SPR since August 1982. The current level, at 580 mb, is the lowest in nearly 20 years.
  • Divestment efforts from fossil fuels continue, which will tend to reduce funds available for investment.

Geopolitical news:

Alternative energy/policy news:

(Source:  Axios)

  View PDF

Business Cycle Report (February 25, 2022)

by Thomas Wash | PDF

The business cycle has a major impact on financial markets; recessions usually accompany bear markets in equities.  The intention of this report is to keep our readers apprised of the potential for recession, updated on a monthly basis.  Although it isn’t the final word on our views about recession, it is part of our process in signaling the potential for a downturn.

 In January, the diffusion index rose further above the recession indicator, signaling that the economy remains in expansion. In financial markets, higher yields on Treasuries have weighed on equities. Meanwhile, manufacturing data suggests that supply chains are improving. Lastly, the labor market appears to be strong, with nonfarm payrolls surprising on the upside. That being said, ten out of the 11 indicators are in expansion territory. The diffusion index rose from +0.8182 to +0.84545, remaining well above the recession signal of +0.2500.

The chart above shows the Confluence Diffusion Index. It uses a three-month moving average of 11 leading indicators to track the state of the business cycle. The red line signals when the business cycle is headed toward a contraction, while the blue line signals when the business cycle is headed toward a recovery. On average, the diffusion index currently provides about six months of lead time for a contraction and five months of lead time for a recovery. Continue reading for a more in-depth understanding of how the indicators are performing and refer to our Glossary of Charts at the back of this report for a description of each chart and what it measures. A chart title listed in red indicates that the indicator is signaling recession.

Read the full report

Weekly Energy Update (February 25, 2022)

by Bill O’Grady, Thomas Wash, and Patrick Fearon-Hernandez, CFA | PDF

Oil prices briefly moved above $100 per barrel on news of the Russian invasion of Ukraine.

(Source: Barchart.com)

Crude oil inventories unexpectedly rose 4.5 mb compared to a 1.0 mb draw forecast.  The SPR declined 2.4 mb, meaning the net build was 2.1 mb.

In the details, U.S. crude oil production was unchanged at 11.6 mbpd.  Exports rose 0.4 mbpd while imports increased 1.0 mbpd.  Refining activity rose 2.1%, recovering from the previous week’s decline tied to the cold snap that adversely affected refining in Texas and Louisiana.

(Sources: DOE, CIM)

This chart shows the seasonal pattern for crude oil inventories.  This week’s report shows we are “splitting the difference” between last year’s plunge and the usual rise seen in the 5-year average.  Under normal circumstances, we would anticipate a steady rise in stockpiles, but under current conditions, normal patterns may not develop this year.

Based on our oil inventory/price model, fair value is $69.56; using the euro/price model, fair value is $54.54.  The combined model, a broader analysis of the oil price, generates a fair value of $62.62.  Current prices are being driven by ESG and geopolitics, so the usual impact of inventory and the dollar has been overwhelmed.  However, the analysis shows that any sort of normalization will likely lead to lower oil prices.

 Market news:

  • Clearly the crisis in Ukraine is bullish for oil and natural gas prices. For now, conditions are fluid, but we expect rising concerns about the security of supply.  One key relationship to watch is the correlation between oil prices and commercial crude oil inventories.

The normal relationship between inventory and price is inverse.  In general, rising inventories suggest excess supply, so rising stockpiles are usually bearish.  However, as the above chart shows, there are periods where the two series are positively correlated.  During the geopolitical turbulence of the 1970s into the early 1980s, U.S. commercial crude stocks and prices were positively correlated.  Another word for this condition is “hoarding.”  In other words, rising inventories indicate increasing demand.  Since 2007, inventories and prices have been inversely correlated; we will be watching closely to see if this correlation “flips.”  If it does, it would be considered very bullish for crude oil prices.

Geopolitical news:

  • As Russia faces sanctions from the West for its actions in Ukraine, one uncertainty is how well Moscow will cope. It should be noted that Russia has increased its reserves and has engaged in fiscal austerity, which should give it some ability to press back against sanctions.
  • One way the Biden administration is addressing high oil prices is to restore the nuclear deal with Iran. We estimate the removal of sanctions on Iran would likely add about 1.0 mbpd to the market.  Iran has been breaking sanctions in recent years, so the increase in supply will probably be modest.  In addition, due to distrust on both sides, the deal will probably be implemented in stages, meaning oil flows will not be immediate if a deal is struck.  One major worry is that Iran is so close to a “bomb” that the new deal will freeze it at the threshold level, meaning if the deal ever fails, Iran could rapidly become a nuclear power.
  • Israel, which opposes any thaw with Iran, is increasing its security cooperation with Bahrain. The threat from Iran is leading the Gulf States to normalize relations with Israel.  Even Turkey, which had been at odds with the Gulf States over the former’s support of the Muslim Brotherhood, is moving to improve relations.
  • Next week’s BWGR discusses the situation in Turkey. The country has been hit with rapid inflation caused in part by heterodox monetary policy.  Recent reports indicate that electric utility prices are soaring, adding to the woes of Turks.
  • Ethiopia has started generating electricity from the largest dam on the Blue Nile, raising fears that flows north will be cut.

Alternative energy/policy news:

  View PDF

Asset Allocation Bi-Weekly – The U.S. Trade Deficit and Global Prices (February 22 2022)

by the Asset Allocation Committee | PDF

When Democrats passed the CARES Act in January 2021, it was viewed initially as a political achievement. Polling from Politico/Morning Consult showed 75% of registered voters supported the bill three months after its passing. Meanwhile, Democrats began touting President Biden as the next Franklin D. Roosevelt. The legislation was so popular that the politicians who voted against the package started taking credit for it. However, the bill may have had an unintended consequence. The fiscal stimulus injected new money before the global economy was ready to absorb it. While domestic firms were sitting on low inventory, the pandemic prevented foreign firms from operating at full capacity. Thus, American desire for goods led to a rise in global inflation as firms could not provide the necessary supply to offset the demand created by the newly injected stimulus. Additionally, the trade deficit rose to an all-time high, as excessive demand led to an increased need for imports. In this report, we discuss how the CARES Act contributed to the widening deficit and a rise in goods inflation. We will also explain how we expect countries will seek to reverse some of the bill’s impact and conclude with possible market ramifications.

Following the passage of the CARES Act, Americans struggled to find places to spend their extra money. Because of pandemic-related restrictions, the availability of services was severely limited.  In the first few months of 2021, restaurants hosted fewer guests, airlines offered fewer flights, and sporting events were, for the most part, uncrowded. With limited entertainment and travel options, consumers spent the bulk of their new money on durable goods. Last year, purchases of motor vehicles and recreational goods surged to levels not seen in the pre-pandemic era.

Robust spending in the first quarter of 2021 caught many firms off guard. In the previous year, when the U.S. went into lockdown, firms liquidated their inventories, believing the pandemic recession would be long-lasting. Rental car companies were particularly active because the lack of travel meant they would have to hold vehicles, a depreciating asset, on their balance sheets for an unforeseen length of time. Thus, these firms were motivated to sell their vehicles. The activity was so noticeable in 2020 that the U.S. recorded its first trade surplus in Auto Vehicle Parts and Engines since the Great Financial Crisis.  The lack of available inventory carried by firms due to this selling activity contributed heavily to demand pressures seen in the following year.

Although consumers contributed to the jump in demand in Q1 2021, consumption data in March suggests firms also ramped up spending. Going into the Spring season, higher vaccination rates encouraged states to ease COVID-related restrictions. Consequently, firms expecting a travel rush, particularly in the Leisure and Hospitality industry, boosted spending on equipment and labor. This spending likely drove the rebound in durable goods from a lull in February to its highest level of the year in March. The aforementioned rental car agencies were big spenders during that time. The lack of available cars forced these companies to purchase used cars, something they typically try to avoid. Automobile consumption accounted for almost half of the total spending on durable goods in March. As a result, the price for new and used cars skyrocketed in 2021 and is currently one of the primary contributors to inflation.

While the U.S. was stimulating its economy, the rest of the world was still reeling from the pandemic. The difference in outcomes was likely related to the successful development and disbursement of COVID-19 vaccines. At the start of 2021, Americans found it relatively easy to sign-up and receive their first jab. Meanwhile, Europe found it difficult to distribute vaccines, Asian populations were vaccine-hesitant, and African countries struggled to even obtain vaccines. The emergence of the Delta variant made matters even worse. The new variant led to a surge in cases and severely hampered the efforts of countries to reopen their economies. Shipments were being delayed because ports were closing, and arbitrary quarantines resulted in constant labor shortages, and in some cases, factory closures. These pandemic-related disruptions meant foreign suppliers could not produce at levels sufficient to satisfy the U.S. demand for foreign goods. It had a negative impact on the global economy.

The combination of a lack of global production capacity and strong demand from the U.S. for inventories put upward pressure on the prices of goods and services around the world. The most noticeable rise in prices came from materials as demand for industrial supplies climbed sharply. Natural gas, steel, and crude oil were in exceptionally high demand because companies needed raw materials to ramp up production. Global demand for materials was so strong that the U.S. recorded its largest trade deficit for industrial supplies in at least 20 years, despite traditionally being a net exporter for that commodity group.  Firms began looking at alternative sources for inputs, in some cases placing multiple orders with different vendors. In other cases, they were shipping inputs via airfreight as opposed to through ships. These orders may at least partially explain why firms, with the exception of automakers, are currently holding elevated inventory levels. Thus, much of the rise in the U.S. deficit for goods can be attributed to firms receiving multiple orders of the same goods from different suppliers.

U.S. demand for foreign goods may have pushed global prices upwards, but it will probably take a global effort to contain those price hikes.  To combat rising worldwide inflation, we suspect that central banks across the world will start to tighten monetary policy. The rise in interest rates should relieve some of the demand pressure for goods and take some of the wind out of inflation. However, the primary driver of disinflation will likely come from countries easing pandemic restrictions and allowing firms to operate at full capacity.  In the meantime, we think that conditions favor equities in the financial sector and commodities. Higher interest rates should make it easier for financial institutions to increase margins without taking much risk, and persistent demand for raw materials will probably continue to support commodity prices throughout 2022.

View PDF

Weekly Energy Update (February 17, 2022)

by Bill O’Grady, Thomas Wash, and Patrick Fearon-Hernandez, CFA | PDF

Oil prices briefly moved above $95 per barrel and are threatening the $100 per barrel level.

(Source: Barchart.com)

Crude oil inventories rose 1.1 mb compared to a 1.9 mb draw forecast.  The SPR declined 2.7 mb, meaning the net draw was 1.6 mb.

In the details, U.S. crude oil production was unchanged at 11.6 mbpd.  Exports fell 0.8 mbpd while imports fell 0.6 mbpd.  Refining activity plunged 2.9%.  It is possible that the cold snap in the reporting week adversely affected refining in Texas and Louisiana.

(Sources: DOE, CIM)

This chart shows the seasonal pattern for crude oil inventories.  This week’s report shows we are “splitting the difference” between last year’s plunge and the usual rise seen in the 5-year average.

Based on our oil inventory/price model, fair value is $70.99; using the euro/price model, fair value is $55.07.  The combined model, a broader analysis of the oil price, generates a fair value of $63.76.  It is rather clear that the relationships between crude oil prices and the dollar/oil inventories have changed.  The pandemic has likely led to these changes, but the bigger issue may be the impact of climate change policy on investment.

 Market news:

This chart compares WTI to the barrels of production per worker, which is near all-time highs.  If U.S. producers were moving headlong into boosting output, we would expect fewer barrels per worker, as we saw during the shale boom in the last decade.  So far, that isn’t happening.  It is possible that technology has improved to the point where productivity is elevated.  But hiring has been restrained, and we expect production gains to remain modest.

Geopolitical news:

  • Although Ukraine is dominating geopolitical news, there are problems in other parts of the world, too. Libya has been in turmoil since the ouster of Moamer Kadhafi in August 2011.  Various groups are attempting to take control of the country; the U.N. is trying to bring elections in a bid to create some sort of unified government.  However, the list of presidential candidates has been delayed, raising fears of additional tensions and production disruptions.  In addition, a power struggle has emerged in the Libyan parliament over naming a prime minister.  Libyan oil production has been volatile.

However, in a world short of oil supplies, anything that would reduce output could drive prices higher.

  • China is telling Iran it’s time to either accept the deal that has been proposed by the U.S. and others or end talks. Iran appears to be stalling, delaying a decision on recent proposals.  Although the Biden administration wants some sort of news to reduce oil prices, we continue to doubt that a deal can be reached.
  • Despite the fact that Iraq is unsettled and its economy is rather weak, the country is still a destination for economic immigrants from South Asia. The influx is raising tensions among Iraqis competing with immigrants for work.
  • Israeli PM Bennett recently visited Bahrain, the first time an Israeli PM has visited a Gulf State. Given Bahrain’s close ties to the KSA, the visit signals a major change in the region.
  • A leaked audio of a meeting of Iran’s Islamic Revolutionary Guard Corps leaders over corruption is raising a stir in Iran.

Alternative energy/policy news:

  • There is evidence that EVs are rising in popularity.

(Source: Axios)

Moving to EVs will have a profound impact on the auto industry, as such cars require fewer parts and maintenance.  It is quite possible that rising EV production will reduce the workforce tied to the auto industry.

  View PDF