

Tag: commodities
Asset Allocation Bi-Weekly – #162 “The Power of Gold” (Posted 5/20/26)
Confluence of Ideas – #49 “Reviewing the Asset Allocation Rebalance: Q2 2026” (Posted 5/18/26)
Asset Allocation Bi-Weekly – The Power of Gold (May 11, 2026)
by Patrick Fearon-Hernandez, CFA | PDF
Since the Iran war began on February 28, several corners of the financial market have behaved in unusual and unexpected ways, with gold prices being perhaps the most surprising. Gold has been a safe-haven asset for centuries, and investors have come to expect its value to rise in times of crisis or conflict. Indeed, many investors hold gold specifically to hedge against political instability or other disasters, just as they tend to hold it to hedge against currency debasement or price inflation. In this case, however, gold prices fell sharply in the days after the war commenced and have only modestly rebounded in recent weeks. What’s behind this extraordinary behavior?
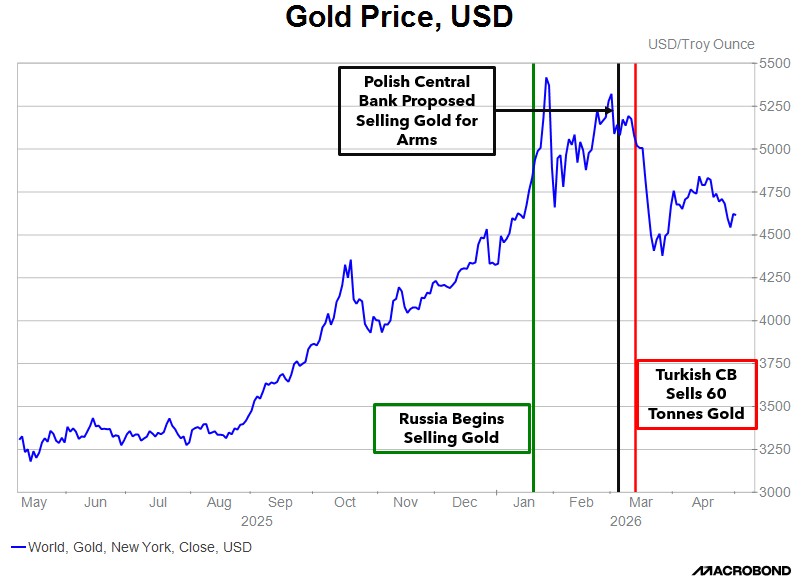
In our view, gold prices fell mostly because central banks and other major investors have been trying to raise liquidity ahead of an anticipated spike in costs. For example, since most oil is traded in dollars, central banks in oil-importing countries must raise greenbacks to prepare for a surge in oil import costs. The chart of gold prices above illustrates the phenomenon. In the chart, the vertical red line shows when Turkey’s central bank announced it would sell 60 tonnes of gold to raise dollars. Other central banks also reportedly started selling gold at about the same time, taking profits after gold prices skyrocketed in the months ahead of the war. This also marks the date when gold prices began to soften in response to all this selling. Gold prices dropped from about $5,200 per ounce in early March to about $4,700 per ounce at the end of April, for a decline of almost 10%. In contrast, other traditional safe-haven assets have held their value much better. Medium-term Treasury notes had a negative total return of 1.5%, while three-month bills returned about 0.6%.
One new factor is that many foreign reserve managers now see gold as a replacement for US Treasurys. It therefore makes sense, in a crisis, for them to sell the yellow metal to raise liquidity. Before the US levied sanctions on Iran and Russia in recent years, reserve managers tended to view Treasurys and gold as complementary: Gold was held as a long-term asset, while Treasurys were prized for liquidity management. Thus, gold sales were rare, and when they were executed, it was usually due to a structural decision as to the allocation of gold and Treasurys. Following the US imposition of sanctions on foreign-held Treasurys, gold is now being seen as a substitute. One change this appears to be causing is that reserve managers will now sell gold to raise liquidity. Due to this change in reserve management practice, we think gold prices are likely to become more volatile going forward.
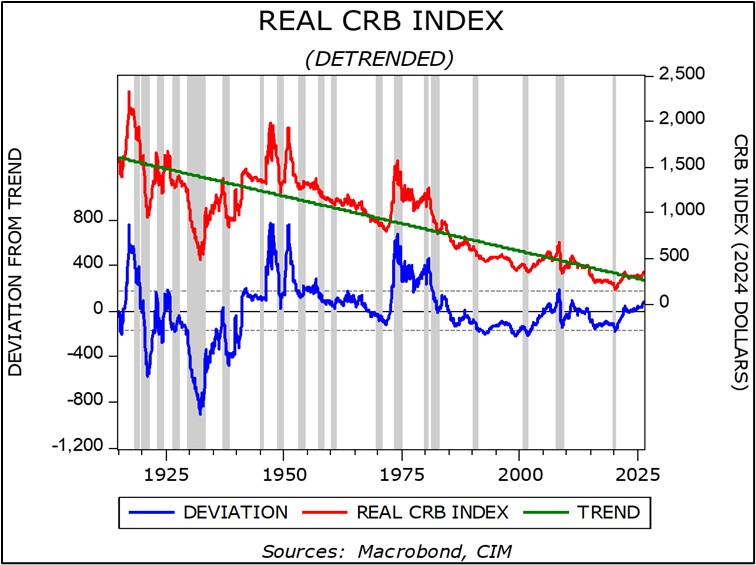
An important question is whether gold will rebound and regain its reputation as a safe-haven asset. On that score, we’re optimistic given the historical behavior of commodity prices generally, and gold prices in particular, during periods of conflict and geopolitical upheaval. In the chart above, the red line shows how the inflation-adjusted CRB commodity-price index has changed over time. The green, downward-sloping trend line shows that real commodity prices tend to fall over time. This is what would be expected in a capitalist economy that incentivizes commodity producers to boost output and users to use less. However, in periods of geopolitical conflict or major supply disruptions, such as the periods around World War II and in the mid-1970s, commodity prices may spike well above the trend and stay high for some time. We think we’re heading into an era like that now. In fact, we can see that the red index line is now moving above the trendline.
For centuries, gold has been prized as a safe, secure store of value based on characteristics such as its density, malleability, and resistance to corrosion. We therefore believe that its recent liquidity-driven selling is likely to peter out soon, if it hasn’t already done so, even if gold prices remain more volatile than in the past. We also think global central banks could replenish their gold holdings once the war in Iran cools down. After all, we think many central banks want to continue diversifying their reserves away from the US dollar and the risk that dollar holdings pose for US sanctions. The recent modest rebound in gold prices gives us some confidence in that stance. In fact, we have recently increased our exposure to gold in some of the Confluence Asset Allocation strategies, while keeping our allocations to the yellow metal unchanged in the others.
Don’t miss our accompanying podcasts, available on our website and most podcast platforms: Apple | Spotify
Confluence of Ideas – #48 “The Case for Hard Assets – An Update for 2026” (Posted 3/17/26)
Confluence of Ideas – #47 “Reviewing the Asset Allocation Rebalance: Q1 2026” (Posted 2/18/26)
The Case for Hard Assets: An Update (First Quarter 2026)
by Patrick Fearon-Hernandez, Joe Hanzlik, Bill O’Grady, and Mark Keller | PDF
Background and Summary
One of the key trends we perceived in 2008 (when we started our firm) was that the US domestic political consensus to maintain American hegemony was fraying. Prior to that point, fears of global communism had fostered a political consensus that encouraged Americans to bear the costs of hegemony. Those costs were tied to the two primary global public goods that the hegemon provides. These goods are:
- Global security — the hegemon develops a military of global reach and often projects power into conflicts unrelated to its own security. As part of this role, the hegemon also protects global sea lanes, supporting international trade.
- Global financial security — the hegemon provides the financial architecture of the global financial system. This includes providing the reserve currency and reserve asset and intervening in financial crises in other nations.
American hegemony was exercised differently than its predecessors. European hegemons used colonies to project power, in part because they were engaged in a “great game” against other competing European powers. In contrast, the US was engaged in an ideological contest, to not only prove to be a stronger power than the Soviet Union, but to be a better power. George Kennan’s famous “long telegram” became the blueprint of American policy against communism. Essentially, US policy was designed to outlast the Soviet Union by containing it and demonstrating that democratic capitalism offered better results than communism. And so, US foreign policy had a strong element of soft power,[1] where the US opened its economy to imports, which allowed allied nations to prosper in the post-WWII environment.
The US created a set of international organizations that built an order based on rules.[2] It also contained longstanding conflicts in Asia (China versus Japan) and Europe (Germany[3]) by providing security to both regions. Thus, Asian nations no longer had to fear Japan’s militaristic attempts to secure resources as the US Navy protected sea lanes and allowed commodities to flow freely. In Europe, nations no longer had to fear German insecurity because the US demilitarized the country. This policy was costly, but it was designed not just to secure American hegemony, but to defeat communism.
[1] For a recap of the American way of hegemony, see our three-part Weekly Geopolitical Report series from 2018, “The Malevolent Hegemon,” Part I, Part II, and Part III.
[2] This didn’t mean the US always abided by the rules, but US administrations did generally try to operate within them. For example, when the Bush administration was planning to invade Iraq, it did attempt to get UN approval.
[3] See our Weekly Geopolitical Report from July 27, 2009, “The German Problem.”