

Tag: Federal Reserve
Asset Allocation Bi-Weekly – Are Long-Term Treasurys No Longer a Safe Haven? (March 16, 2026)
by Patrick Fearon-Hernandez, CFA | PDF
Historically, major geopolitical or economic crises, such as the war against Iran, have prompted investors to sell riskier assets and buy “safe-haven” investments whose values were expected to remain stable or even rise amid the disruptions. The most popular safe havens have been the US dollar, gold, and longer-term US Treasury obligations. Faced with the crisis, or the prospect of one, investors would typically bid up the value of the dollar versus other currencies. Many would also avidly buy up gold, driving prices for the precious metal upward. Others would snap up Treasurys, boosting their values and pushing their yields down. However, market action so far during the Iran war has defied expectations. Treasury demand has been relatively muted, and yields have been markedly resilient. This raises the question of whether long-term Treasurys are still a safe haven. And if not, why?
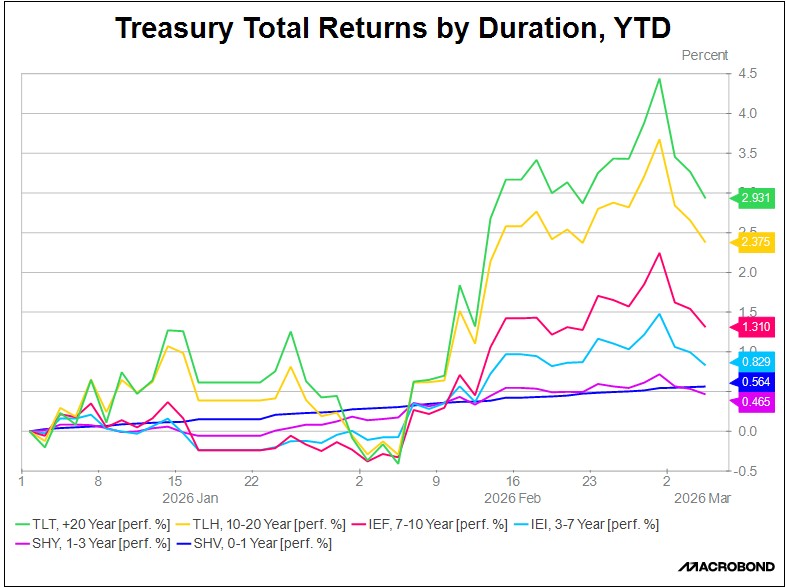
One way to see the unusual performance of long Treasurys is to compare their recent total returns versus shorter-term Treasurys. In the chart above, we show the total return (price change plus interest) for exchange-traded funds (ETFs) tracking Treasury obligations maturing in 20+ years (TLT), 10-20 years (TLH), 7-10 years (IEF), 3-7 years (IEI), 1-3 years (SHY), and 0-1 year (SHV). The graph shows how Treasurys of all tenors were bid up starting in mid-February, when it became clear that the US was prepping for a potential strike against Iran. However, once the war started, investors sold off Treasurys. The selling was especially strong for long-duration obligations as investors began to realize that the conflict could be more drawn out than anticipated, driving up global energy prices and rekindling consumer price inflation.
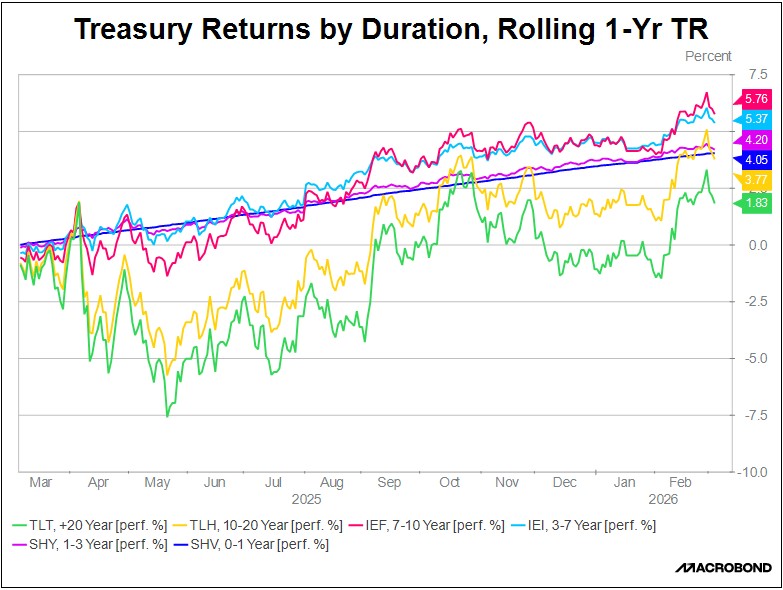
Importantly, the outsized selling of long Treasurys came after a protracted period of weak returns. The chart above displays Treasury total returns by duration over rolling one-year periods. It shows clearly how one-year returns from long Treasurys have lagged since early 2025.
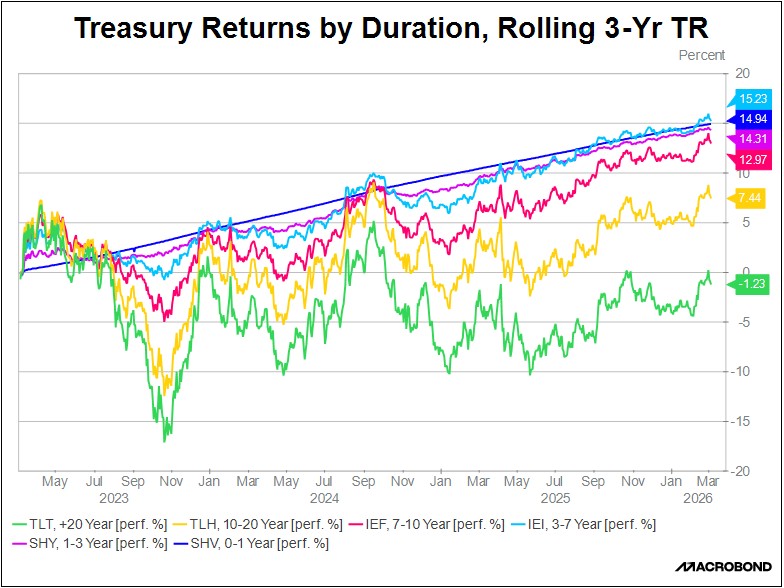
Indeed, long-term Treasury returns have lagged for quite some time. The final chart, on the next page, shows that three-year returns for long Treasurys have not only lagged shorter-term Treasury returns, but they have also lost money in the latest three-year period. This happened even though the Federal Reserve has been cutting its benchmark fed funds interest rate since September 2025. In contrast, shorter-term Treasury securities have offered steady positive returns. Shorter-term Treasurys have largely held their value even after the Iran war started and it became clear that the conflict would threaten global energy supplies and risk reigniting inflation.
Why have long Treasurys lost their attraction as a safe haven? We believe their weakness reflects increased investor concerns about US fiscal dynamics, prospects for a more politicized Fed, and fear of currency debasement. The key evidence for this has been the sell-off in long Treasurys after the war started, once it became clear that the conflict could last long enough to seriously disrupt energy supplies and cause rising global inflation. If investors were truly confident that the Fed would temporarily hike interest rates as needed to wring the inflation out of the economy and protect the purchasing power of the dollar, then demand for Treasurys should have gotten a boost from wartime safe-haven buying. However, the fact that Treasurys have not behaved as usual suggests they may have lost a lot of their cache as a safe haven. As investors also sell off gold to cover margin requirements and raise needed cash, it seems like they only see one true safe-haven asset these days, i.e., cash.
Don’t miss our accompanying podcasts, available on our website and most podcast platforms: Apple | Spotify
Confluence Mailbag – #6 “Money, Market Risks, and Investing in a Multipolar World ” (Posted 12/29/25)
Asset Allocation Bi-Weekly – #140 “White House vs. The Fed: The Looming Battle for US Monetary Policy ” (Posted 5/19/25)
Asset Allocation Bi-Weekly – White House vs. The Fed: The Looming Battle for US Monetary Policy (May 19, 2025)
by Thomas Wash | PDF
The Federal Reserve’s independence faces its most serious challenge in decades as the Trump White House escalates its criticism of central bank policy. This brewing confrontation echoes historic tensions — most notably the 1951 clash between President Truman and Fed policymakers over yield caps that ultimately led to the Treasury-Fed Accord. Today, the battle lines are being redrawn as the administration pushes for more accommodative monetary policy while it looks to shield the economy from its own trade war.
The widening policy gap between the Fed and its global peers has been highlighted in recent months. While the European Central Bank, Bank of England, and the People’s Bank of China have all lowered their benchmark short-term interest rates to combat slowing growth, the Fed has held its benchmark rate steady — a decision repeatedly criticized by the White House. This policy divergence is further strained by the Fed’s quantitative tightening program, which Treasury Secretary Bessent argues complicates the issuance of longer-term government securities.
The debate has now moved beyond short-term policy disagreements to fundamental questions about the Fed’s role and independence. Former Fed Governor Kevin Warsh, widely seen as the leading candidate to replace Chair Powell when his term ends in 2026, has emerged as a vocal critic of the central bank’s current direction. His critique focuses on two key concerns: first, that the Fed has strayed beyond its core mandate by engaging in issues like climate change policy and diversity, equity, and inclusion; and second, that its operational approach — particularly the frequency of public commentary by FOMC members — has created unnecessary market uncertainty.
Market participants are closely watching several potential flashpoints. The administration has reportedly considered accelerating the leadership transition by nominating Powell’s successor well before his term concludes, a move that could allow markets to price in policy changes gradually. Warsh’s combination of Republican credentials, Fed experience, and Treasury background makes him the probable choice, although some investors question how his well-documented hawkish views might align with the administration’s apparent preference for easier monetary policy.
The stakes for investors are significant. Any perception of compromised Fed independence could trigger a reassessment of risk premiums across asset classes. Treasury yields may face upward pressure, particularly at the long end of the curve, while the dollar could weaken if markets question the central bank’s commitment to price stability. In other words, concerns about reduced Fed independence could exacerbate the budding US capital flight that we discussed in our recent Asset Allocation Bi-Weekly from May 5, 2025. Perhaps most critically, the Fed’s ability to serve as a stabilizing force during future economic downturns could be diminished if political considerations are seen to influence its decision making.
As this drama unfolds, market participants would be wise to monitor three key developments: the timing and nature of any leadership transition, changes to the Fed’s communication strategy, and, most importantly, whether the central bank can maintain its operational independence while navigating increasingly choppy political waters. The outcome of this power struggle will shape monetary policy and market dynamics for years to come.
Don’t miss our accompanying podcasts, available on our website and most podcast platforms: Apple | Spotify
Asset Allocation Bi-Weekly – Tackling Long-Term Interest Rates (March 3, 2025)
by the Asset Allocation Committee | PDF
In his testimony before the House Financial Services Committee on February 12, Federal Reserve Chair Powell was questioned about why mortgage rates had not declined. In response, Powell emphasized that the Fed primarily influences short-term interest rates, not the longer-term rates such as those tied to mortgages. Despite the central bank cutting its benchmark short-term interest rate — the fed funds rate — by 100 basis points since September 2024, the average 30-year fixed mortgage rate has risen by about the same amount, highlighting a disconnect between the two.
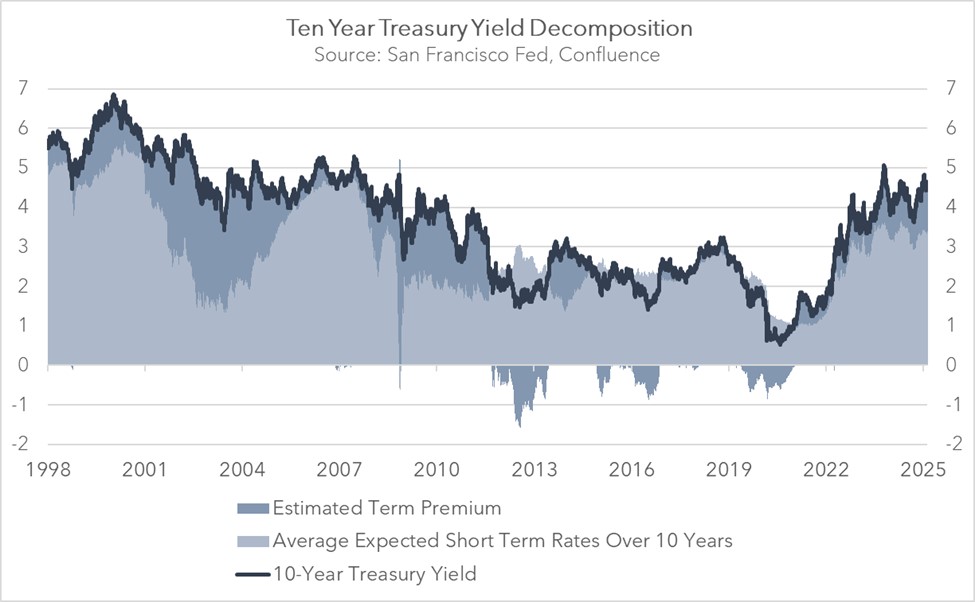
This apparent discrepancy stems from the fact that most interest rates are closely linked to movements in long-term US government bond yields. While average short-term rates, which are largely influenced by the Fed, have remained relatively stable in recent months, the yield on the 10-year Treasury note has picked up.
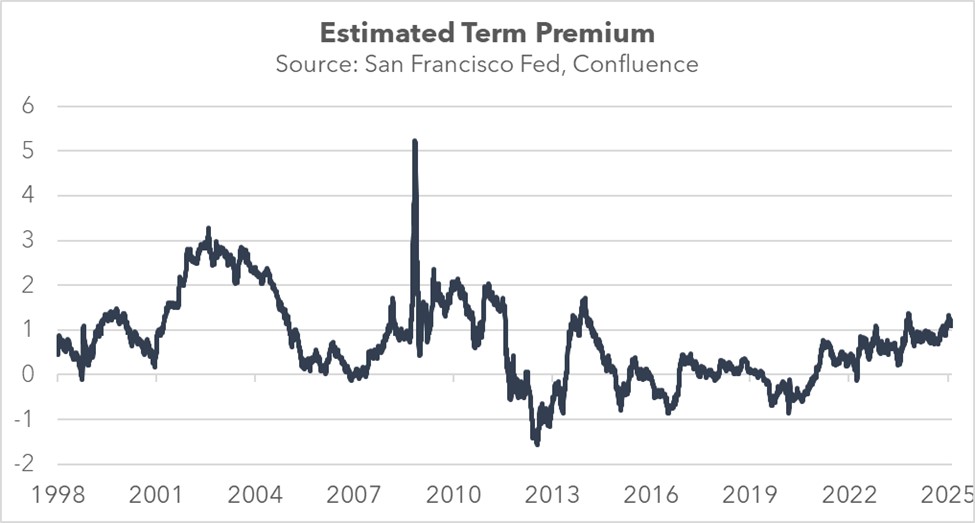
This widening gap between short-term rates and long-term rates, often referred to as the term premium, is an important element for understanding today’s interest rate dynamics (the chart below shows the San Francisco FRB’s estimate of the term premium, which uses expected short-term rates versus the 10-year Treasury yield). The growing gap signals that investors are not relying solely on the Fed’s guidance when valuing assets. This may explain why Treasury Secretary Bessent has emphasized that the administration will focus on reducing 10-year Treasury yields rather than pressuring the Fed to lower its policy rate.
Closing the gap between long-term and short-term interest rates over the next decade will likely be crucial for the administration to reduce borrowing costs effectively for households. This gap represents the premium that investors require to offset risks such as rising bond supply, inflationary pressures, and potential default concerns. To address these challenges, policymakers have proposed a mix of conventional and unconventional strategies.
One conventional approach the administration has taken to help reduce longer-term rates is addressing the US debt problem. The incoming administration has focused on trimming government staffing, reviewing payment systems, and proposing budget cuts to social programs as well as potential cuts to defense spending. On the revenue side, proposed measures include closing tax loopholes, such as the carried interest deduction and special tax breaks for sports teams, while also introducing tariffs to generate additional income.
Additionally, the Treasury has explored alternative methods to manage the 10-year Treasury yield through strategic debt management. One approach involves reallocating Treasury issuance toward shorter-dated bonds, mirroring strategies used by the previous administration. Another proposal includes issuing 100-year “legacy bonds,” potentially targeting foreign governments under the threat of tariffs, as a way to diversify funding sources and stabilize long-term yields.
The administration is also exploring regulatory changes to boost the attractiveness of US bonds. One key proposal would exclude US Treasurys and reserves from the calculation of the supplemental leverage ratio (SLR), which affects bank capital requirements. Excluding Treasurys from the SLR calculation could potentially drive significant bank demand for the obligations. This proposal builds on previous precedent, such as the ’temporary suspension of SLR limits during the pandemic, which aimed to improve market-making capacity and support Treasury values.
The Fed could also support the administration’s efforts in two key ways. First, it could signal a willingness to lower the federal funds rate, which would likely boost demand for Treasury bonds. Second, the Fed could pause its balance sheet reduction or begin bond purchases, which could help ease the current supply imbalance in the bond market. While such actions might appear controversial given the Fed’s traditional independence, it is important to note that the two institutions have a long history of maintaining strong communication and coordination when necessary.
In sum, long-term government bond prices could see a modest rise over the coming months, driven by the policies of the new administration. Longer-term Treasury yields could therefore fall, as we projected in our 2025 Outlook. This would likely lead to lower borrowing costs for everyday households, including reductions in mortgage rates, auto loans, and credit card interest rates. However, while the measures discussed above may help compress the term premium, a meaningful decline in long-term yields will likely require a further reduction in short-term interest rates.
Don’t miss our accompanying podcasts, available on our website and most podcast platforms: Apple | Spotify
Asset Allocation Bi-Weekly – #135 “Tackling Long-Term Interest Rates” (Posted 3/3/25)
Asset Allocation Bi-Weekly – Magnificent 7 to the Rescue! (January 21, 2025)
by the Asset Allocation Committee | PDF
The traditional role of Treasurys as a safe-haven asset has eroded. For example, Treasury prices fell in the last quarter of 2024 despite escalating geopolitical tensions in the Middle East, concerns about global economic growth, and heightened political uncertainty in developed nations. This weakening in the demand for Treasurys was largely driven by investor anxieties over the future rate of inflation and the widening budget deficit. For many market participants, concerns about the outlook for Treasurys have fueled a resurgence of interest in the Magnificent 7 as a target for safe-haven flows.
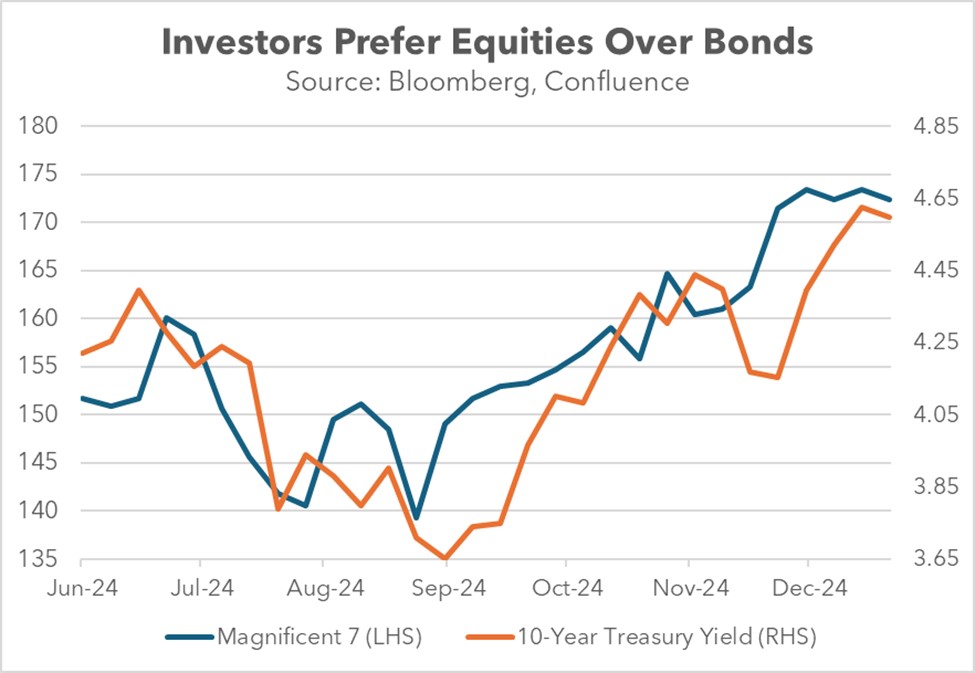
This shift in preference was partly driven by expectations surrounding the incoming administration. Leading up to the election, investors began divesting from US government bonds and purchasing mega-cap tech stocks. This shift reflected growing optimism for a pickup in economic growth and declining confidence in the Federal Reserve’s ability to cut interest rates. Consequently, from September to December, the yield on the 10-year Treasury note surged nearly 100 basis points, while the Magnificent 7 stocks surged almost 24%.
The unraveling began when the Federal Reserve initiated a series of rate cuts last fall. Despite the Fed lowering interest rates by 100 basis points across its final three meetings, the 10-year Treasury yield surged by a comparable amount instead of declining. This divergence stemmed from policymakers’ reluctance to commit to further monetary easing, particularly as the economy showed signs of accelerating. The presence of two dissenting votes during these meetings further reinforced concerns that the central bank may be hesitant to loosen policy.
The Fed’s unwillingness to commit to aggressive rate cuts has led investors to turn to equities. Growing optimism about economic growth propelled the S&P 500 above 6,000 for the first time ever. The change in investor sentiment was further reinforced by growing confidence from the outcome of the November election, which is widely expected to favor policies that will bolster corporate earnings and consumer demand.
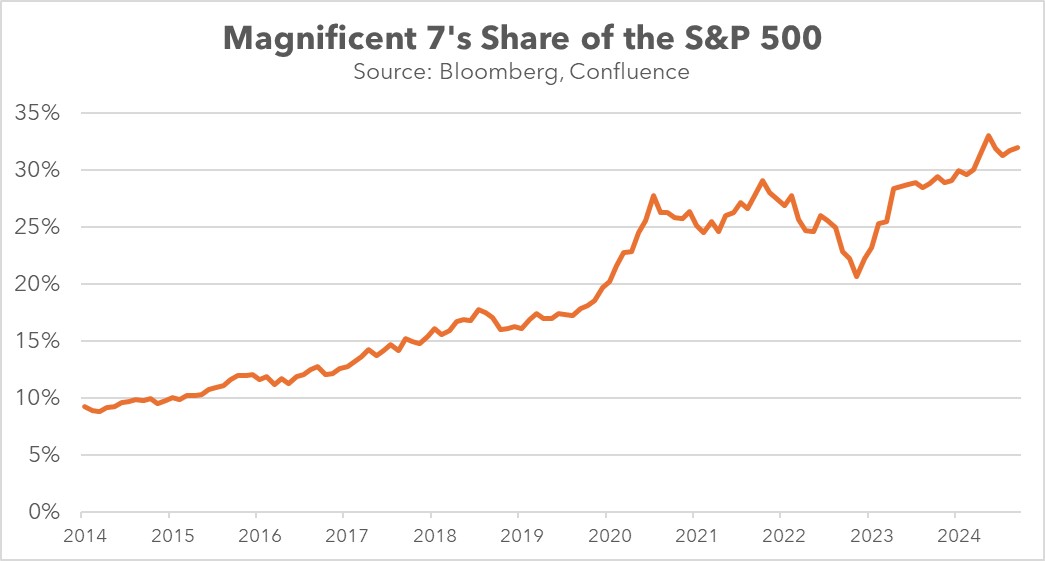
Specifically, investors gravitated toward the Magnificent 7, a cohort of tech giants perceived as capable of generating robust earnings and rewarding shareholders even in a high interest rate environment. This group, which makes up more than a third of the S&P 500’s market capitalization, is projected to significantly outperform the broader index in Q4 earnings, with an estimated 20.7% growth compared to the S&P 500’s overall projected growth of 11.9%.
While stock-price appreciation has been a strong motivator, investor preference for the Magnificent 7 has been further solidified by the companies’ intent to increase shareholder returns. Last year witnessed some notable examples, including Meta and Alphabet issuing their first dividends, Apple executing a massive $110 billion stock buyback, and Nvidia announcing a stock split. The potential for these companies to produce robust earnings growth, coupled with the prospect of lower corporate tax rates, would further enhance their ability to return capital to shareholders.
Looking forward over the coming year and beyond, uncertainty about the future trajectory of interest rates and the fiscal outlook will likely continue to weigh on bond values. Some safe-haven buying may therefore shift to gold and other precious metals, while others could shift to large, stable, dividend-paying value stocks. Still, it wouldn’t be a surprise if many investors favor large cap growth companies because of their strong track record of consistent earnings growth and demonstrated commitment to shareholder returns. However, we think that investors trying to use large cap growth stocks as a safe haven should remember that they are currently very richly valued and could be at risk for correction at some point. Investors should remain mindful of their true risk tolerance before using growth stocks like the Magnificent 7 for safe-haven purposes.