

Weekly Energy Update (March 10, 2022)
by Bill O’Grady, Thomas Wash, and Patrick Fearon-Hernandez, CFA | PDF
Oil prices have spiked but are being hit by waves of profit-taking.
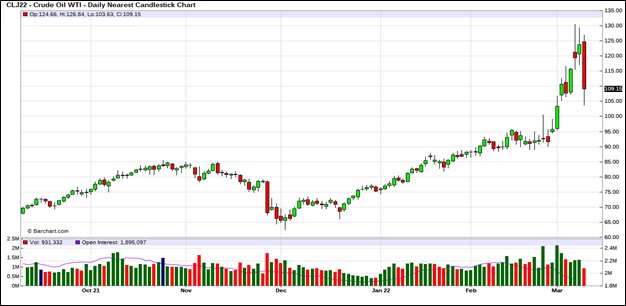
(Source: Barchart.com)
Crude oil inventories unexpectedly fell 1.9 mb compared to a 1.5 mb draw forecast. The SPR declined 2.5 mb, meaning the net draw was 4.4 mb.
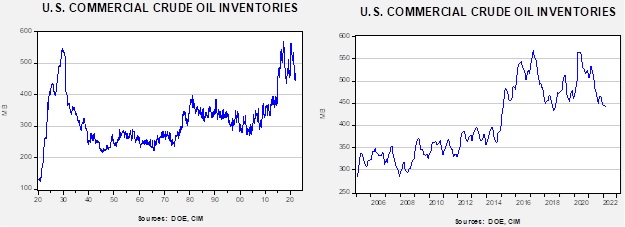
In the details, U.S. crude oil production was unchanged at 11.6 mbpd. Exports fell 1.4 mbpd, while imports surged 1.9 mb. Refining activity rose 1.6%.
(Sources: DOE, CIM)
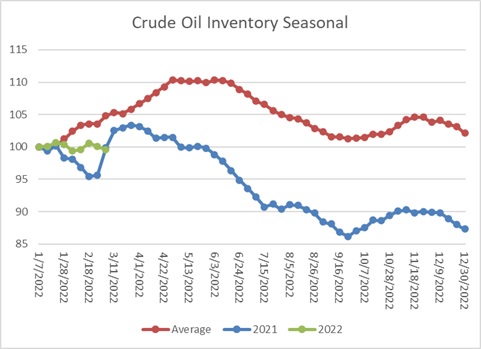
This chart shows the seasonal pattern for crude oil inventories. This week’s report suggests inventories are mostly holding steady, meaning the seasonal deficit is continuing to widen.
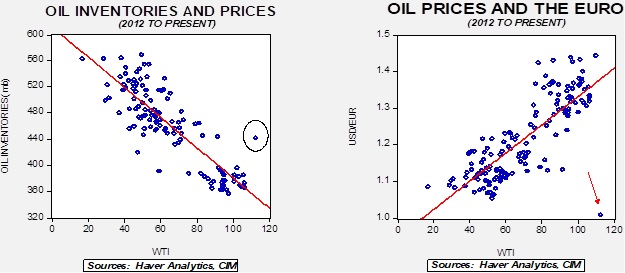
These charts make evident that the normal relationships between the dollar, inventory, and oil prices are currently broken. Both these variables would suggest oil prices are wildly overvalued, but the war clearly overrules their impact.
High gasoline prices tend to be a political and social problem. Gasoline is just about the only product consumers buy where the prices are prominently displayed. Recently, U.S. average prices rose above $4.00 per gallon, leading the media to point out this level is near all-time highs. However, that price isn’t scaled in any fashion. Rather than scale by consumer prices, we like to scale gasoline prices relative to the hourly wage for non-supervisory workers. Using that measure, we are not at new lows in terms of what an hour’s worth of work can buy in gasoline.
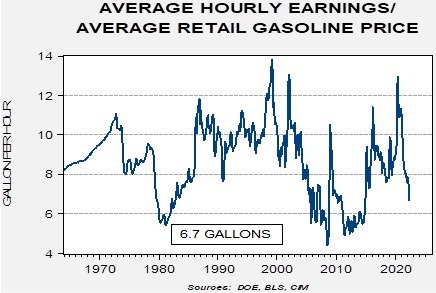
Currently, an hour’s worth of work will buy about 6.7 gallons of gasoline. The average since 1965 is 8.6 gallons, with a standard deviation of 1.9 gallons. That means the current level is about one standard deviation from the mean. The level of gasoline prices isn’t yet a major crisis but breaking below 6 gallons will likely be the point where demand destruction emerges.
Market news:
- After deliberation, the Biden administration finally moved to ban Russian energy imports. Russia is an important source of oil and products for the U.S., but not one that probably can’t be replaced. That isn’t the case for Europe.

- In light of this decision, Russia is considering cutting natural gas supplies to Europe.
- As the geopolitical risks of energy dependence on Russia become increasingly clear, the EU is making aggressive plans to diversify its energy sourcing beyond Russia. The EU wants to reduce Russian gas dependency by 66% in 12 months. To facilitate this action, the EU will need to take difficult actions that will put growth at risk. Ultimately, it will probably not be possible to fully replace Russian energy without demand destruction.
- Self-sanctioning is growing. In our view, the expansion of social media has created a situation where firms loath to be seen in a bad light. In the past, social movements to punish companies for business practices were difficult to organize, but with social media, actions can be taken rapidly. There are reports of Russian tankers at sea without a buyer. Russian oil is not being accepted for sale. These actions go beyond regulatory actions by governments and may be difficult to control.
- As we note below, the administration is courting nations with unsavory histories to ease the strain on energy supplies. At the same time, U.S. domestic producers have been facing both regulatory and “self-sanctions” activities via ESG that have restrained output. The oil industry wants these constraints relaxed. Even if conditions improved immediately, it would take time for the U.S. shale industry to ramp up production. It should be noted the industry itself has been focusing on shareholder return instead of output, although high prices may undermine that discipline at some point.
Geopolitical news:
- To boost oil supplies, the U.S. has been working on three avenues.
- The administration has been negotiating with Iran to return to the 2015 nuclear deal, which would allow the U.S. to lift sanctions and increase Iranian oil supplies. Those talks are now at a critical point. Russia, a party to the 2015 agreement, wants guarantees it can trade with Iran without restrictions if a deal is reached; we suspect the U.S. will not support that effort. The issues that have bedeviled the talks from the start, which are mostly tied to Iran’s power projection in the region, remain a sticking point.
- The Biden administration has taken a dim view towards Saudi Arabia, especially the defacto leader, Crown Prince Mohammed bin Salman. But needing more oil, the president has hinted at a trip to the region. So far, there is little indication the KSA is open to such pleas.
- Venezuela has been under U.S. sanctions since 2019. The U.S. has sent a delegation to Caracas to see if the U.S. could get oil from Venezuela if restrictions were relaxed. We note Venezuela has released Americans from prison in what appears to be an effort to ease tensions, but the talks do not appear to have been all that successful.
- The political optics of these actions are not favorable.
Alternative energy/policy news:
- In light of the energy disruption, Elon Musk is backing more nuclear power.
- Asia is expanding its efforts in carbon capture.
- There is increasing investment in electricity generation that is co-fired with hydrogen and natural gas, preparing for an expansion of hydrogen supplies.