

Tag: inflation
Bi-Weekly Geopolitical Report – Excess Capacity and Policy Change (June 8, 2026)
by Patrick Fearon-Hernandez, CFA | PDF
A key challenge of the big-picture, top-down investment analysis that we do at Confluence is tracing the real-world impact of a country’s economic policy initiatives. Whether policymakers are trying to boost economic growth, bring down price inflation, or achieve another goal, our aim is to figure out if the reform will be successful and the unintended consequences, be they positive or negative. Our ultimate objective, of course, is to determine the implications for financial markets and investment strategy.
One thing we’ve noticed is that many strategists attempting top-down analysis make overly simplistic assumptions about the likely effect of specific policy changes. They often ignore the fact that the same policy can be wildly successful or unsuccessful, depending on the pre-existing economic structure or conditions in place at the time. In this report, we show that one vital issue is the level of excess capacity in an economy. Many vaunted reforms in history were successful only because they were implemented when the economy had plenty of excess capacity to accommodate them. Many then conclude that those reforms would always be successful no matter what. We caution here that a deeper analysis is required to really understand any reform’s success and its financial market implications.
Don’t miss our accompanying podcasts, available on our website and most podcast platforms: Apple | Spotify
Asset Allocation Bi-Weekly – #160 “Wars, Price Shocks, and Inventories” (Posted 4/17/26)
Asset Allocation Bi-Weekly – Wars, Price Shocks, and Inventories (April 13, 2026)
by Patrick Fearon-Hernandez, CFA | PDF
Since the launch of the US-Israeli war against Iran on February 28, if there’s been one dramatic feature, it’s that the conflict and official statements about it have shifted dramatically almost on a daily basis. By the time this report is published, the war could be going in a wholly different direction from when we started writing it. Nevertheless, we do think we can make some predictions about how the conflict will affect the global economy over the long term. One such prediction touches on how corporate behavior may change in the future. Specifically, we think the war will spur companies to once again embrace high inventories to shield themselves against supply disruptions and associated price jumps. A broad return to higher inventories will likely have important implications for corporate profitability, facility-site decisions, and stock valuations.
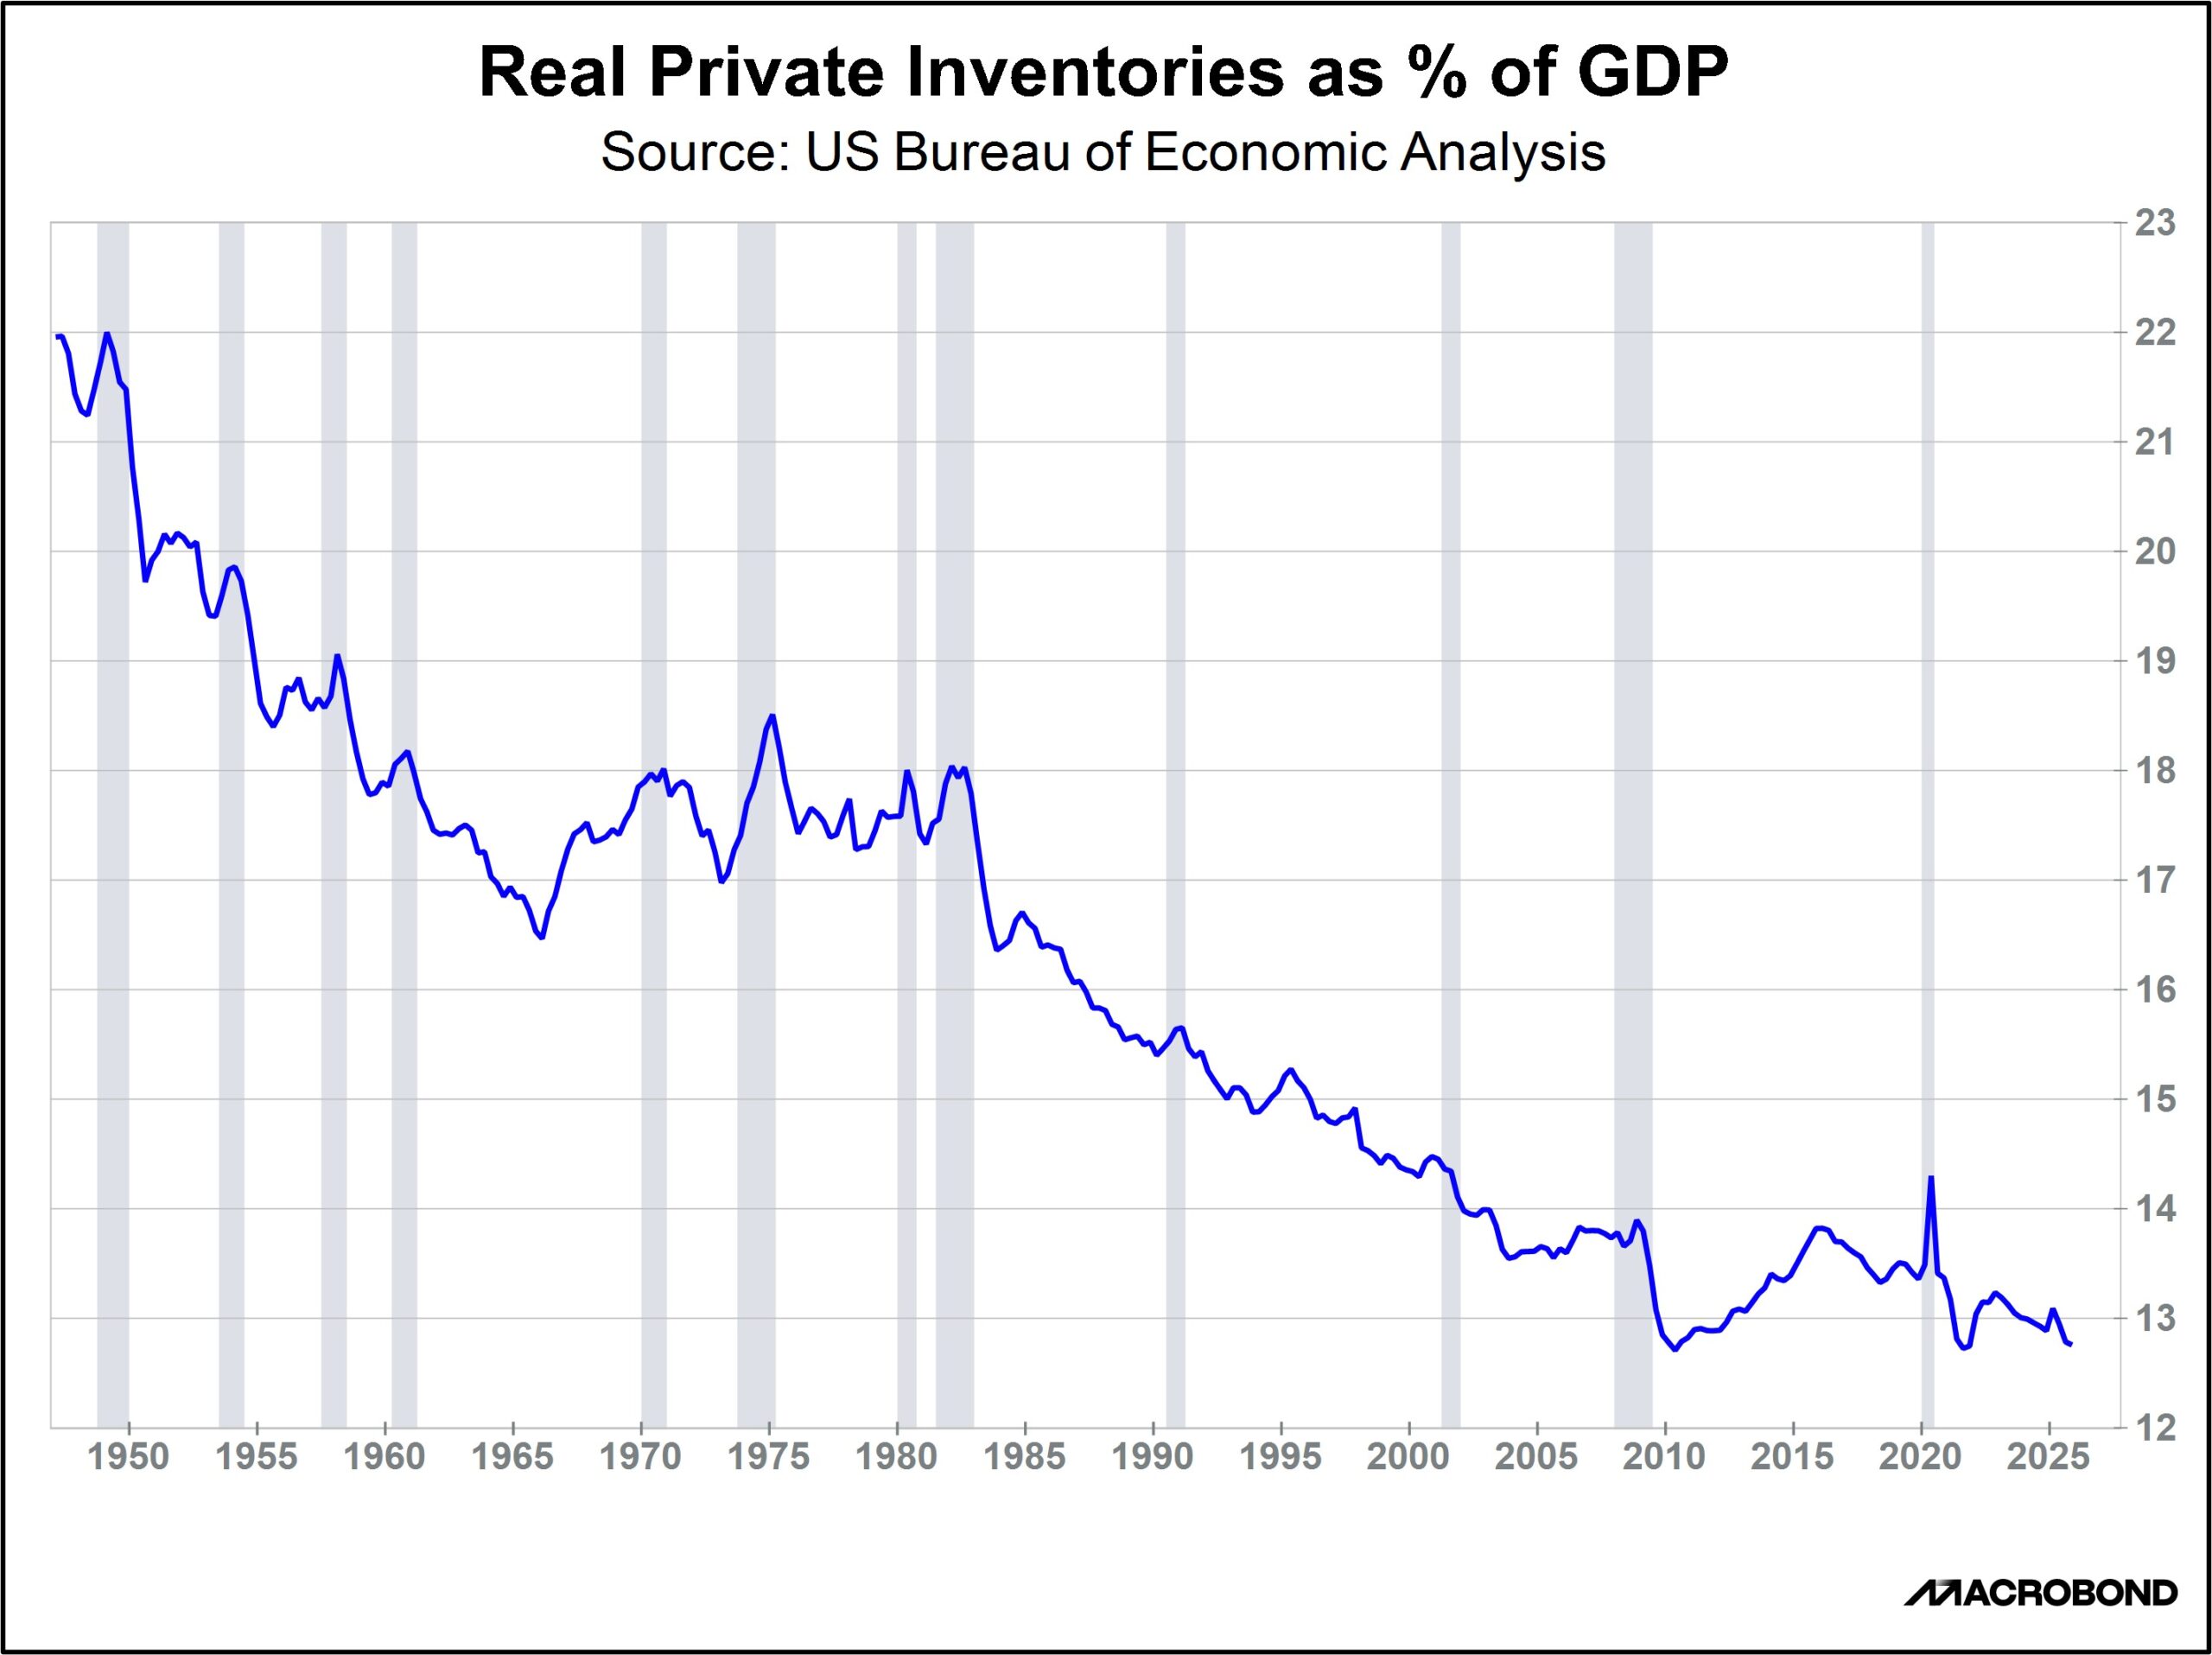
The chart above shows the inflation-adjusted value of US private sector inventories as a share of gross domestic product (GDP) since the end of World War II. Clearly, the overall trend has been for companies to hold less inventory compared with their sales. What explains this? We believe many factors are responsible. For example, the extremely high inventories around World War II and the Korean War probably reflected hoarding at a time of limited consumer sales. Inventory holdings would have naturally fallen as the end of those conflicts allowed for normalized supply dynamics and rebounding consumer spending. At the same time, innovations in transportation quickened delivery times and reduced freight costs, while the information technology revolution improved the ability of firms to optimize inventory holdings. And, as we’ve argued many times before, the end of the Cold War convinced many business managers that global peace was at hand and that competing in the era of globalization required using just-in-time inventory management.
Equally noteworthy, the decline in price inflation since the early 1980s has made inventories less needed. Indeed, the chart above shows a long, steep decline in inventory ratios starting in the early 1980s when the Federal Reserve under Chair Paul Volker hiked interest rates and Congress passed a series of deregulation bills, both of which slashed price pressures on the economy. Just as important, the chart clearly shows how rising inflation in the 1960s and the energy crises of the 1970s prompted a big jump in inventory holdings equal to about 1% of GDP. The chart also shows that after commodity prices surged around 2005, firms boosted their inventory holdings. That inventory investment was short-circuited by the US housing crisis, but once the recovery started, inventories climbed back to almost 14% of GDP.
This review of history suggests that as company management internalizes the commodity supply shocks and rising prices associated with the war in Iran, there will likely be a rebuilding of inventories. More broadly, as it becomes increasingly clear that the war reflects a wider geopolitical change marked by a US retreat from hegemony, global fracturing, and increased international tensions, we think the rebound in inventories could be bigger and longer lasting than the one in the early 2000s. We also believe this trend will extend beyond the US, with companies around the world incentivized to boost their inventory holdings again.
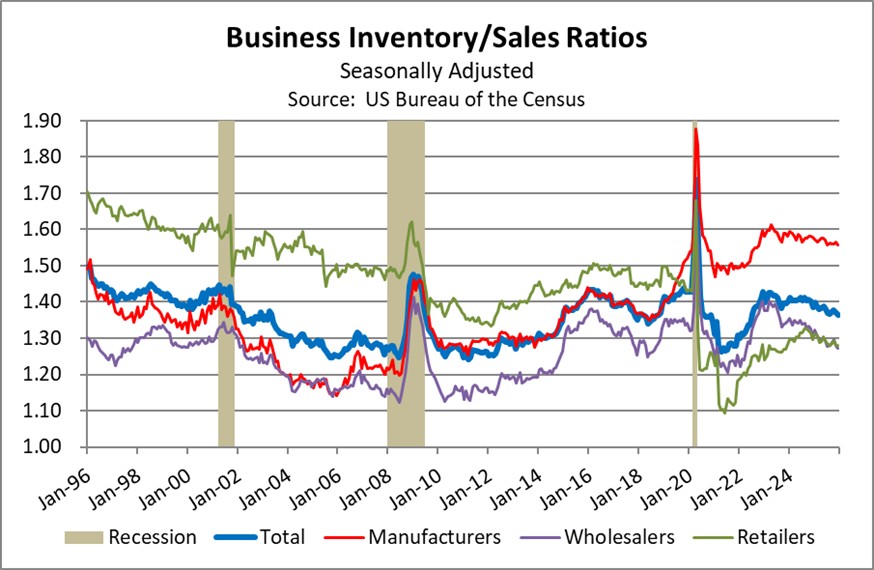
What firms will be most affected? In the chart above, we focus on the US Census Bureau’s current series of monthly business sales and inventory data, in nominal terms, which allows us to trace corporate inventory/sales ratios by sector. The chart clearly shows that the rise in the overall inventory/sales ratio since the early 2000s has come from higher manufacturing stockpiles. This makes sense to us, as supply disruptions and higher costs for inputs and components are probably more important for manufacturers than for wholesalers or retailers. Going forward, we suspect that the Iran war will especially boost inventory holdings at the factory level.
In our view, any broad, sharp rise in manufacturers’ inventories from here on out will have significant investment implications. For example, holding more inventories will tie up more of manufacturers’ capital and increase costs. Investors are therefore likely to put higher valuations on the stocks of manufacturing firms that can better control their inventory levels, all else being equal. Given that the US is now a net energy exporter and has significantly greater levels of secure supplies of oil, gas, and other key commodities, we expect many foreign manufacturers to move production to the US, helping to reindustrialize the US economy and stimulating business for US suppliers. The need to store more inventory could also lead to increased demand and stronger rents for firms that own commercial warehouses. All the same, higher inventories will generally result in a less efficient economy than in the just-in-time world of globalization, so price inflation is still likely to be higher and more volatile than in years past, and the same will likely be true for interest rates.
Don’t miss our accompanying podcasts, available on our website and most podcast platforms: Apple | Spotify
Asset Allocation Bi-Weekly – #158 “Are Long-Term Treasurys No Longer a Safe Haven?” (Posted 3/16/26)
Asset Allocation Bi-Weekly – Are Long-Term Treasurys No Longer a Safe Haven? (March 16, 2026)
by Patrick Fearon-Hernandez, CFA | PDF
Historically, major geopolitical or economic crises, such as the war against Iran, have prompted investors to sell riskier assets and buy “safe-haven” investments whose values were expected to remain stable or even rise amid the disruptions. The most popular safe havens have been the US dollar, gold, and longer-term US Treasury obligations. Faced with the crisis, or the prospect of one, investors would typically bid up the value of the dollar versus other currencies. Many would also avidly buy up gold, driving prices for the precious metal upward. Others would snap up Treasurys, boosting their values and pushing their yields down. However, market action so far during the Iran war has defied expectations. Treasury demand has been relatively muted, and yields have been markedly resilient. This raises the question of whether long-term Treasurys are still a safe haven. And if not, why?
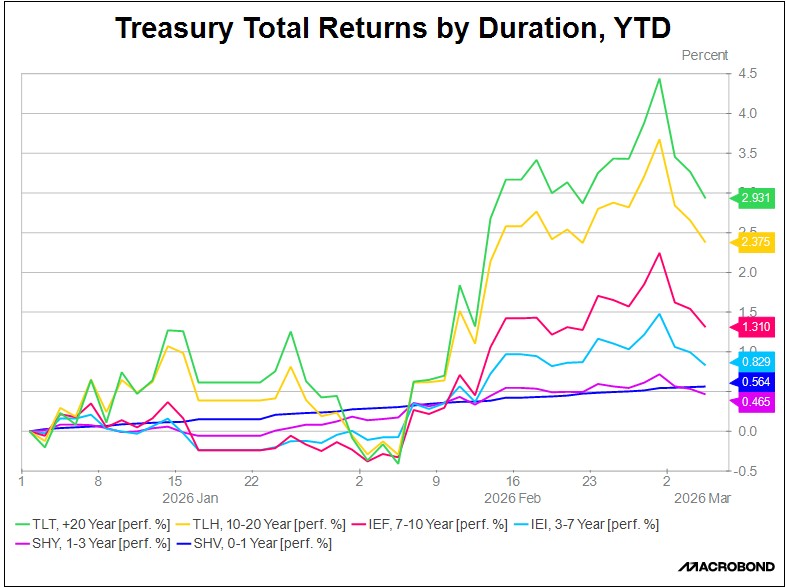
One way to see the unusual performance of long Treasurys is to compare their recent total returns versus shorter-term Treasurys. In the chart above, we show the total return (price change plus interest) for exchange-traded funds (ETFs) tracking Treasury obligations maturing in 20+ years (TLT), 10-20 years (TLH), 7-10 years (IEF), 3-7 years (IEI), 1-3 years (SHY), and 0-1 year (SHV). The graph shows how Treasurys of all tenors were bid up starting in mid-February, when it became clear that the US was prepping for a potential strike against Iran. However, once the war started, investors sold off Treasurys. The selling was especially strong for long-duration obligations as investors began to realize that the conflict could be more drawn out than anticipated, driving up global energy prices and rekindling consumer price inflation.
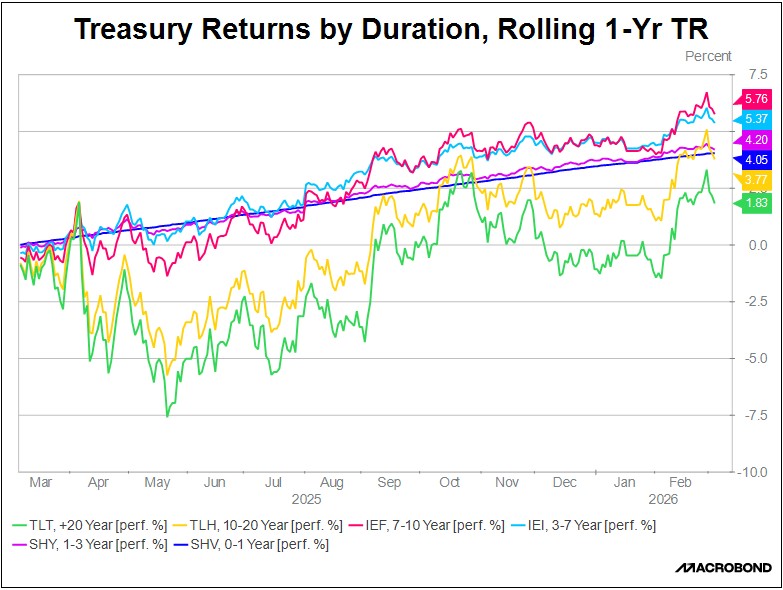
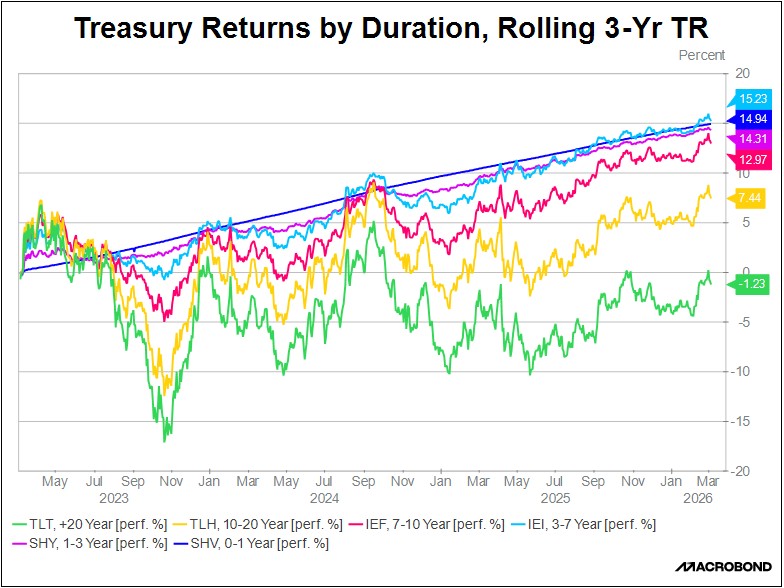
Importantly, the outsized selling of long Treasurys came after a protracted period of weak returns. The chart above displays Treasury total returns by duration over rolling one-year periods. It shows clearly how one-year returns from long Treasurys have lagged since early 2025.
Indeed, long-term Treasury returns have lagged for quite some time. The final chart, on the next page, shows that three-year returns for long Treasurys have not only lagged shorter-term Treasury returns, but they have also lost money in the latest three-year period. This happened even though the Federal Reserve has been cutting its benchmark fed funds interest rate since September 2025. In contrast, shorter-term Treasury securities have offered steady positive returns. Shorter-term Treasurys have largely held their value even after the Iran war started and it became clear that the conflict would threaten global energy supplies and risk reigniting inflation.
Why have long Treasurys lost their attraction as a safe haven? We believe their weakness reflects increased investor concerns about US fiscal dynamics, prospects for a more politicized Fed, and fear of currency debasement. The key evidence for this has been the sell-off in long Treasurys after the war started, once it became clear that the conflict could last long enough to seriously disrupt energy supplies and cause rising global inflation. If investors were truly confident that the Fed would temporarily hike interest rates as needed to wring the inflation out of the economy and protect the purchasing power of the dollar, then demand for Treasurys should have gotten a boost from wartime safe-haven buying. However, the fact that Treasurys have not behaved as usual suggests they may have lost a lot of their cache as a safe haven. As investors also sell off gold to cover margin requirements and raise needed cash, it seems like they only see one true safe-haven asset these days, i.e., cash.
Don’t miss our accompanying podcasts, available on our website and most podcast platforms: Apple | Spotify
Asset Allocation Bi-Weekly – #156 “The Warsh Doctrine” (Posted 2/17/26)
Asset Allocation Bi-Weekly – The Warsh Doctrine (February 17, 2026)
by Thomas Wash | PDF
When Kevin Warsh, President Trump’s nominee to be the next Federal Reserve chair, last departed the central bank in 2011, it was more than a career move — it was an act of ideological dissent. He cautioned that the Fed’s post-crisis expansion of authority would erode its institutional independence and set the stage for future inflation. Now, nearly 15 years later, he will return with a clear mandate: to unwind those interventions and champion a leaner, less market-intrusive central bank built on a simplified monetary framework.
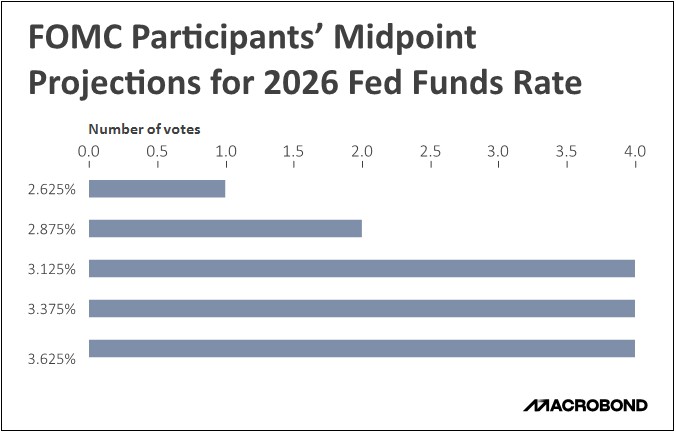
The institution he will rejoin, however, is profoundly transformed. The modern Fed has formalized its once-implicit 2% inflation target and fully embraced aggressive forward guidance. Through more frequent press conferences and the now-institutionalized Summary of Economic Projections, complete with its influential “dots plot,” the central bank has made transparency a core tool of policy. These measures aim to give markets a clearer sense of the Fed’s thinking and its likely policy trajectory.
Beyond the expansion of quantitative easing, the Fed has also entrenched its market presence by establishing permanent liquidity backstops. The Standing Repo Facility and the Overnight Reverse Repo Facility were created to reinforce the financial system’s plumbing, ensuring that the central bank can swiftly manage short-term interest rates and ease liquidity strains without resorting to ad hoc crisis measures.
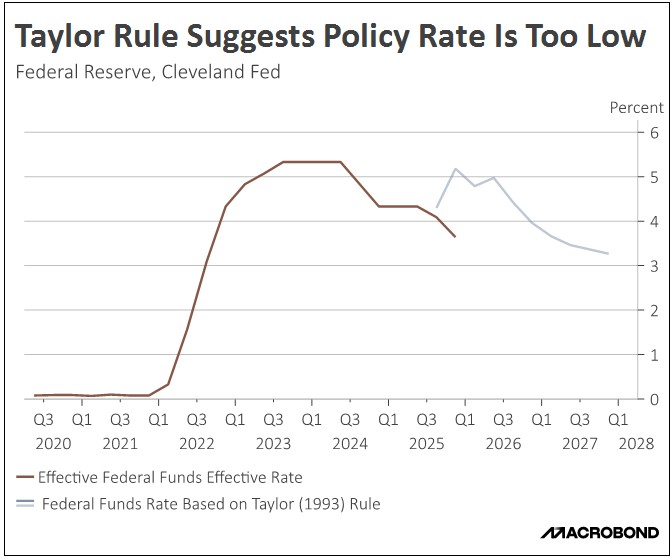
Under a Warsh-led Fed, we are likely to see a pivot toward operational simplicity aimed at reducing market uncertainty, though not without significant caveats. Warsh has historically championed a rules-based framework, where monetary policy is anchored to a transparent set of metrics. This would allow markets to more accurately self-price the direction of rates. However, in recent months, Warsh has moderated this stance, characterizing a “strict adherence” to rules as being more aspirational than absolute.
This evolution hints at a broader philosophical shift. A Warsh-led Fed may bring a chair (like Greenspan before him) willing to look beyond rigid economic models and instead rely on forward-looking judgment. Just as Greenspan saw transformative potential in the internet, Warsh sees it today in artificial intelligence, calling the current productivity surge “the most significant of our lives past, present, and future.”
This conviction clarifies why Warsh has hinted at temporarily overriding rules-based policy prescriptions in favor of lower interest rates, a tactical deviation based on his view of shifting productivity frontiers. His logic is that lower rates will stimulate corporate capital expenditure, thereby boosting investment to expand the economy’s productive capacity. This supply-side expansion could, in turn, help to lower inflationary pressures.
Furthermore, Warsh appears skeptical of a rigid 2% inflation target, having once dismissed it as “arbitrary.” Instead, he has advocated for a flexible inflation target band. Such a framework would grant the central bank greater operational leeway, providing a wider window to assess economic conditions before deciding the optimal course for rate adjustments.
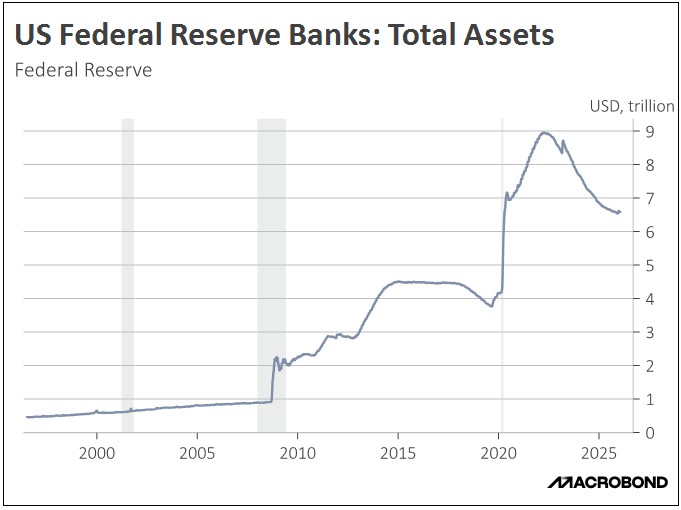
This does not mean Warsh would avoid pursuing a restrictive monetary policy. One area where he seems particularly focused is the normalization of the Fed’s balance sheet. Last May, he stated that if the balance sheet were to grow in line with the broader economy, it would stand at roughly $3.0 trillion. This suggests he might support allowing the current $6.6 trillion balance sheet to continue shrinking until it returns closer to that level.
As Warsh prepares to take the helm of the Fed, we anticipate a decisive but complex pivot. The guiding principle would be a return to a less transparent, more orthodox central bank, likely scaling back forward guidance to force markets toward greater self-reliance. The tension lies in the application. While being openly accommodative toward rate cuts to nurture AI-driven growth, he would almost certainly counterbalance this with a hawkish, determined campaign to shrink the Fed’s balance sheet.