by Bill O’Grady, Thomas Wash, and Patrick Fearon-Hernandez, CFA | PDF
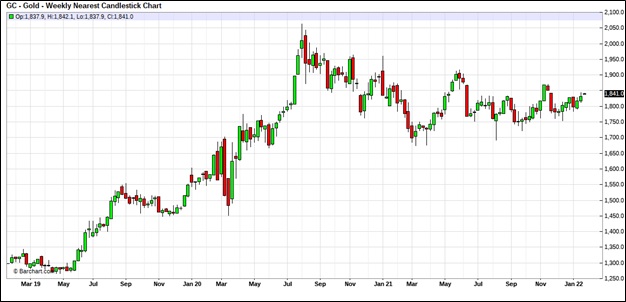
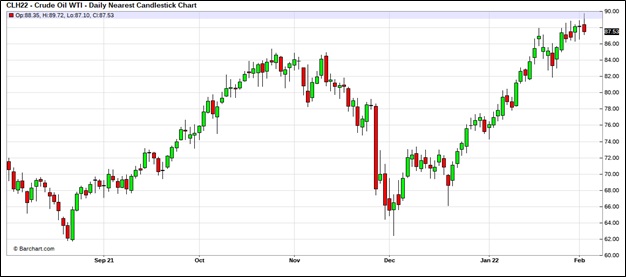
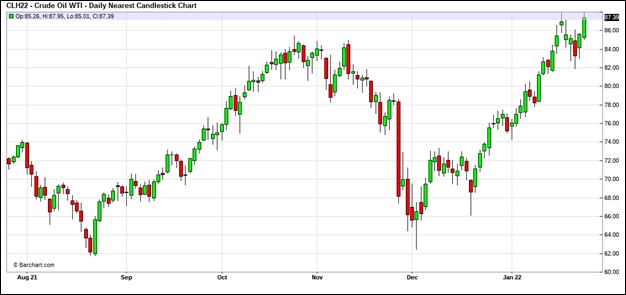
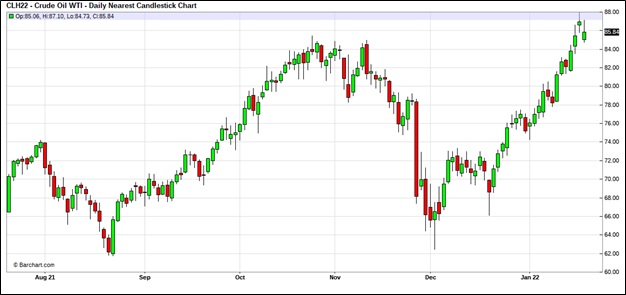
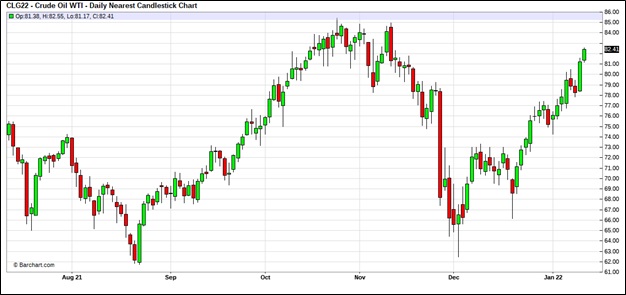
After breaking above $90 per barrel late last week, prices have modestly retreated.
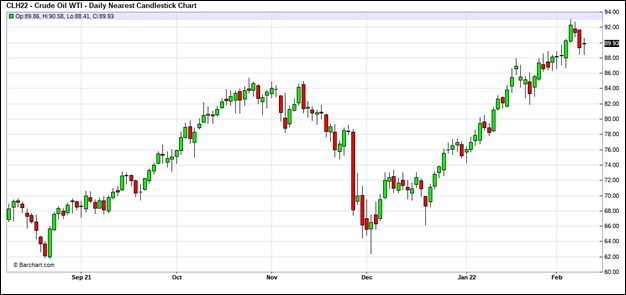
(Source: Barchart.com)
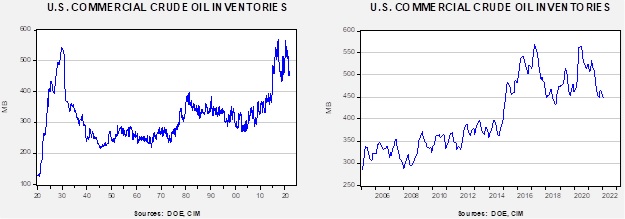
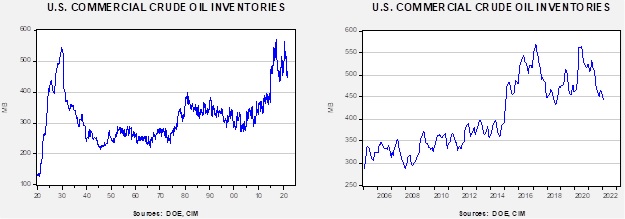
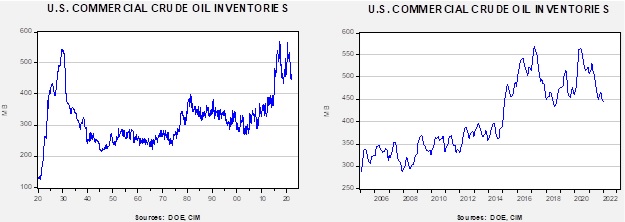
Crude oil inventories unexpectedly fell 4.8 mb compared to a 1.4 mb build forecast. The SPR declined 1.4 mb, meaning the net draw was 6.2 mb.
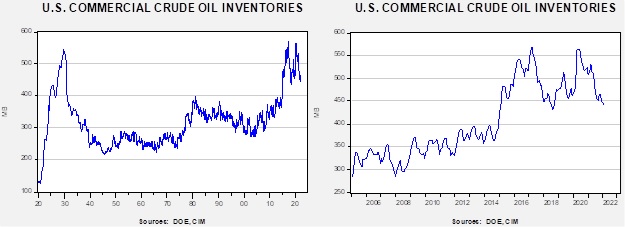
In the details, U.S. crude oil production rose 0.1 mbpd to 11.6 mbpd. Exports rose 0.7 mbpd while imports fell 0.7 mbpd. Refining activity jumped 1.5%.
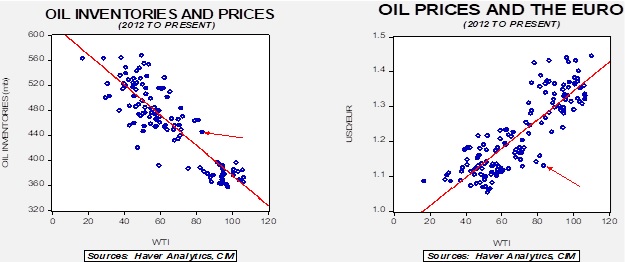
(Sources: DOE, CIM)
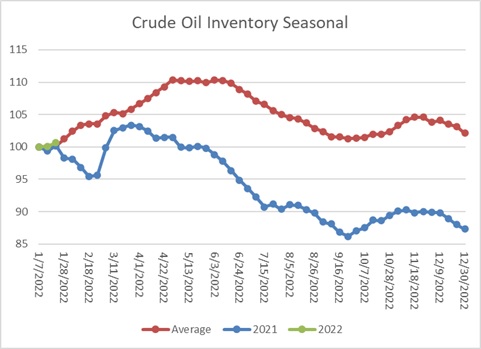
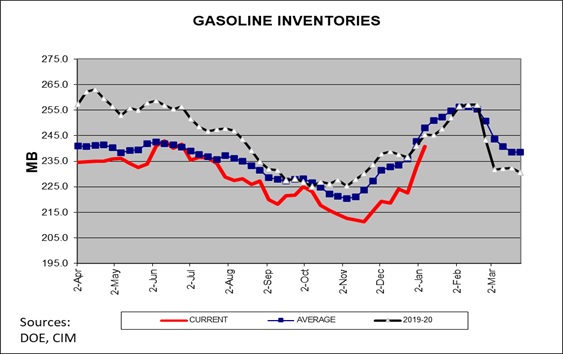
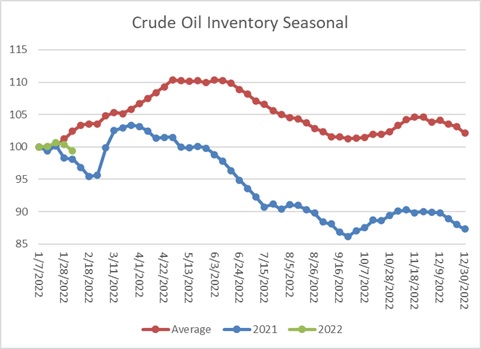
This chart shows the seasonal pattern for crude oil inventories. This week’s report shows a definitive shift towards tracking last year. If that continues, we can expect falling oil inventories for the next three weeks.
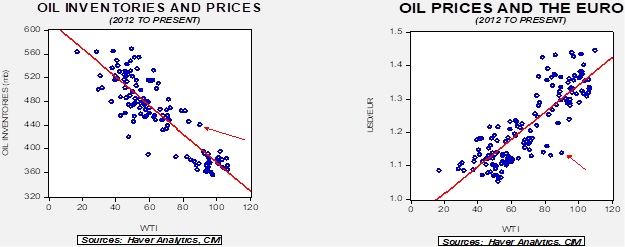
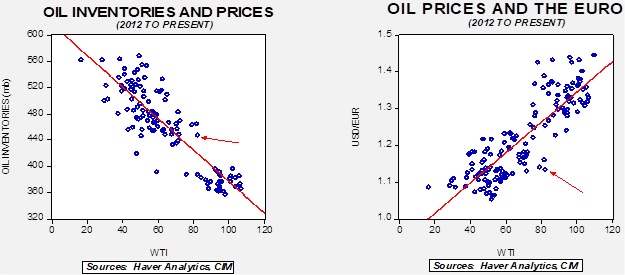
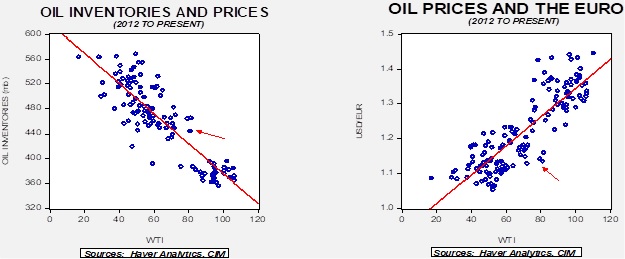
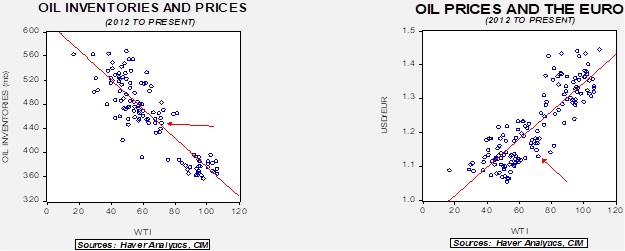
Based on our oil inventory/price model, fair value is $71.33; using the euro/price model, fair value is $55.34. The combined model, a broader analysis of the oil price, generates a fair value of $64.08. Current prices exceed our model projections by a wide margin, but price momentum and worries about future supply constraints will like keep prices elevated.
Market news:
- Oil prices have been correcting this week as the market discounts a potential deal between Iran and the U.S. to restart the JCPOA; we discuss the detail in the Geopolitical news section. Technically, oil prices were elevated and ripe for a bout of profit-taking.
- The Permian Basin may see a surge in production. One advantage to shale oil drilling is that there is a short time between investment and production. The decline rates are rapid, meaning the payoff comes rather quickly. In an era of long-term uncertainty, these characteristics make the region attractive. However, it should be noted that a side effect of fracking, the process used to extract oil from shale, is an increase in seismic activity. Such increases and related regulations may undermine future production.
- There is an uptick in anti-oil litigation at the state level, which may add to costs or reduce future production.
- For reference, here is a site that tracks power outages across the country.
Geopolitical news:
- There is growing hope that the U.S. and Iran will return to the 2015 nuclear deal. Negotiators suggest that talks are entering their “final stages.” If any deal is struck, it will mostly be a matter of convenience. Iran has made important progress in generating nuclear materials to the point where it is unlikely it will return fissile inventories back to 2015 levels. Thus, the U.S. would simply have to accept that this part of the deal won’t be maintained. One reason for optimism is that the U.S. has allowed Iran access to funds it holds in Iraq, a good-faith gesture. The U.S. has also rescinded a sanction on third-party firms working on nuclear non-proliferation and safety projects in Iran. Easing sanctions would likely bring a modest increase in oil supplies. Given the political pressure that comes with high oil prices, any reduction would be a welcome relief. At the same time, there is no political benefit in the U.S. for appearing “soft” on Iran. On the Iranian side, there is a deep distrust of the U.S. and opposition to any sort of agreement. Meanwhile, the Iranian economy has suffered greatly from sanctions and the pandemic, and internal tensions are increasing. Leaks from hacks suggest rising internal dissension within the regime as well. It is possible Iran will take a deal to reduce pressure.
- Nonetheless, the idea that easing sanctions will dramatically increase global supplies is probably misplaced. Iran has been seeing oil surreptitiously for some time, and the chance that a new U.S. administration could reverse the current government’s policy on Iran is high. Thus, it is unlikely that new foreign investment will be forthcoming.
- Mongolia has large solar and wind capacity, which may eventually reduce demand for Russian natural gas.
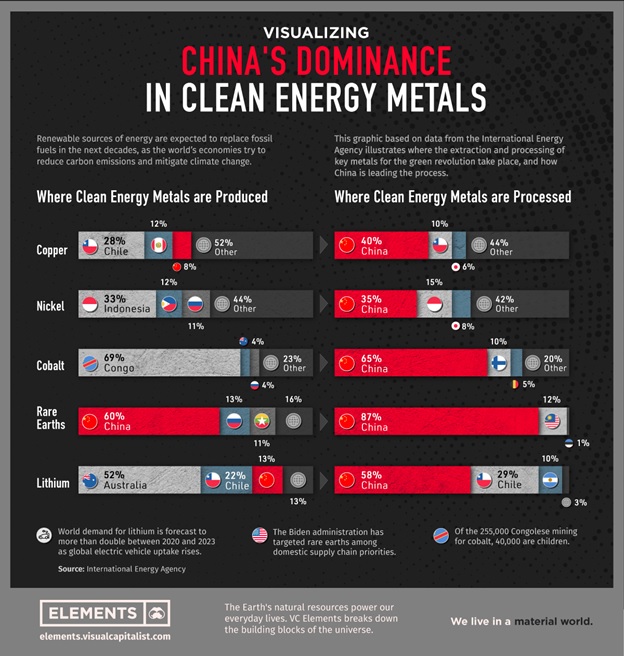
- Australia is supporting rare earths mining within its borders to reduce China’s market power over these key metals. However, it isn’t clear if processing capacity will expand, which is another area where China dominates rare earth metals.
- Turkey has been taking a mediating and supportive role in the Russian/Ukraine situation. Turkey is also trying to improve relations with Iraq.
- The EU is considering steps to shield households from a spike in natural gas prices if a war in Ukraine breaks out.
- The U.S. bombed a house where the leader of IS, Abu Ibrahim al-Hashimi al-Qurayshi, was residing. The leader of the insurgent group died in the exchange. Although removing the leader of IS is favorable news, it probably won’t curtail the group’s activities.
Alternative energy/policy news:
- One area of alternative energy that doesn’t attract much attention is geothermal energy. Tapping heat from the nether regions could provide clean and abundant power. Recently, firms in the industry have started raising money for projects.
- Another area that has attracted attention is nuclear fusion. This energy source would generate power in the same way the sun does, potentially creating massive levels of energy at a low cost. Scientists recently announced a significant development in making fusion a practical energy solution.
- China is building a new hydrogen electrolyzer plant, importing the technology from the West.
- One problem of solar and wind power is the issue of intermittency. Increasingly, utilities are deploying banks of batteries to ensure a steady flow of power.
- Pumped hydro storage is another old alternative energy. In most cases, utilities pump water up a hill to a reservoir when electricity demand is low, and then allow the water to flow down the hill through dams into another reservoir to generate cheap hydropower. A new design is putting vessels within a body of water and using excess power to push any water in the vessel out. When power needs to be generated, the vessel is opened, and water rushes in to eliminate the vacuum.
- The EU has designated natural gas and nuclear energy as “green.”
- Russia is a major oil and gas producer; it is also a source of metals. Siberia has large copper reserves, but mining in the region is a challenge. Recent high copper prices are leading to renewed interest and investment in the region.