


Tag: interest rates
Asset Allocation Bi-Weekly – What “Real” Interest Rates Are Telling Us (October 5, 2026)
by Patrick Fearon-Hernandez, CFA | PDF
One of the most important concepts in economics and finance is the “real” rate of return on an investment. The real rate is calculated by subtracting the rate of consumer price inflation from the nominal interest rate, bond yield, or price gain and dividends on a stock. If the nominal return on the investment is more than the rate of inflation over a specific holding period, the asset owner would have increased his or her purchasing power (before taxes). In contrast, even if the nominal return on the investment is positive, it can be less than price inflation. In this case, the asset owner’s purchasing power will have fallen. Expected nominal returns and inflation therefore can have a big impact on the demand for a particular asset. From a broad economic perspective, they can also affect the overall rate of investment and economic growth.
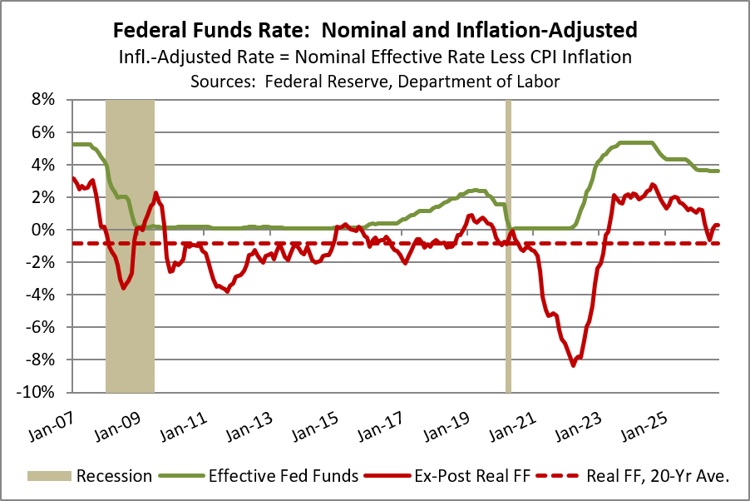
The chart above shows the Federal Reserve’s benchmark short-term interest rate in both nominal and real, inflation-adjusted terms, as well as the 20-year average of the real rate. For each month shown, the real rate is calculated as the nominal fed funds rate less the change in the consumer price index for the year ending that month. In simplistic terms, an investor could consider the real fed funds rate to be relatively high and restrictive to the economy when it is above its long-run average of -0.8%, whereas it could be considered low and accommodative when it is below average. As shown in the chart, the Fed’s attack on post-pandemic inflation lifted the real benchmark rate to its highest level since the Great Financial Crisis (GFC).
Following the pandemic, Fed policymakers were never able to get inflation back down to their target despite keeping real rates high for an extended period. They nevertheless let the real fed funds rate decline to a virtually neutral level in early 2026. This was probably one reason why investors began to sense that the central bank would be forced to start hiking the fed funds rate again, as it finally did in mid-September. As shown at the rightmost edge of the chart, the real fed funds rate is now rising again as the policymakers renew their commitment to lower inflation. The question is whether the real fed funds rate is now high enough to bring inflation down to target. Based on past inflation-righting episodes, we think it remains too low. Absent political pressure to keep rates low, we would therefore expect even more rate hikes.
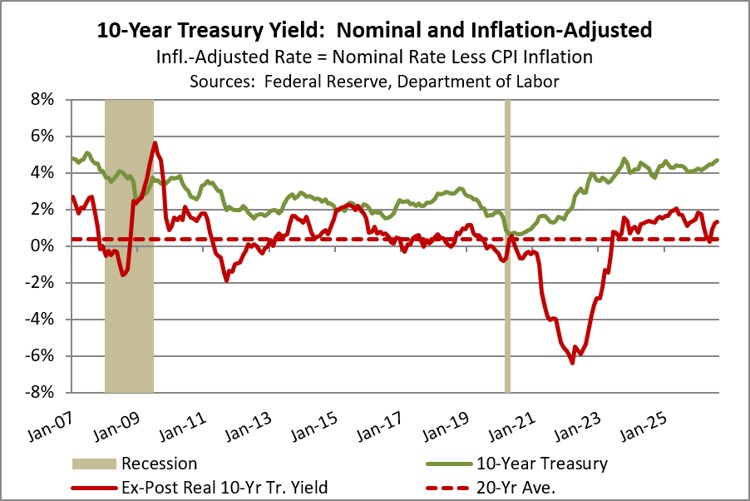
What about real, inflation-adjusted yields on longer-term debt instruments? The chart above shows the nominal and real yields on 10-year US Treasury obligations as well as the 20-year average real yield of 0.4%. Since 10-year Treasury yields serve as the benchmark for many other long-term debt instruments and investment projects, such as residential mortgage rates or stock purchases, high real yields can have significant impacts on overall demand in the economy and the financial markets. The chart shows that real 10-year yields in the post-pandemic inflation fight weren’t nearly as out of whack as the real fed funds rate. For example, they never went as far above 2.0% as they did before the GFC, which probably helps explain why economic growth remained too strong to bring down inflation. Nevertheless, after falling to their long-run average in early 2026, real 10-year yields are now rebounding quickly. We believe that real yields could continue to rise in response to factors such as fears of future energy prices, strong debt issuance by artificial intelligence firms, and worries about rising federal budget deficits and debt. If real 10-year Treasury yields move above roughly 2.0%, we suspect they could begin to weigh on economic activity and meaningfully slow the AI investment frenzy.
Don’t miss our accompanying podcasts, available on our website and most podcast platforms: Apple | Spotify
Confluence Mailbag – #12 “Rising Rates, Endless War, and Where to Play Defense” (Posted 10/1/26)
Bi-Weekly Geopolitical Podcast – #46 “The Changing Face of War” (Posted 4/22/24)
Bi-Weekly Geopolitical Report – The Changing Face of War (April 22, 2024)
by Daniel Ortwerth, CFA | PDF
If the United States were at war with another great power, would we know it? How would we know it? These questions might seem absurd but consider that the US has not fought a war against a major world power since 1945. Meanwhile, when the US has engaged in conflicts against weaker and regional powers since World War II, the beginnings and endings of the conflicts have tended to be blurred. Technology has advanced in ways unimaginable to the 1945 mind. This has changed the nature of life, and it has also changed the face of war. In this report, we consider how the contours of that face have changed over time, what it takes to recognize war in the 21st century, and whether the US and its allies might already be at war with China and its allies.
By addressing key elements of technological advancement and geopolitical evolution, we explore how 80 years have changed the face of war. We consider aspects of war that have not and never will change as well as what has changed, and we drive to the bottom line for investors. In our view, that bottom line has remained constant through time as war is expensive, citizens pay the price, and that price largely manifests itself in the form of higher inflation and long-term interest rates. Will the US ever go to war again with another major power in a way that we can recognize? Will we know it when we are there? These questions are harder to answer than ever before, but investors can still prepare.