

Tag: gold prices
Asset Allocation Bi-Weekly – Gold: An Update of Current Conditions (February 7, 2022)
by the Asset Allocation Committee | PDF
Gold moved steadily higher from the late summer of 2018 into August 2020. Prices then declined toward $1,700 and have since traced out a trading range between $1,700 and $1,900. In this report, we will update our views on the metal.
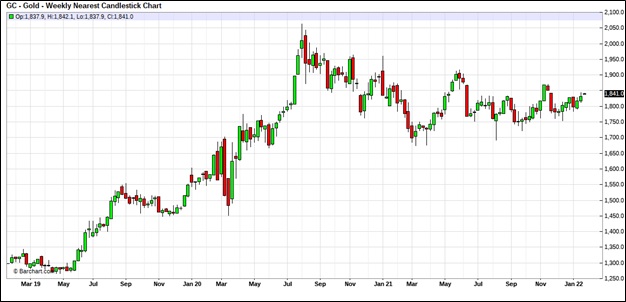 (Source: Barchart.com)
We have been holding gold in our asset allocation portfolios since 2018, although we have diversified our commodity holdings by adding a broader commodity ETF alongside our gold position.
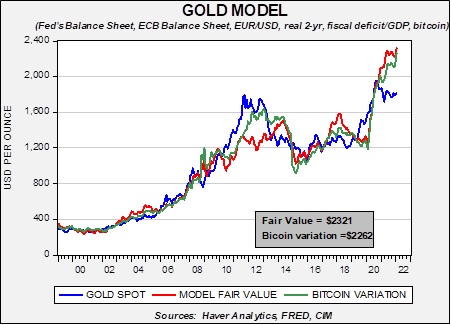
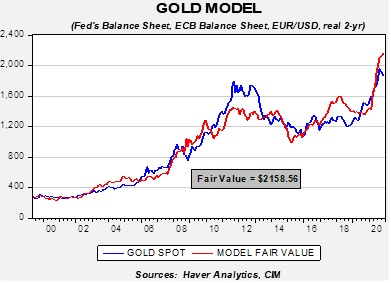
The long-term outlook for gold remains positive. Our basic gold model, which uses the balance sheets of the Federal Reserve and the European Central Bank, the EUR/USD exchange rate, the real two-year T-note yields, along with the U.S. fiscal deficit relative to GDP, suggests prices remain undervalued. To account for the impact of bitcoin, we have added a variation to our gold model to take the cryptocurrency into consideration. In both variations, gold remains undervalued.
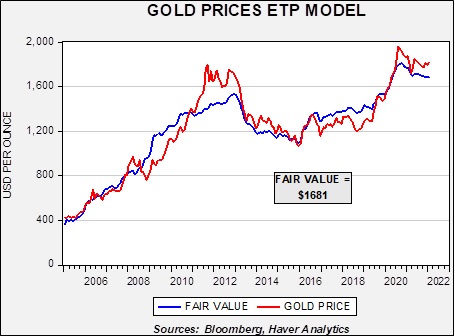
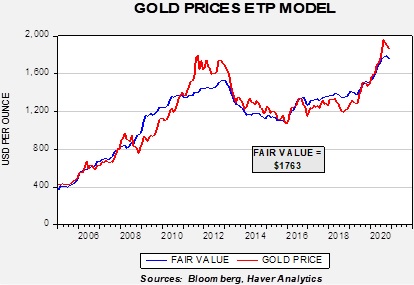
So, what is keeping gold undervalued? We believe it is mostly due to short-term factors. First, investor flows are not high enough to lift gold to our long-term models’ fair value. The chart on the left overlays the price of gold and the fair value based on flows to gold exchange-traded products. Flows suggest gold is actually overvalued. Why are investors shunning gold? Last year, it appeared crypto-currencies were siphoning off investor flows that traditionally would have gone to gold. But with cryptocurrencies falling in price, gold has not benefited, at least not yet. Most likely, fears of FOMC policy tightening are weighing on gold.
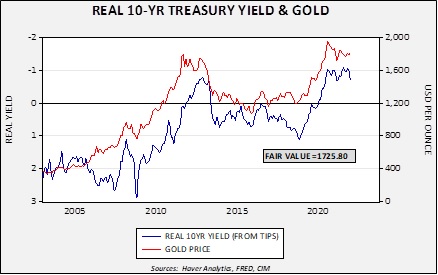
Second, real interest rates, measured by the TIPS spread, suggest gold is overvalued. Real 10-year yields have risen sharply recently, reducing the fair value of gold to $1,725.80.[1] So far, gold has not reacted to the rise in real yields, but it could pressure gold prices in the coming weeks.
In our most recent asset allocation rebalancing, we reduced our exposure to gold, using some of the allocation to increase our position in broader commodities. Concerns about short-term weakness in gold prices played a role in that decision. In addition, we expect some commodities, such as energy, to rally if a geopolitical event occurs in Europe or Asia. At the same time, we remain long-term gold bulls, and thus, we want to maintain an allocation to the metal.
[1] On the chart, the scaling for the real yield is inverted.
Asset Allocation Weekly – #40 (Posted 5/28/21)
Asset Allocation Weekly (December 18, 2020)
by Asset Allocation Committee | PDF
(N.B. Due to the upcoming holiday season, this report will be the last Asset Allocation Weekly for 2020. The next report will be published on January 8, 2021.)
While 2020 was a year in which the word “unprecedented” has been used a lot, there are many areas where the term is appropriate. One area of interest is in the growth of liquidity. The chart below is one we have featured often, showing retail money market fund levels (RMMK) and the S&P 500.
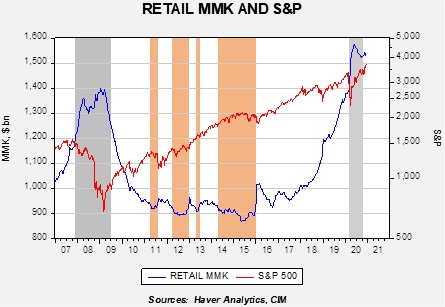
The gray bars show recessions, while the orange bars show periods where RMMK fell below $920 billion. Our position has been that when we are in the orange parts of the chart, there is a dearth of liquidity and equity markets tend to stall. On the other hand, periods of rapid RMMK accumulation have tended to be periods of equity weakness.
In 2018, as the trade war escalated, RMMK began to rise sharply. It continued to rise throughout 2019 into 2020. The pandemic led to another leg higher in RMMK. The level of RMMK has fallen from the highs set earlier in the year but it remains elevated. As noted above, when RMMK rises sharply, equities tend to suffer. We did see some evidence of that in 2018, but last year equities continued to trend higher despite the rise in RMMK. Pandemic worries and a brewing financial crisis led to a sharp selloff in the S&P 500, but the market turned as policymakers moved quickly to support the economy.
It is clear that the level of RMMK is high, but the difficulty is determining “how high.” For that, analysts usually try to scale the data to make it comparable across periods. A logical scale variable may be in comparing the level of RMMK to household financial assets. The problem with that variable is that it is very sensitive to the level of equities; in other works, cash levels seem to rise coincident with a fall in equity values. Most of the decline occurs due to the fall in equity values, not to cash accumulation. The other problem with scaling is finding the answer to the question at hand. What we want to know is if RMMK levels fall, will the funds go to stocks or elsewhere? We assume that RMMK is the closest asset to equities of fixed income; in other words, demand or savings deposits probably represent the desire to hold cash, whereas RMMK is where liquidated financial assets go before they are placed elsewhere.
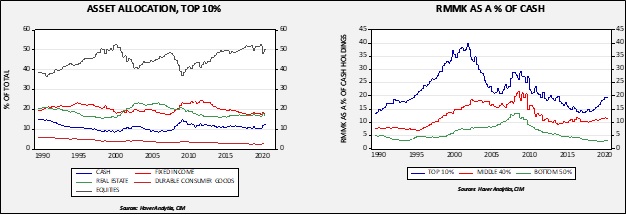
The chart on the left shows the asset allocation of the top 10% of households. Note that about 50% of this income group’s assets are in equities. That is far larger than the middle income group (89% to 51%), which holds 25% in equities, and the bottom 50%, which has equity holdings of 10%. The chart on the right shows that the RMMK holdings for the top 10% group rose from 15% to near 20% from 2018 to 2020, coinciding with the rise in RMMK shown in the first chart.
These charts suggest that most of the RMMK accumulation occurred in an income group most inclined to buy equities. Accordingly, the elevated level of RMMK should be supportive for equities. At the same time, in 2008, RMMK held by the top 10% reached nearly 30%. Thus, we may not see as large of a recovery as we saw during 2009-11. Still, there does appear to be ample liquidity available for stocks, and given the low level of interest rates, flows should continue to be supportive for equities.
Asset Allocation Weekly – #21 (Posted 12/11/20)
Asset Allocation Weekly (December 11, 2020)
by Asset Allocation Committee | PDF
After peaking at $2,063 in early August, gold prices fell to $1,760 at the end of November. This is a notable decline and, because our asset allocation models have included precious metals since 2018, it makes sense to see if anything has changed. We have several different ways to examine the price of gold. In general, the outlook is mixed; the underlying fundamentals remain solid, but competition for investment flows is putting a damper on gold prices.
Based on our gold model, prices are attractive at current levels. The model uses real two-year Treasury yields, the EUR/USD exchange rate, the balance sheets of the Federal Reserve and the European Central Bank, and the U.S. fiscal account scaled to GDP. As the chart suggests, current prices are below the model’s forecast.
At the same time, a model based on the amount of gold held by exchange-traded products (ETPs) suggests gold isn’t attracting investment flows relative to its fundamental attractiveness.
Although optimism surrounding equities is likely diverting funds that may have gone into gold, the price action in bitcoin may also be having an impact. Bitcoin remains a controversial topic; its value appears to be ephemeral (in theory, one can create scarcity of anything, but it has little value without demand for it). Its initial construction suggested it was a digital currency designed for transactions. It has mostly failed in that endeavor, at least for legal transactions, but it has shown to have store-of-value characteristics. As such, it has similar characteristics to gold without the same issues of storage.[1] Recently, we have seen a sharp rise in bitcoin prices, which may be siphoning off demand that would usually go to gold.
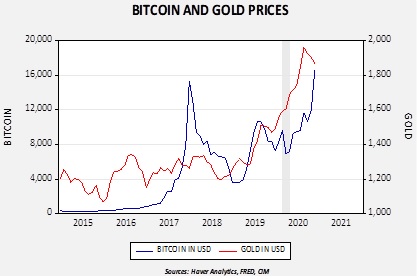
Since late 2014, gold and bitcoin prices are positively correlated at the 70.9% level. In 2017, we saw a spike in bitcoin that collapsed. The key question is whether we are seeing a repeat in the current situation or something different. It is difficult to tell, but the most likely situation is that bitcoin isn’t replacing gold but is a complement. Currently, bitcoin appears a bit expensive compared to gold (a simple model suggests bitcoin should be closer to 12,000), but it had been running below gold for most of this year. Thus, we view the recent rally as more corrective in nature, although the recent spike suggests bitcoin is now excessively valued. Another item of note is that when we had a financial crisis in February into late March, bitcoin plunged while gold maintained its value. The financial system was in a perilous position in late Q1 and bitcoin was not the safety asset of choice when there were high levels of fear. At the same time, we cannot discount the attractiveness of bitcoin and, if investable products are eventually created, it may have a place in portfolios.
Overall, we remain bullish on gold. The underlying fundamentals, as shown in our base model, are very attractive and suggest current prices are undervalued. We do think bitcoin has taken some of the luster from gold, but in the long run we believe the two assets are complementary. With monetary and fiscal policy remaining expansive, the case for commodities, in general, and gold, in particular, is favorable.
[1] Both assets require storage, but one is quite physical whereas the other has, in theory, unlimited storage capacity. For example, if one is trying to live in a failing state, gold may have little value due to its weight but a cryptocurrency that can be easily transferred is attractive.