Asset Allocation Weekly (September 28, 2018)

by Asset Allocation Committee

Since late August, interest rates have been steadily rising.  The 10-year T-note yield made its recent low at 2.82%[1] on August 4th.  Since then, yields have moved above 3.00%.

Our 10-year T-note model suggests rates are a bit elevated.

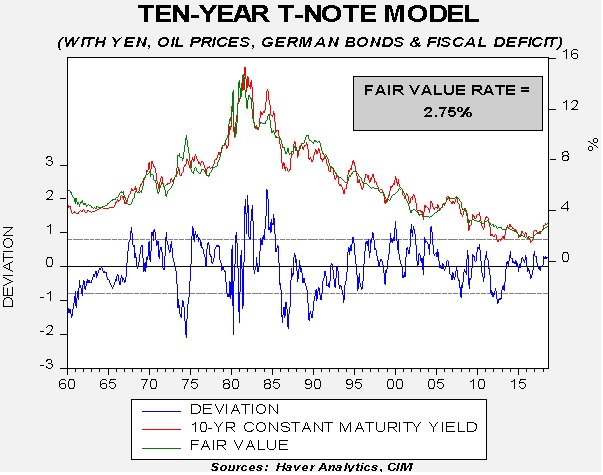
This model includes fed funds and the 15-year moving average of inflation (a proxy for inflation expectations) as the core variables.  These two variables explain more than 90% of the variation in the interest rate on this T-note.  The additional variables, the yen, oil prices, German bund yields and the fiscal deficit, are all statistically significant but have much less explanatory power than the core variables.  Based on the core variables alone, the fair value yield is 3.45%.  The weak yen and low German rates (currently around 42 bps) are mostly responsible for the lower fair value reading in the full model.

In the short to intermediate term,[2] the two variables we are watching most closely are fed funds and German yields.  Fed funds expectations have been increasing due to robust economic growth and expectations that the FOMC will contain any potential inflation threat.

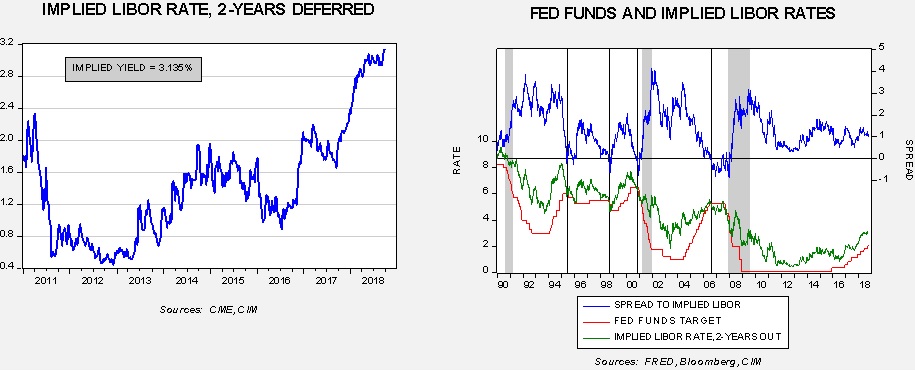
The chart on the left shows the implied three-month LIBOR rate two years into the future.  It has recently ticked higher to 3.135%.  The chart on the right shows that FOMC policymakers tend to use this rate as a policy target.[3]  In a tightening cycle, the FOMC tends to raise rates until fed funds reach the aforementioned implied LIBOR rate.  The vertical lines on the right chart show when inversion occurs.  Policy tightening usually stops at that point.  Given the current implied rate, this would lead to a terminal fed funds target of 3.25%.

If we assume a 3.25% rate and no other changes, the fair value for the 10-year yield rises to 3.28%.  Thus, it is reasonable to assume that much of the rise in yields over the past month has been due to the market preparing for future rate hikes.  The low level of German yields is also a concern but even taking bunds to 1.00% only raises the fair value yield to 3.40% (assuming a fed funds rate of 3.25%).

The long-run concern is inflation expectations.  A modest rise to 3.00% (from the current 2.10%) and a 3.25% fed funds rate would take the fair value yield to 3.86%.  Major bear markets in long-duration assets are mostly a function of unanchored inflation expectations.   Although the Federal Reserve has limited capabilities to restrain actual inflation (inflation control is mostly a function of the supply side of the economy), central banks are critical to managing inflation expectations.  If investors, households and firms conclude that the central bank won’t raise rates in the face of rising inflation, their behavior will likely change to adapt to steadily rising prices.  Alan Greenspan’s definition of inflation control is when economic actors no longer take inflation into account when making consumption and investment decisions.  If inflation fears emerge, these actors will tend to increase inventories, rush to purchase before prices rise and set the stage for a price spiral.  The control of inflation expectations is one of the reasons modern central banks are given policy independence.  Anything that infringes on this independence runs the risk of un-anchoring inflation expectations.  To date that hasn’t occurred but the rise of populism increases the odds that central banks will lose their independence, which increases the risk of higher long-duration yields.

View the PDF


[1] Using the constant maturity T-note yield.  See: https://fred.stlouisfed.org/series/DGS10

[2] Three months to two years

[3] We don’t know for sure if this is overt or coincidental, although we suspect the latter.

Weekly Geopolitical Report – The Venezuelan Migration Crisis: Part II (September 24, 2018)

by Bill O’Grady

Last week, we discussed Venezuela’s economic and political situations.  Part II begins with a discussion on migration with a focus on emigrant flows.  We include an analysis of the problems caused by migration followed by an examination of the possible end to this crisis and the broader geopolitical issues.  As always, we will conclude with potential market ramifications.

The Migration
The total number of Venezuelans that live abroad is estimated to be between 4.0 and 4.5 million,[1] roughly 13.5% of the country’s total population, suggesting that Venezuela has seen steady outflows due to the turmoil that Chavez’s revolution brought to the economy and political system.  Since 2015, the International Organization for Migration estimates that 2.3 million Venezuelans have migrated, representing about 7% of the population.  Surveys suggest that 54% of remaining upper income Venezuelans want to leave, while 43% of lower income citizens have the same goal.

View the full report


[1] https://d2071andvip0wj.cloudfront.net/065-containing-the-shock-waves-from-venezuela.pdf, International Crisis Group, page 9.

Asset Allocation Weekly (September 21, 2018)

by Asset Allocation Committee

In this week’s report, we will focus on the U.S. economy.  Since the 1987 crash every major equity market decline has coincided with a recession.  Thus, we pay close attention to the economy with the goal of projecting the next recession.

This expansion, which began in June 2009, is now the second longest in U.S. history.[1]

(Source: NBER, CIM)

If the expansion makes it another eight months, it will tie the longest expansion, which ended with the 2001 recession.  Business cycles have been lengthening in recent years.

Since the Great Depression, expansions have been lengthening.  Moving off the gold standard has allowed for discretionary monetary policy which has tended to support longer expansions.  However, the most important factor that has supported longer business cycles in the past forty years has been falling inflation.  As inflation declines, the Federal Reserve has less need to aggressively tighten credit which supports economic expansion.

This chart measures real fed funds (effective fed funds less yearly CPI).  Note that since the early 1980s, each cycle has had a lower average real rate over the term of the recovery.  Much of this is because the Federal Reserve has successfully lowered inflation expectations.  With lowered expectations of inflation, the U.S. central bank can keep rates lower for longer without triggering overheating.  The ability to keep rates low has allowed for longer business expansions.

The current economy is doing quite well.

This chart shows the Chicago FRB National Activity Index, a broad-based index of economic indicators which are structured against trend.  When the reading is above zero, the economy is growing above trend and vice versa.  We smooth the data with a six-month moving average.  Overall, the economy is running well above trend.

The most interesting issue with the economy is potential growth.

This chart looks at the long-term pattern of real GDP; we have put the data on a log scale and regressed it against a time trend.  The deviation line on the lower part of the graph shows the deviation from the long-term trend.  We have only seen two periods of well below-trend growth, during the Great Depression and the current environment.  It is unknown whether or not the long-term trend still represents potential output.  If it does, not only will the economy easily absorb the stimulus without triggering inflation but the FOMC should be very careful about tightening monetary policy.  Note the dip in the deviation chart in 1937; that was due to premature fiscal and monetary tightening that led to a short but deep recession.  We tend to think there is more slack in the economy than generally thought.  Although the odds are rising that the FOMC will overtighten monetary policy, given the current path of policy, we probably won’t reach the point of concern until the middle of next year.

View the PDF


[1] The National Bureau of Economic Research is the arbiter of business cycles.  It began tracking business cycles in 1854.

Weekly Geopolitical Report – The Venezuelan Migration Crisis: Part I (September 17, 2018)

by Bill O’Grady

Venezuela has gone from “bad to worse” in recent years.  In 1999, Hugo Chavez was elected president and took the country on a journey into Cuba-style socialism.  Persistent government intrusion into the economy reduced private sector involvement.  Although the oil sector was able to generate enough revenue to allow Chavez to fund his socialist programs (and provide oil to allies at reduced prices), the lack of investment and falling oil prices put the economy in dire straits.  After Chavez died in 2013, Nicolas Maduro has been the nation’s chief executive.  He has presided over an accelerating political and economic disaster.

Maduro’s mismanagement has led to a migration crisis.  Millions of Venezuelans have already fled and surveys suggest many more are considering that alternative.  The massive outflow of people is causing severe strain on Venezuela’s neighbors and could eventually become a problem for Mexico and the U.S.  In Part I of this report, we review Venezuela’s economic and political situation.  Part II will begin with a discussion on migration with a focus on emigrant flows.  We will include an analysis of the problems caused by migration, followed by an examination of the possible end to this crisis and the broader geopolitical issues.  As always, we will conclude with potential market ramifications.

View the full report

Asset Allocation Weekly (September 14, 2018)

by Asset Allocation Committee

Emerging markets have fallen in recent weeks.  The decline is being driven by a couple of factors.  First, the dollar has appreciated due to concerns that tariffs will restrict foreign country access to the U.S. consumer and the dollars they spend.  In other words, if the U.S. restricts trade, countries will struggle to acquire dollars for reserve and trade purposes.  As we will show below, there is a clear inverse correlation between the dollar and relative emerging market equity performance.  Second, and related to the first point, restricting access to dollars coupled with tightening monetary policy has led to crises in nations with high levels of foreign debt; namely, this has been the case in Argentina and Turkey, although we are seeing weakness spread to other nations as well, including South Africa.

The arguments for owning emerging markets from a macro perspective are based on expectations of dollar weakness and a Fed that doesn’t overtighten monetary policy.  First, a look at relative performance.

This chart regresses the emerging market index against the U.S. index, log scaled.  When the deviation line is above zero, emerging markets are outperforming.  Below zero, the U.S. is outperforming.  There is an obvious broad cycle in the deviation line.

There are two variables that generally explain the divergence, the dollar and fed funds.

The chart on the left shows the dollar and relative performance.  In general, a weaker dollar tends to support emerging market performance.  A stronger dollar increases the risk for emerging markets that borrow in dollars as it increases debt service costs.  And, many emerging market economies are commodity producers and a stronger dollar tends to pressure commodity prices.  The dollar peaked in early 2017 and appeared to be rolling over.  As we have discussed before,[1] on a relative inflation basis, the dollar is overvalued.  However, in late Q1, President Trump began discussing tariffs and trade barriers.  The potential for trade restrictions is bullish for the dollar; the problem is that there is nothing in the historical record since WWII that would suggest how bullish barriers might become.  In addition, it isn’t completely clear what the end point of tariffs will be.  However, if the president is successful in narrowing the trade deficit, it would be dollar supportive.

The second chart shows the impact of monetary policy on relative performance.  Although the fit isn’t as strong as the dollar, there have been policy cycles where rate cuts boosted emerging market outperformance.  Thus, Fed tightening would tend to favor the U.S. over emerging markets.  Our analysis suggests the FOMC will raise rates to around 3%, which would not be unusually tight based on historical ranges.  Thus, we believe this level is already discounted in the market.

So, do emerging markets look attractive?  If the dollar rolls over, emerging markets should do better.  What would make the dollar weaken?  Anything that suggests the drive for trade protection is being mitigated, either by political turmoil or Congressional action, would likely pressure an already extended greenback.  We tend to rely on parity extremes to forecast our dollar outlook and, as noted, we are at levels that should support dollar-bearish positions.  At the same time, we will have to assess our view on the government’s trade policy going forward.  Trade protection will tend to support a stronger dollar and lead to further weakness in emerging markets.

View the PDF


[1] See Asset Allocation Weekly, 2/2/2018

Weekly Geopolitical Report – The Battle for Idlib (September 10, 2018)

by Bill O’Grady

Two years ago, it looked as if Syrian President Bashar Assad was either about to be ousted from power or doomed to control an ever-shrinking area of Syria.  Islamic State, Kurds and various rebel groups controlled much of what once constituted Syria.  In fact, the frontier between Syria and Iraq was mostly a fiction as neither state controlled its borders.

However, in 2015, Russian President Vladimir Putin decided to support his long-time ally and provide military support to prevent him from falling from power and assist him in retaking lost territory.  With Russian and Iranian assistance, Assad has been steadily winning back territory that was held by various rebel groups.  Although the U.S. could have been an obstacle to this trend, America’s focus was on defeating Islamic State.  Therefore, the U.S. has mostly not interfered in Assad’s recovery.

After gaining back several pockets of resistance in the southwestern part of Syria, the focus now shifts to Idlib, a province in northwestern Syria that borders Turkey.  Unlike the areas recently re-taken, Idlib’s situation is much more complicated.  There are several rebel groups in Idlib, a large number of displaced people and five nations with interests in the province.  As a result, the potential is elevated that the operations designed to oust rebel groups will turn into a much broader conflict.

In this report, we will begin with a description of Idlib.  The following section will examine the goals and concerns of the major players, including rebel groups, important ethnic and religious groups and the aforementioned nation states.  Using this information, we will discuss the potential interplay among these groups and their efforts to contain the battle and what could lead it to spin out of control.  As always, we will conclude with potential market ramifications.

View the full report

Quarterly Energy Comment (September 7, 2018)

by Bill O’Grady

The Market
Since mid-Q1, oil prices have ranged from a low of around $64 to a high of $71 per barrel.

(Source: Barchart.com)

Prices remain elevated, supported by OPEC production discipline, production problems in several OPEC nations, fears of new Iran sanctions and stable global oil demand.

Prices and Inventories
Inventory levels remain elevated but have clearly declined from last year’s peak.

From the late 1970s into mid-2014, U.S. commercial crude oil inventories ranged between 275 mb and 400 mb.  However, from mid-2014 into 2017, rising U.S. production led to a major increase in stockpiles.

View the complete PDF

Asset Allocation Weekly (September 7, 2018)

by Asset Allocation Committee

Traditionally, the election season kicks off with Labor Day so, with last Monday’s holiday, the election cycle is upon us.  The midterm election year tends to be lackluster for equities until Q4, when a strong rally usually develops.

The data for this chart is developed by taking the weekly closes for the S&P 500, beginning with the first Friday close in 1928.  We index the data over the next four years and then average each week across each four-year cycle.  Thus, this graph represents 22 cycles.  The election occurs around week 48 in the election year.  On average, the euphoria surrounding the election lasts until week 80 (into the summer of the year after the election) when equities become range-bound.  Some of this pattern is probably due to the inevitable disappointment that a new administration can’t implement all the changes it promised.  By the midterm year (third full year), equities test the low end of the range into October then begin a multi-month rally that persists into the middle of the year after the midterms.  Another range-bound pattern develops into the election year.

The following chart shows how the current administration compares to the average.

Clearly, the Trump administration has been popular with investors, especially during the first full year after the election.  The tax cuts boosted equity prices into Q1 of this year.  However, concerns about trade, tightening monetary policy and worries about the midterms have all likely conspired to bring a period of consolidation.  Equities have improved recently, making new highs.  The range-bound pattern that has emerged this year is consistent with the average election cycle pattern, albeit from a higher level.

The key question is whether we will see the typical midterm rally in Q4 through next summer.  As we discussed last week, although there are worries about political turmoil in the wake of a potential change in power in Congress, the political situation, by itself, probably won’t derail the bull market.  The primary threat to the bull market is recession and the most likely culprit would be overly tight monetary policy.  Given the current pattern of tightening, we don’t expect that to be a problem until H2 2019.  Thus, the pattern will probably hold but, given the recent strength in equities, we would not necessarily expect the usual 20% rise seen after the midterms.  However, a more pedestrian rally of 5% to 10% would not be a surprise.  To conclude, we do expect a post-midterm rally, perhaps less vigorous than average but a stronger equity market nonetheless.

View the PDF

Asset Allocation Weekly (August 31, 2018)

by Asset Allocation Committee

In light of the recent conviction of Paul Manafort and the guilty pleas by Michael Cohen, along with the upcoming midterm elections, we have been receiving questions about the political landscape going into winter.  In this report, we will discuss our baseline expectations for political trends and their potential effect on financial markets.

Our expectations:

We expect the Democrats to win the House in November but the GOP will hold the Senate.  Current prediction market wagers are the primary basis for this expectation.

(Source: PredictIt.com)

For the House, the prediction market has been consistently indicating a 65% likelihood that House control changes parties.  At the same time, the same group shows the likelihood that the GOP retains control of the Senate is above 70%.[1]

A divided legislature will lead to gridlock.  We expect a Democrat-controlled House to use its subpoena power to investigate any potential corruption in the Trump White House.  According to Axios,[2] there will be a plethora of potential areas to examine.  Because of this distraction, we doubt the White House will be able to muster any significant legislative achievements.  This outcome isn’t all that unusual.  Normally, the peak of a president’s power is in the first 18 months of his first term.  Any political capital that isn’t spent in this period is lost.  By summer of the second year in office, midterm elections are looming and Congress is distracted by the upcoming vote.  Often, the president’s party loses seats in Congress after the midterms and legislative progress grinds to a halt.  This usual pattern, coupled with the likelihood of perpetual investigations, probably means not much will get done.

Will the Democrats impeach President Trump?  Much of this will depend on what the House investigations unearth.  Although articles of impeachment might be approved, there is very little chance that two-thirds of the Senate would vote to remove Trump from office.

How will financial markets react to these baseline forecasts?

Equity markets: There have only been two impeachment events during modern market conditions, in the early 1970s under Nixon and the late 1990s under Clinton.  In the former event, equities declined but the Watergate scandal was probably nothing more than a minor contributing factor.  The economy was in a deep recession in 1973-74, and the world economy was reeling from the end of Bretton Woods and the Arab Oil Embargo.  Simply put, there was a lot going wrong and the Nixon resignation was only part of the overall turmoil.  In the latter case, equity markets were in the midst of the great tech bubble and mostly ignored the political news.

In general, equity markets will be sensitive to the business cycle and policy.  We don’t expect a recession over the next three to four quarters.  If the Fed overtightens, which will be an increasing risk next year, a recession is possible.  For now, we expect the FOMC to move slowly on rates and avoid a policy error.  In terms of fiscal and regulatory policy, the equity markets have already received support in the form of corporate tax cuts, additional spending and deregulation.  At the same time, we have seen some weakness develop on fears of a wider trade war.  If congressional investigations slow the trade conflict, we could see the bull market in equities not only continue but gain strength.

Debt markets: If trade impediments don’t increase and the Fed continues to raise rates, the odds of higher interest rates will increase.  Political turmoil may lead to some flight-to-safety buying for Treasuries, but credit spreads could widen as a result.  Overall, we could see the 10-year Treasury yield move toward 3.15% but would not expect it to move much above that level.

Currencies: The dollar is probably the most vulnerable of all the asset classes.  On a parity basis, the dollar is overvalued (our parity against the EUR is approximately $1.3050) and has been rallying mostly on trade worries.  If the U.S. puts up broad trade barriers, we would expect foreign nations to depreciate their currencies in order to offset the price increases triggered by the tariffs.  When President Trump appeared ready to apply trade restrictions globally, the dollar rallied.  However, the recent deal on NAFTA and the détente with the EU suggests that the administration’s real goal may be to contain China.  If so, the dollar could weaken; political turmoil might accelerate that trend.  A weaker dollar would tend to benefit international investments, U.S. large caps and commodities.

The political situation will not be the only factor affecting market behavior.  For equities, earnings and the overall economy will still be significant.  Political peace coupled with a recession would still be bearish for stocks.  The above discussion addresses the likely impact of the unfolding political situation.  The bottom line is that our position, for now, is that the current political situation, by itself, probably won’t be a major market-moving event.

View the PDF


[1] https://www.predictit.org/Market/2703/Which-party-will-control-the-Senate-after-2018-midterms

[2] https://www.axios.com/2018-midterm-elections-republicans-preparation-investigations-180abf7b-0de8-4670-ae8a-2e6da123c584.html