

Tag: OPEC
Asset Allocation Bi-Weekly – The UAE’s Exit From OPEC (June 1, 2026)
by Bill O’Grady | PDF
On May 1, the United Arab Emirates (UAE) formally exited both the Organization of the Petroleum Exporting Countries (OPEC) and the broader OPEC+ grouping of major oil producers. Such exits are not unheard of. For example, Indonesia suspended its membership in OPEC in 2015. However, Indonesia left the cartel not because it wanted to produce more oil, but because it had become a net oil importer. Qatar left the cartel in 2019, but there were several factors that led to its exit, including the fact that it had become more of a natural gas producer and Saudi Arabia and the UAE had isolated the country over its fostering of the news organization Al Jazeera.
Unlike Indonesia, the UAE has excess oil production capacity that represented about 25% of the cartel’s total. Like Qatar, tensions between Saudi Arabia and the UAE are elevated. The two countries have supported opposing sides in Yemen, for example.
In the immediate term, the UAE’s decision won’t affect the oil markets significantly. That’s because the Strait of Hormuz remains mostly closed. Although the UAE does have a pipeline to the Gulf of Oman, bypassing the strait, it is currently already fully utilized. Thus, the UAE can’t increase its oil output or exports until the US-Israeli war against Iran comes to some sort of resolution. But once that occurs, there will likely be a market impact.
Just what sort and how much of an impact is the focus of this report. To understand why the UAE’s action is important, it’s worth examining the role of cartels in the oil market. Oil supply has a tendency to be “lumpy.” On occasion, large oil fields are discovered and developed. Once these fields begin producing, supply usually increases dramatically. Oil demand is price inelastic, which means that in the short run demand doesn’t immediately react to the increase in supply. A glut of oil occurs, which brings sharply lower prices. Usually, suppliers react to the drop in price by reducing output. However, oil fields have limited flexibility in boosting or cutting output as oftentimes it can be very costly to reopen a well once it has been shut in. Oil is also unique compared to other commodities in that there is an incentive to continue producing once a well is operational because, if a producer were to stop, there would be nothing to prevent other drillers from pulling oil from the same field.[1]
This situation can lead to collapsing prices. When the East Texas Oil Field was discovered during the Great Depression, production soared and caused prices to fall from $1.10 per barrel to $0.15 per barrel. Not only can such a glut be ruinous for producers, but the rush to generate cash flow can lead to overproduction and damaged reservoirs. In this example, the Texas Railroad Commission, which had authority to regulate oil production in the state, used the state militia to enforce production shares. The commission became the de facto cartel manager of the oil market, holding production off the market to keep the price higher than a free market would have generated, while also helping to stabilize prices. The Texas Railroad Commission held this role until 1972, when US consumption matched the state’s production capacity. From this point forward, OPEC became the cartel that manages the oil price.
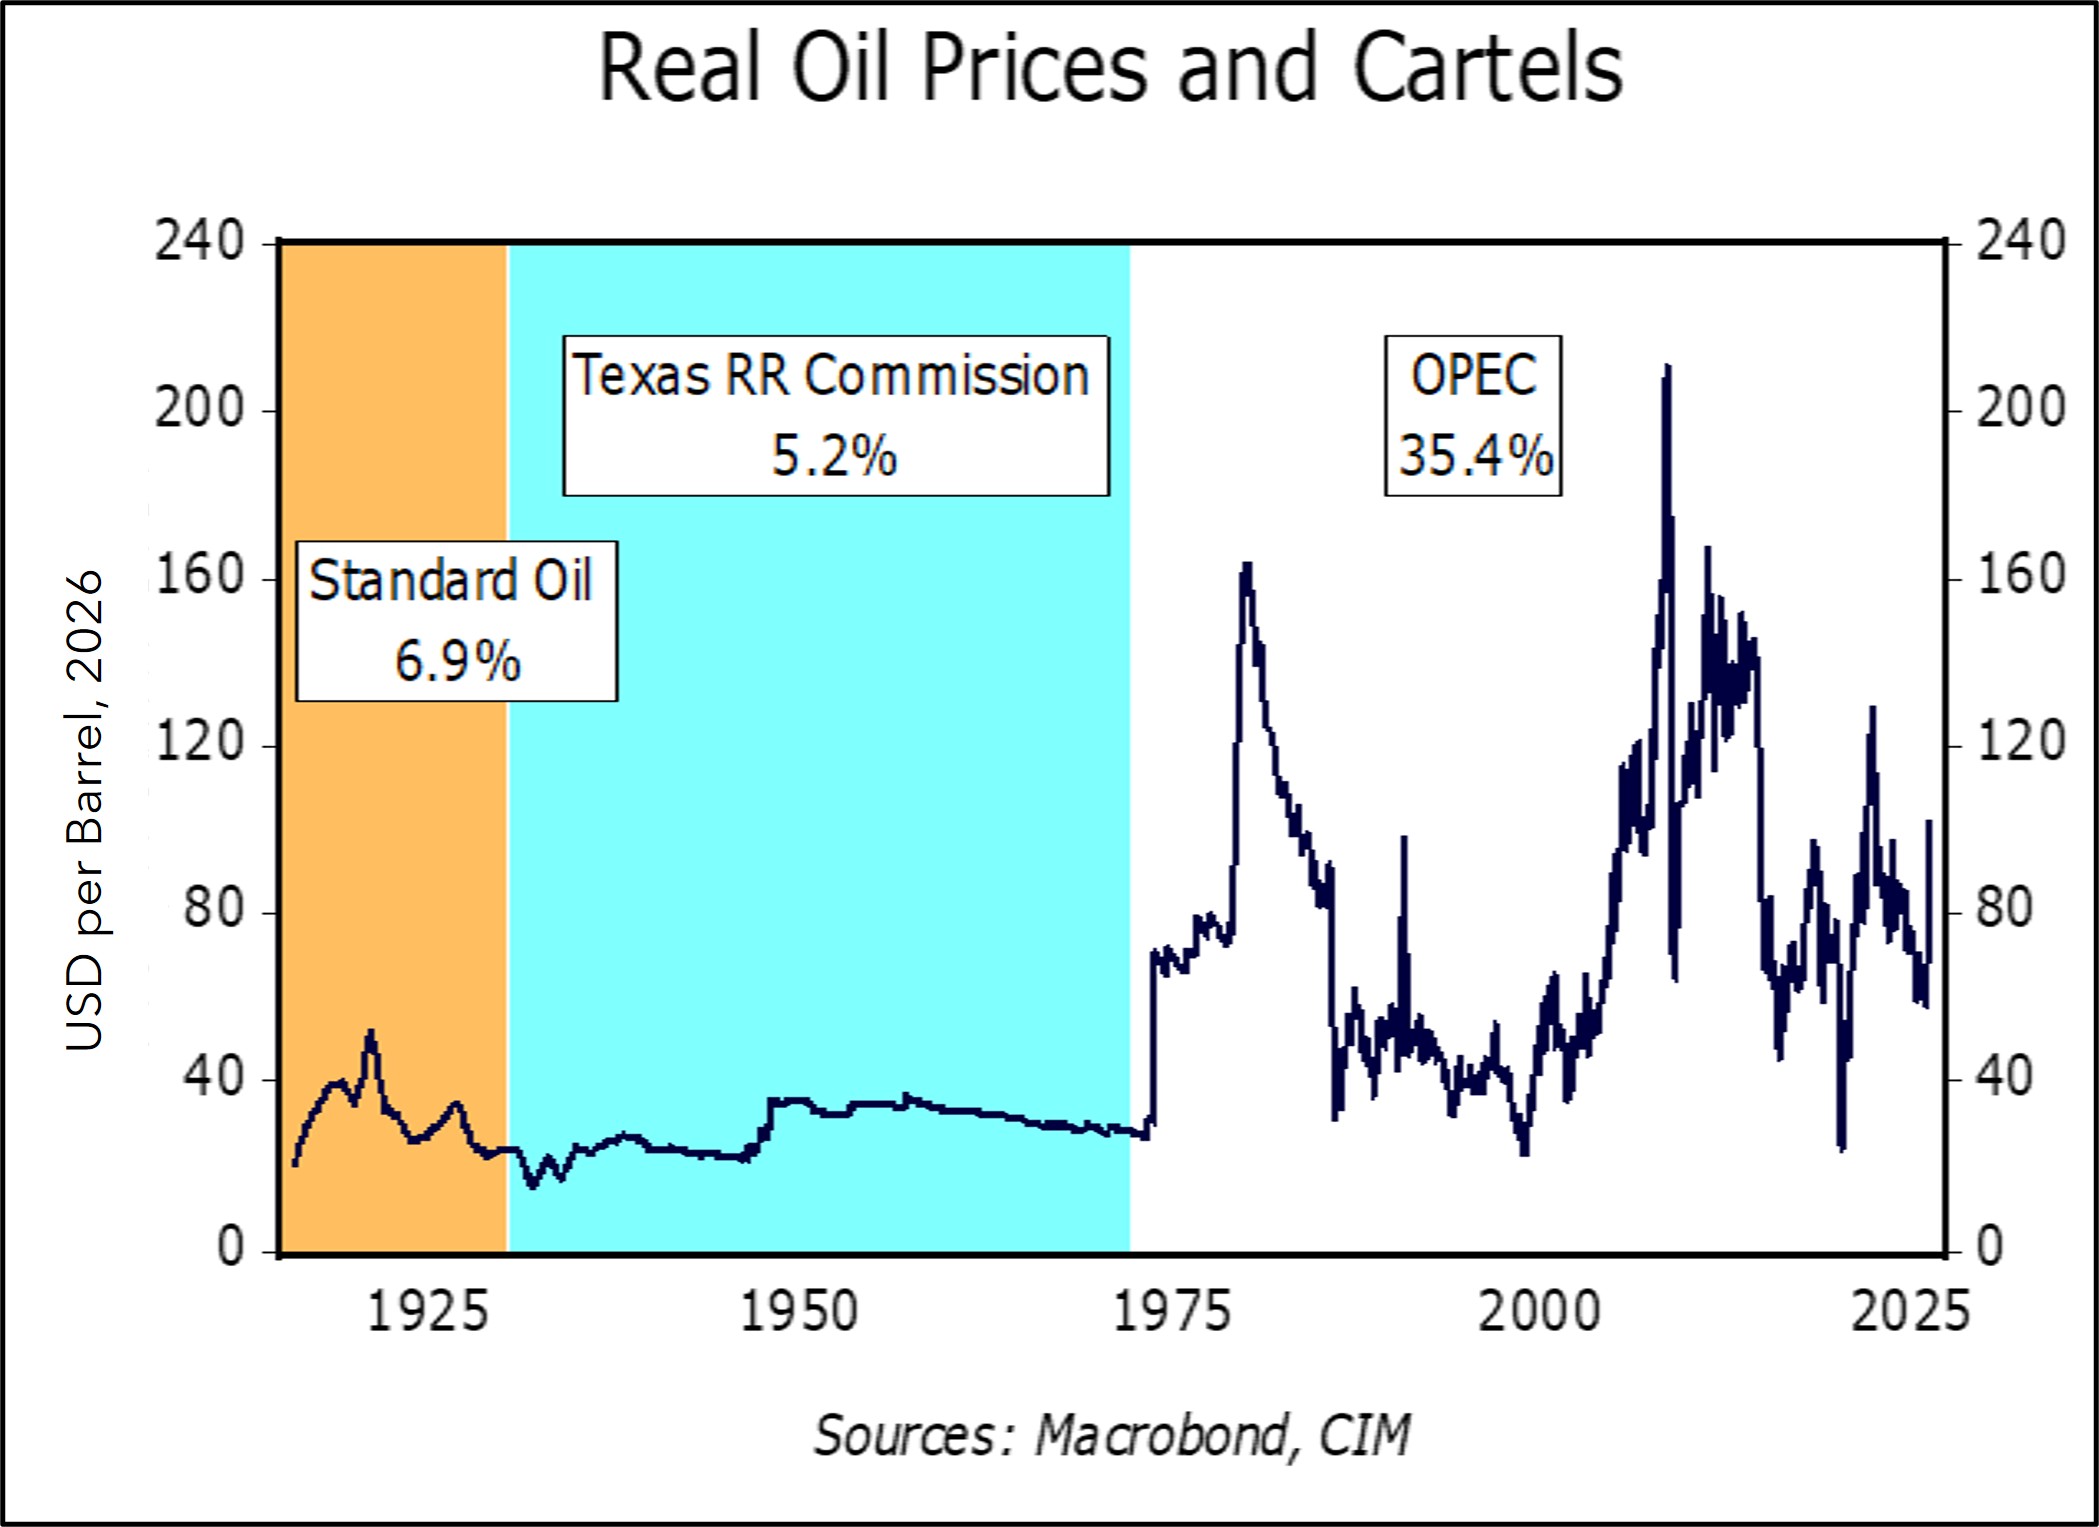
The chart above shows the inflation-adjusted price of West Texas Intermediate oil, deflated by the US consumer price index. Although Standard Oil was formally broken up in 1911, its successor companies mostly managed production. From 1915 until 1930, the standard deviation of oil prices was 6.9%. The Texas Railroad Commission era shows a standard deviation of 5.2%. Clearly, OPEC has been the least successful cartel in terms of price management, with a standard deviation of 35.4%. But, as the chart shows, it has been successful at managing prices at times. For example, from 1986 through 1999, the standard deviation was 10.0%, even during the Gulf War.
Nevertheless, OPEC has struggled to manage prices in this century, with a standard deviation of 24.2%. First, it was unable to contain prices during China’s emergence after joining the WTO in 2001. It also struggled to manage the market following the advent of US shale oil.
The decision by the UAE to leave the cartel will likely further complicate price management. As we noted above, the decision doesn’t matter much while the Strait of Hormuz is blocked. However, once it reopens and supply chains are restored, the UAE’s production will be a bearish factor for oil prices. We expect Saudi Arabia will attempt to maintain price stability for a time, given the country’s history of cutting its output to preserve higher prices. But, as we saw in 1985 and again in 1999, the kingdom eventually decided that it was tired of providing support for “free riders” and punished overproduction by flooding the market with oil, and we would anticipate a similar outcome here. We don’t know when this moment will occur, but traders will have to factor this possibility into prices.
Complicating matters further is the closure of the Strait of Hormuz. Oil consumers now know that this region of the world is an unreliable supplier and will undoubtedly take steps to diversify energy sources moving forward. China’s ability to manage through an “all of the above” strategy will likely support alternative energy sources, such as coal, wind, solar, nuclear, et al. The uncertainty of oil supplies tends to depress demand over time. Therefore, even before the UAE’s decision, oil prices would have eventually had to decline enough to offset the uncertainty surrounding future supply. A smaller OPEC cartel will increase the likelihood of lower prices…eventually.
[1] As highlighted in the “milkshake” scene in the movie There Will Be Blood (1:34).
Don’t miss our accompanying podcasts, available on our website and most podcast platforms: Apple | Spotify
Asset Allocation Bi-Weekly – #113 “U.S Oil Production at a Record High” (Posted 2/5/24)
Quarterly Energy Comment (December 17, 2019)
by Bill O’Grady
The Oil Market
Since June, oil prices have held mostly within a range of $50 to $60 per barrel.
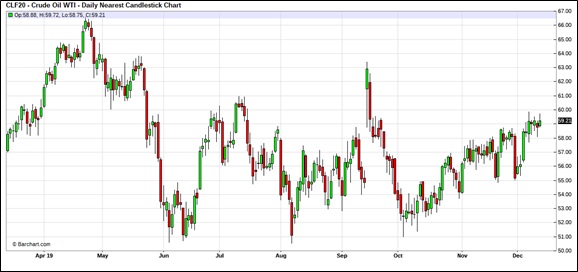
After a sharp decline in prices from late May into early June, due in part to a contra-seasonal build in inventories, inventories fell and oil prices rebounded. Rising tensions with Iran added to the lift in prices in September. Since then, we have seen a retest of the lower end of the range and a steady recovery. Soon after year-end, we usually see a seasonal rise in inventories, which tends to weigh on prices. However, with the advent of exports, that seasonal pattern has become suspect. For example, last year we didn’t see the usual increase in stockpiles.
Thoughts on Oil Demand
In general, forecasting demand is not usually a priority in commodity analysis. The shape of most short-run commodity demand curves is inelastic, which means that quantity isn’t very sensitive to price. Demand inelasticity means that a small change in supply can have outsized effects on price. It is because of that structure that commodity analysts tend to focus on supply. That being said, demand is important over the long term. For example, the effect of environmental regulations and consumer sentiment has adversely affected coal demand and severely depressed prices. The price of coal didn’t fall because supply expanded; it fell because demand declined.
Quarterly Energy Comment (August 27, 2019)
by Bill O’Grady
The Oil Market
Since June, oil prices have held within a range of $50 to $60 per barrel.
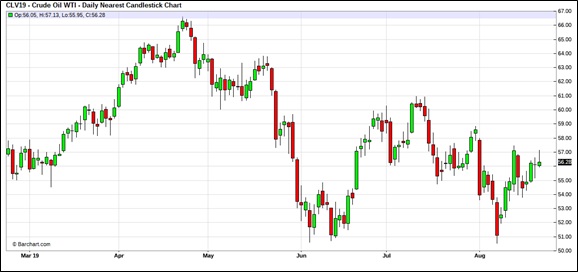
After a sharp decline in prices from late May into early June, due in part to a contra-seasonal build in inventories, inventories fell and oil prices rebounded. Rising tensions with Iran added to the lift in prices. Since then, we have seen a retest of the lower end of the range and another bounce. Unfortunately, we are heading into a weak demand period for crude oil as the summer vacation season comes to a close. Therefore, the lower support level may get tested again.
A Tale of Two Variables
Although there are several variables that affect the price of oil, within the business cycle the two we focus on are the dollar and commercial crude oil inventories. As with many situations, there are data accommodations that are necessary. Oil inventories can be problematic because, throughout history, the correlation between stockpiles and prices can flip.
Quarterly Energy Comment (March 21, 2019)
by Bill O’Grady
The Market
Oil prices have been volatile over the past few months.
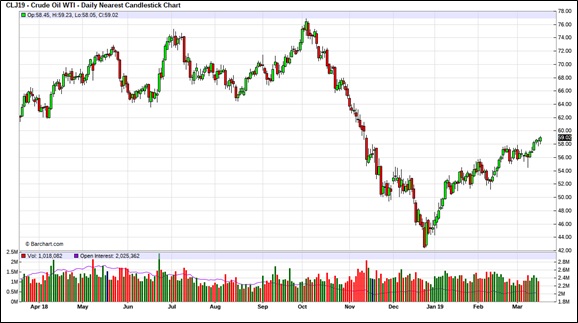
In October, OPEC producers increased output in anticipation of U.S. sanctions on Iran. However, the Trump administration granted more waivers for Iranian exports than anticipated, leading to more oil supply. As the above chart shows, prices plunged, falling from $78 per barrel to near $42 per barrel. OPEC + Russia have since taken barrels off the market in a bid to boost prices. Thus far, they have had some success in this effort but, clearly, we have not seen a full recovery in prices.
Prices and Inventories
Inventory levels remain below their 2017 peak but are still above what we would consider normal levels, below 400 mb. Oil inventories rose sharply in 2015 as U.S. output rose due to shale production. Unfortunately, the U.S. had regulations in place that limited oil exports to Canada and Mexico. As these regulations were lifted, allowing for expanded oil exports, stockpiles have declined.
Quarterly Energy Comment (September 7, 2018)
by Bill O’Grady
The Market
Since mid-Q1, oil prices have ranged from a low of around $64 to a high of $71 per barrel.
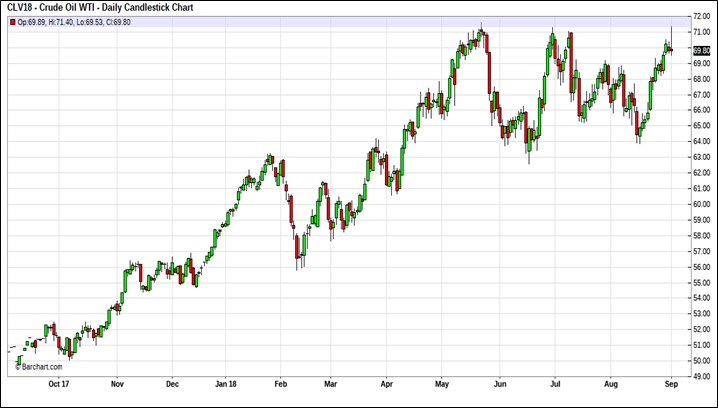
Prices remain elevated, supported by OPEC production discipline, production problems in several OPEC nations, fears of new Iran sanctions and stable global oil demand.
Prices and Inventories
Inventory levels remain elevated but have clearly declined from last year’s peak.
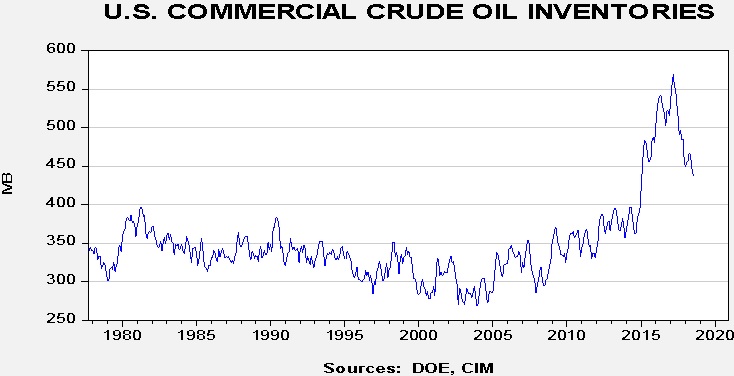
From the late 1970s into mid-2014, U.S. commercial crude oil inventories ranged between 275 mb and 400 mb. However, from mid-2014 into 2017, rising U.S. production led to a major increase in stockpiles.
Quarterly Energy Comment (March 13, 2018)
by Bill O’Grady
The Market
Over the past quarter, oil prices have ranged from a low of around $56 to a high of $66 per barrel.
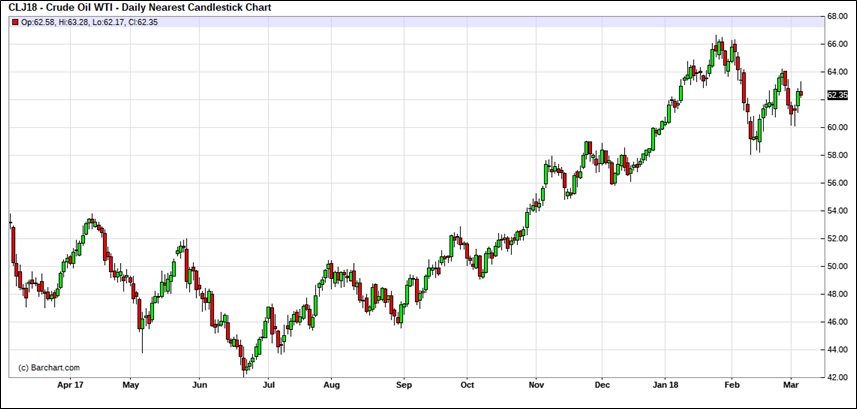
Prices remain elevated, supported by OPEC production discipline and solid global oil demand.
Prices and Inventories
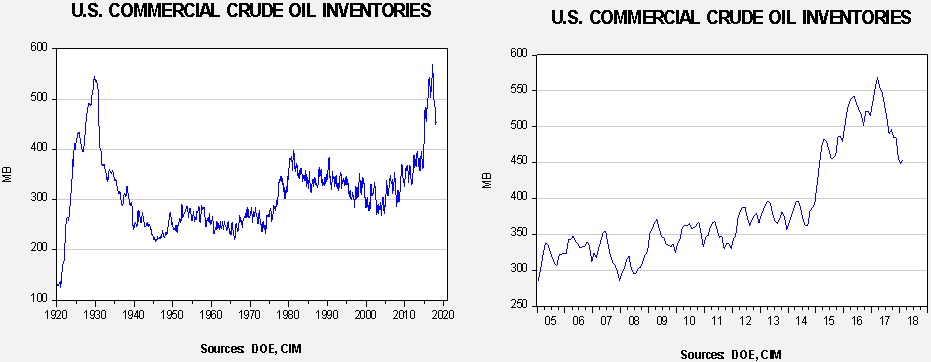
Inventory levels remain elevated but have clearly declined from last year’s peak.
Quarterly Energy Comment (December 15, 2017)
by Bill O’Grady
The Market
Oil prices have recovered strongly from the mid-summer lows. It appears we are establishing a new trading range between $55 and $60 per barrel.
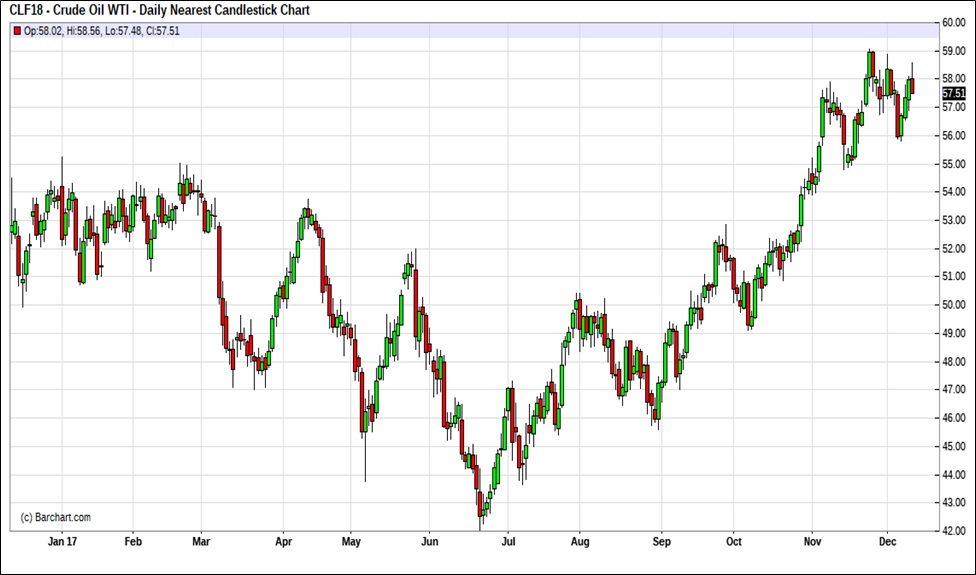
This recovery was mostly caused by a steady decline in U.S. domestic crude oil inventories, a weak dollar and OPEC output discipline. We expect OPEC to maintain output restrictions until the Saudis price their partial IPO of Saudi Aramco sometime in 2018.