Weekly Geopolitical Report – The Turkey Crisis: Part II (August 27, 2018)

by Bill O’Grady

(N.B. Due to the Labor Day holiday, the next report will be published on September 10.)

Last week, we covered Turkey’s geopolitics and history.[1]  This week, we complete the series, starting with a discussion on Turkey’s economy with a focus on the changes brought by the Justice and Development Party (AKP), led by President Erdogan.  We will also examine how foreign debt affects Turkey’s economy and financial system, highlight the impact of the 2016 coup and analyze the causes of the current crisis in Turkey.  From there, we will discuss the debt problem and Turkey’s options for resolving the crisis.  As always, we conclude with market ramifications.

View the full report


[1] See WGR, The Turkey Crisis: Part I (8/20/2018)

Asset Allocation Weekly (August 24, 2018)

by Asset Allocation Committee

What is price stability?  The working definition for the Federal Reserve was crafted by Alan Greenspan in 1994, when he suggested that price stability has been achieved when “…households and businesses need not factor expectations of changes in the average level of prices into their decisions.”[1]  In other words, a central bank has achieved its price objective not necessarily when it has reached 0% inflation but when households and firms no longer take inflation (or deflation) into account when making purchase or investment decisions.  This is probably the best answer to those who complain that 2% inflation is still inflation; although true, we have observed that no one seems to care about inflation around this level.  Once the perception of price stability has been achieved, firms and households react to price increases by assuming the rise is due to particular factors in a specific market, not because of overall inflation.  If prices rise in one market but economic actors don’t believe it’s due to an overall increase in the price level, then they are less likely to react to that specific price change by assuming they should buy other goods before prices increase there as well.

Assumptions surrounding price stability change how financial markets operate.  If investors fear inflation, or, more accurately, when expectations of price stability are absent, then anything that increases the fear of inflation, such as currency weakness, will force the central bank to raise rates to offset that concern.  The increase in interest rates will slow economic activity and weaken financial asset prices.  Fiscal expansion can cause similar fears.  On the other hand, when investors expect price stability, fiscal or monetary expansion is welcomed because it will support the economy and lift asset prices.

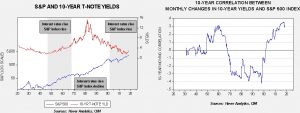
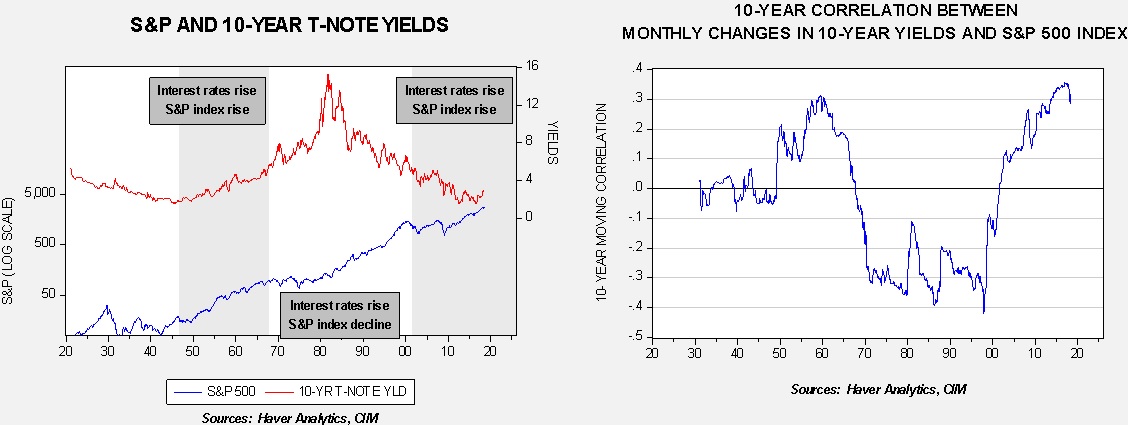
The chart on the left shows the 10-year T-note yield and the S&P 500 Index; the latter is on a log scale.  The chart on the right is the focus of this analysis.  Here we examine the 10-year moving correlation between the monthly change in the S&P 500 and the 10-year yield.  Note that the change in the two series was positively correlated from 1946 into 1967; in other words, when the S&P rose, so did long-duration interest rates.  From an investor’s perspective, the 10-year Treasury could act as a partial hedge to an equity portfolio.  Because bond prices fell when rates rose, a portfolio holding bonds and stocks would tend to have lower risk.  Under conditions of rising equity values, an investor would expect his bonds to fall in value and vice versa, meaning the same investor could expect his bond values to rise when equity values fell.

From 1967 into 2001, this correlation reversed its sign.  When rates rose, the S&P fell.  Thus, a portfolio of bonds and stocks, in terms of price, moved in the same direction.  Now, as the chart on the right shows, in terms of overall direction, there was a bull market in both bonds and stocks from roughly 1985 to 1990.  But, since we are examining this on a monthly change basis, there was still a tendency for rising interest rates to trigger equity weakness.  The 1987 crash is an example.

Since 2002 into the present, the correlation sign has reverted back to the 1946-67 condition.  This means that holding long-duration bonds in a portfolio will act as an effective hedge to an equity portfolio.  In other words, when equity prices fall, the prices within the fixed income portion of the portfolio will tend to rise.

Modern portfolio theory postulates that holding two less than perfectly correlated assets will offer some degree of risk-adjusted outperformance.  And, it is worth noting that the rolling correlation shown above isn’t ever all that strong, maxing out at around 0.4.  So, even during the late 1960s into the early aughts, holding bonds did offer some diversification effect.  However, when the correlation between bond prices and equities is inverse, it allows an investor to “hide” in fixed income during bear markets in equities.  That tactic wasn’t available to investors from the late 1960s through the mid-1980s.

The key to the relationship between bonds and stocks involves expectations surrounding price stability.   Price stability, in our opinion, rests on three legs.  The first is globalization.  By allowing firms and consumers to scour the globe for the best places to build productive capacity and source goods, price pressures are contained.  The second is deregulation.  Allowing firms to introduce new technologies and techniques into the economy without government interference supports efficiency and productivity.  And, central bank independence is the third pillar.  Allowing central banks to peruse the most appropriate monetary policy without political interference gives investors, consumers and firms confidence that inflation will not be allowed to erupt regularly for short-term political gain.  We monitor the viability of these three legs constantly.  Currently, the first is under fire and the third is facing threats as well.  If these components continue to face pressure, expectations of price stability could erode and proper asset allocation will change, too.  For now, we still expect price stability to be maintained but the threats are growing.  If the threats rise to a level that undermines price stability, we will act accordingly.

View the PDF


[1] https://www.dallasfed.org/~/media/documents/institute/wpapers/2008/0008.pdf

Weekly Geopolitical Report – The Turkey Crisis: Part I (August 20, 2018)

by Bill O’Grady

Over the past few months, Turkey has become a major topic of interest.  Recep Erdogan won re-election to the presidency in June 2018.  This event was important because a referendum on a new constitution in 2017 gave the office of the president sweeping powers; the previous constitution was based on a parliamentary model which gave more power to the prime minister.  According to the referendum, Erdogan could only exercise these new presidential powers after winning a new election.

Even before the election, there were signs the economy was overheating.  Inflation was increasing and the central bank was not raising rates in a manner consistent with quelling the inflationary pressure.  Since the election, an economic crisis has developed, with falling financial asset prices and a sharp decline in the Turkish lira (TRY).  In addition, Erdogan has found himself in a contest of wills with President Trump over Americans detained in Turkey.  This has led to punitive trade tariffs and threats of additional sanctions.

The goal of this report is to place the current crisis within the context of Turkey’s evolution and development.  Part I will examine Turkey’s geopolitics and history.  Part II will discuss economic factors, including the impact of foreign debt on Turkey’s economy and financial system.  We will highlight the impact of the 2016 coup and analyze the causes of the current crisis in Turkey.  From there, we will offer a discussion on the debt problem and Turkey’s options for resolving the crisis.  As always, we will conclude with market ramifications.

View the full report

Asset Allocation Weekly (August 17, 2018)

by Asset Allocation Committee

Last week, the Bureau of Labor Statistics released the CPI data for July.  Inflation continues to rise; the overall rate rose 2.9% and the closely watched core rate (the rate less food and energy) rose to 2.4%, the highest rate since September 2008.  Rising inflation raises policy concerns.  In this week’s report, we will analyze these concerns.

The rise in interest rates will support the Federal Reserve tightening stance.  To determine what the fed funds target rate “should” be, we use the Mankiw Rule model.  The Mankiw Rule model attempts to determine the neutral rate for fed funds, which is a rate that is neither accommodative nor stimulative.  Mankiw’s model is a variation of the Taylor Rule.  The latter measures the neutral rate using core CPI and the difference between GDP and potential GDP, which is an estimate of slack in the economy.  Potential GDP cannot be directly observed, only estimated.  To overcome this problem with potential GDP, Mankiw used the unemployment rate as a proxy for economic slack.  We have created four versions of the rule, one that follows the original construction by using the unemployment rate as a measure of slack, a second using the employment/population ratio, a third using involuntary part-time workers as a percentage of the total labor force and a fourth using yearly wage growth for non-supervisory workers.

Using the unemployment rate, the neutral rate is now 4.25%, up from last month’s estimate of 4.00%, reflecting the fall in the unemployment rate and the rise in inflation.  Using the employment/population ratio, the neutral rate is 2.07%, up from 1.84%.  Using involuntary part-time employment, the neutral rate is 4.00%, up from the last calculation of 3.68%.  Using wage growth for non-supervisory workers, the neutral rate is 2.48%, roughly unchanged from the last report of 2.41%.  All the variations show a rise in the neutral rate; two of them, the traditional one with the unemployment rate and the rate using involuntary part-time employment, are 4.00% or above.  The other two calculations are showing more slack in the economy, although both still suggest the FOMC needs to raise rates further.  The model based on the employment/ population ratio suggests one more hike of 25 bps to reach neutrality and three more times to achieve that level for the wage growth variation.

To determine the market’s projection for policy, we use the implied three-month LIBOR rate from the two-year deferred Eurodollar futures market.  In the past, it has been a reliable measure of the terminal fed funds rate.

The top line on the chart shows the spread between the implied LIBOR rate and the fed funds target.  We have placed vertical lines where the spread inverts and gray bars for recessions.  In the 1990s, Chair Greenspan faced two periods when the spread inverted; both times he cut rates[1] and was able to extend the expansion.  He was unable to avoid recession in 2001 despite aggressive cuts to fed funds, but that recession was considered to be unusually mild.  The Bernanke Fed did not lower rates when the spread inverted in 2006, leading to a period of extended policy tightness which may have increased risk to the economy.

Despite the rise in inflation, the implied three-month LIBOR rate from the two-year deferred Eurodollar futures market did not rise; in fact the most recent reading is 2.95%, suggesting the FOMC should stop raising rates when the target reaches 3.00%.  That still means five rate hikes are being discounted by the financial market.  Assuming two more this year, the Eurodollar futures are suggesting three hikes would be on tap for 2019.

The differences in the Mankiw Rule variations mean that the projected 3.00% rate would likely signal recession if the proper measure of slack is either the employment/population ratio or wage growth variation.  On the other hand, if the true measure of slack is the unemployment rate or involuntary part-time variation, then the Fed is running the risk of either triggering an inflation problem or inflating an asset bubble.  How do we know which is the best measure of slack?  There really is no good way to know for sure but if forced to choose we would select the wage growth variation as probably the best gauge.  Why?  Because overly tight labor markets should push wages higher and the fact that wage growth remains sluggish probably means there are “pockets” of workers still being drawn into the labor force.  The fact that the labor force is continuing to expand confirms this notion.  The argument against the wage growth variation is the idea that the labor market has become an oligopsony, meaning that firms have market power over labor and are holding down wages despite the lack of workers.  Although this is possible, we doubt this factor can hold down wages indefinitely.

If the wage growth variation is the correct measure of slack, we are still three tightening events away from neutrality.  Thus, for the time being, the risk of the FOMC overtightening and triggering a recession is low.  Nevertheless, the danger will rise by early next year and the risks of recession will rise appreciably by the second half of next year, assuming the Fed continues to ratchet rates higher.  We continue to closely monitor this dynamic into next year.

View the PDF


[1] However, the cut in 1998 was prompted more by the Long-Term Capital Management collapse that threatened the financial system.

Weekly Geopolitical Report – Iran Sanctions and Potential Responses: Part III (August 13, 2018)

by Bill O’Grady

The Trump administration withdrew from the Iranian nuclear deal earlier this year and plans to implement sanctions on the country in two phases, the first of which went into effect in early August with a second round in November.  In Part I of this report, we introduced this topic and covered the first two potential responses from Iran, which were restarting the nuclear program and projecting power.  Last week, we covered the threat to the Strait of Hormuz.  This week, we will conclude with a discussion on the potential for Iran to deploy a cyberattack against the U.S. or use allies to end sanctions, along with the likelihood that Iran would enter into direct negotiations with Washington.  We will conclude with market ramifications.

View the full report

Asset Allocation Weekly (August 10, 2018)

by Asset Allocation Committee

Last year, we introduced an indicator of the basic health of the economy and added it to the many charts we monitor to gauge market conditions.  The indicator is constructed with commodity prices, initial claims and consumer confidence.  The thesis behind this indicator is that these three components should offer a simple and clear picture of the economy; in other words, rising initial claims coupled with falling commodity prices and consumer confidence is a warning that a downturn may be imminent.  The opposite condition should support further economic recovery.  In this report, we will update the indicator with the July data.

This chart shows the results of the indicator and the S&P 500 since 1995.  The updated chart shows that the economy is doing quite well.  We have placed vertical lines at certain points when the indicator falls below zero.  Although it works fairly well as a signal that equities are turning lower, there is a lag.  In other words, by the time this indicator suggests the economy is in trouble, the recession is likely near or underway and the equity markets have already begun their decline.

To make the indicator more sensitive, we took the 18-month change and put the signal threshold at        -1.0.  This provides an earlier bearish signal and also eliminates the false positives that the zero threshold generates.  Notwithstanding, we will pay close attention when the 18-month change approaches zero.

What does the indicator say now?  The economy is healthy and currently supportive for equity markets, although the second chart does show that momentum is starting to slow, albeit from a very high level of activity.  The second chart shows that the indicator is still comfortably above the point of concern.  Thus, for now, there is no economic evidence to support a major correction; if one is to occur, it will mostly likely be generated by a geopolitical event.

View the PDF

Weekly Geopolitical Report – Iran Sanctions and Potential Responses: Part II (August 6, 2018)

by Bill O’Grady

Last week, we introduced the topic of the Trump administration’s decision to implement sanctions on Iran and covered two potential responses from Iran, which were restarting its nuclear program and projecting power.  This week, we will discuss the threat to the Strait of Hormuz.

Response #3: Closing the Strait of Hormuz
On its face, it seems somewhat illogical for Iran to close the Strait of Hormuz to oil traffic because it would not only prevent the Gulf States and Iraq from exporting oil, but it would prevent Iran from doing so as well.  As a result, we believe that Iran would only take this step if sanctions were so effective as to nearly end Iranian oil exports.  Thus, Iran would have to be in dire “straits” before taking this step.

The world has several recognized oil flow “chokepoints” where there is the potential for a disruption of oil flows.

(Source: EIA)

As the global superpower, one responsibility of the U.S. is to secure the world’s sea lanes to support global trade.  As this map shows, there are numerous points where oil trade could be affected by blockades.  In terms of volume, the two most critical are the Strait of Hormuz, through which about 18.5 mbpd and products pass, and the Strait of Malacca, which sees about 16.0 mbpd of energy traffic.  Much of the oil, refined product and LNG produced in the Middle East passes through the Strait of Hormuz.  Energy destined for the Far East moves through the Strait of Malacca, while flows to the Western Hemisphere and Europe either pass through the Suez Canal and the SUMED pipeline or the Cape of Good Hope.[1]  Disruptions to the latter group would tend to have more severe regional effects, whereas disruption to the Strait of Hormuz would affect global energy supplies.

View the full report


[1] We note that Houthi rebels apparently recently threatened a Saudi oil tanker in the Red Sea at the Bab el-Mandab chokepoint: https://www.ft.com/content/f0858962-9005-11e8-b639-7680cedcc421; we don’t view this threat to be as significant as actions in the Strait of Hormuz, but if Iran were able to threaten both chokepoints it would have a much more substantial impact on prices.  For now, we are assuming this attack was a “one-off” and not part of a campaign to stop Red Sea shipping.

Asset Allocation Weekly (August 3, 2018)

by Asset Allocation Committee

At the end of June, we published a study of how the equity and bond markets reacted to the inversion of the yield curve.  This week’s report takes that inversion data and compares it to how the 10 sectors of the S&P 500 perform.[1]  For this report, we will use the two-year/10-year Treasury spread as our yield curve variation; although this alternative has a shorter history than the fed funds/10-year Treasury spread, data on the 10 sectors we will analyze begins in 1988.  Thus, the two-year/10-year Treasury spread will offer enough history to analyze the behavior of the sectors.

For reference, this is the two-year/10-year Treasury spread.

The gray bars show recession and the red vertical lines are placed where the yield curve inverts.  On average, it takes 15-months from inversion to recession, with the range being 10 to 18 months.

The sector data only covers the last three recessions.  We have taken each inversion and index the 10 sectors to the inversion, tracking the data one year before the inversion and two years after.  The chart below averages the three events.

We have placed vertical lines at the point of inversion at one year and two years from inversion.  As we noted earlier, the overall S&P 500 tends to avoid an outright decline until the recession starts.  The best sectors are Health Care, Consumer Staples and Energy.  Materials and Industrials tend to hold up.  The worst performing sectors are Technology, Telecom and Financials, although Financials performed rather well in the 2000 inversion.  Thus, there are no huge surprises here.  Health Care and Consumer Staples are defensive sectors.  In all three cases, oil prices were rising into the inversions and thus supported energy equities.  The 2000 inversion and subsequent recession also ushered in a major decline in Technology and Telecom and these sectors were generally weak during the other two events.  Finance fell hard in the 1989 and 2006 inversions.

This tells us that when the next inversion occurs, investors should consider positions in Health Care, Consumer Staples and Energy, with underweights in Technology and Telecom.  Obviously, each cycle has its own unique characteristics, but history does offer some insight into potential market behavior.

View the PDF


[1] We exclude REITS from this study.

Weekly Geopolitical Report – Iran Sanctions and Potential Responses: Part I (July 30, 2018)

by Bill O’Grady

In May, the Trump administration withdrew from the nuclear deal with Iran, officially known as the Joint Comprehensive Plan of Action (JCPOA).  The European participants (the other signatories were the U.K., Russia, France, Germany and China) tried to convince President Trump that leaving the pact would be a mistake, but President Trump has never been comfortable with the arrangement.  Clearly, it wasn’t perfect.  The agreement did not end Iran’s nuclear threat, but merely delayed it.  Furthermore, the agreement did not force Iran to address its missile program and did nothing to slow its attempts at regional hegemony.

It has been our position that the Obama administration concluded that its superpower obligations had become overly burdensome.  Of the three areas of the world where the U.S. essentially provided security, Europe, the Far East and the Middle East,[1] the Obama administration determined that the Middle East was the least important and wanted to “pivot” to the rapidly growing Asian region.  However, to reduce America’s “footprint” in the region, the U.S. had to put a regional hegemon in place.  It appears Obama believed that Iran was the only country that could fill the role.  That decision was clearly controversial.  Iran had been at odds with the U.S. since the 1979 Iranian Revolution and the hostage crisis.  Nevertheless, the idea was not without its supporters.[2]  In fact, in an ideal situation, the U.S. would try to foster another nearly equal power in the region that would oppose Iran’s designs and they would balance each other.  Unfortunately, none of the Sunni powers appear to be strong enough for that role and Israel lacks strategic depth.  Only Turkey could act as a counterweight but the Erdogan government did not seem interested.  Although the nuclear deal did not install Iran as the regional hegemon, we suspect President Obama assumed Hillary Clinton would be his successor and she would complete the “pivot.”

Instead, Donald Trump won the election.  The Gulf States and Israel moved quickly to improve relations with Washington that had deteriorated under the previous administration.  Candidate Trump was critical of the Iranian nuclear deal and vowed to end it.  As noted above, he did so in early spring.

Although the rest of the signatories remain committed to the original agreement, the U.S. is planning to implement sanctions on Iran in two phases; the first in early August with a second round in November.  Given the universality of the dollar in global trade, only China and Russia can likely afford to remain in the pact.  The European nations[3] are too dependent on the U.S. financial system for their companies to risk sanctions by doing business with Iran.  Already, Japan[4] and South Korea[5] have indicated they will reduce or end their purchases of Iranian crude oil.  Although China could offset some of the lost investment from Europe, the Xi government probably would exact onerous terms.  Russia may be helpful in the geopolitical arena but won’t be a significant contributor to Iran’s economy.

Therefore, Iran, which views the Trump administration’s actions as hostile, is trying to effect a response.  While Iran has indicated it wants to keep the nuclear pact in place, the deal is only useful if it helps expand its economy.  And, if the U.S. intends to harm Iran’s economy, the regime has to contemplate retaliation, which may include rescinding its participation in the agreement.

This will be a three-part report in which we will examine Iran’s options for responding to the return of sanctions.  In Part I, we will discuss the possibilities that Iran ends the JCPOA and moves to build a deliverable nuclear weapon as well as increases its power projection in the region.  In Part II, we will analyze the ever-present Iranian threat to disrupt shipping in the Strait of Hormuz and perhaps elsewhere.  In Part III, we will touch on the potential for Iran to deploy a cyberattack against the U.S. along with the possibility that Iran uses allies to end sanctions and enter into direct negotiations with Washington.  We will conclude with market ramifications.

View the full report


[1] For a summary of our views on American hegemony and frozen conflicts, see Weekly Geopolitical Report, The Mid-Year Geopolitical Outlook (6/25/18)

[2] Baer, Robert. (2008). The Devil We Know: Dealing with the New Iranian Superpower. New York, NY: Penguin Random House.

[3] https://www.reuters.com/article/us-iran-oil-europe/european-refiners-winding-down-purchases-of-iranian-oil-idUSKCN1J21F0 and https://www.washingtonpost.com/world/europe/europeans-scramble-to-save-iran-nuclear-deal-but-face-new-concerns-over-us-sanctions/2018/05/09/39937066-536f-11e8-abd8-265bd07a9859_story.html?utm_term=.befb864c5230

[4] https://asia.nikkei.com/Politics/International-Relations/Japan-set-to-halt-imports-of-Iranian-oil

[5] https://www.reuters.com/article/us-southkorea-iran-oil/south-korea-suspends-iranian-oil-loading-in-july-for-first-time-since-2012-sources-idUSKBN1JW07R