

Asset Allocation Weekly (September 21, 2018)
by Asset Allocation Committee
In this week’s report, we will focus on the U.S. economy. Since the 1987 crash every major equity market decline has coincided with a recession. Thus, we pay close attention to the economy with the goal of projecting the next recession.
This expansion, which began in June 2009, is now the second longest in U.S. history.[1]
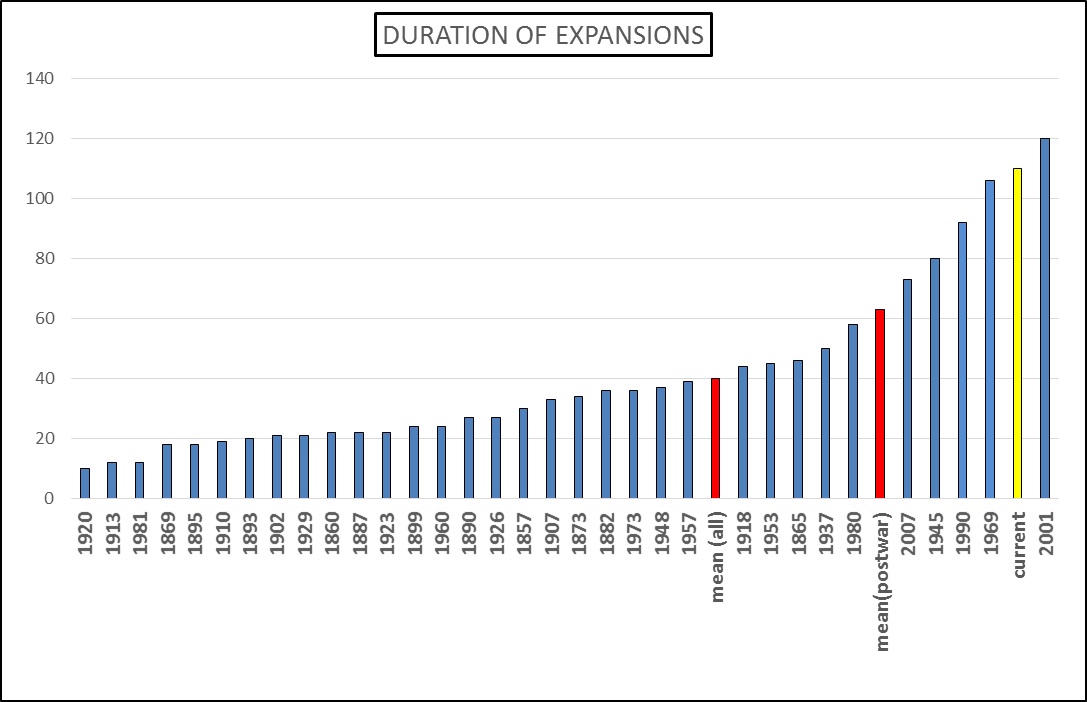
If the expansion makes it another eight months, it will tie the longest expansion, which ended with the 2001 recession. Business cycles have been lengthening in recent years.
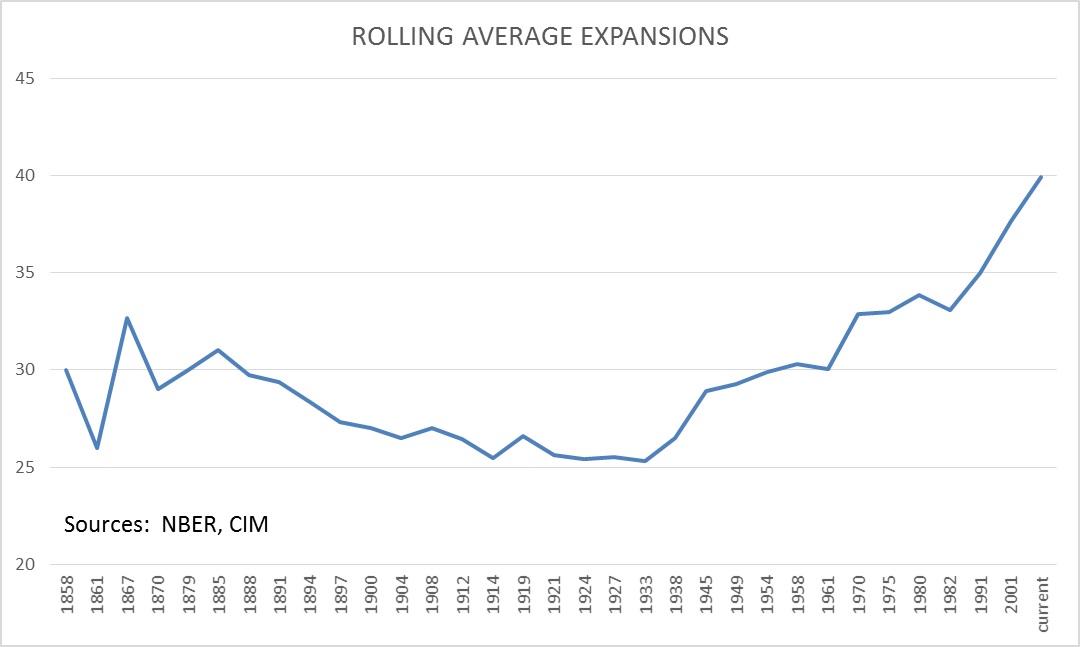
Since the Great Depression, expansions have been lengthening. Moving off the gold standard has allowed for discretionary monetary policy which has tended to support longer expansions. However, the most important factor that has supported longer business cycles in the past forty years has been falling inflation. As inflation declines, the Federal Reserve has less need to aggressively tighten credit which supports economic expansion.
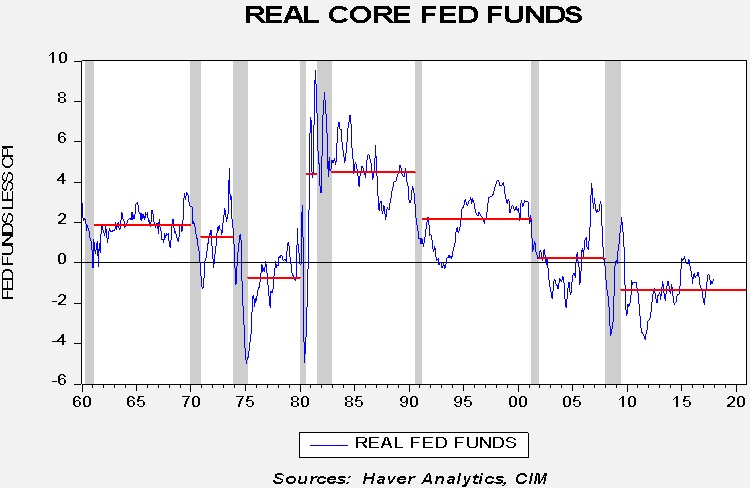
This chart measures real fed funds (effective fed funds less yearly CPI). Note that since the early 1980s, each cycle has had a lower average real rate over the term of the recovery. Much of this is because the Federal Reserve has successfully lowered inflation expectations. With lowered expectations of inflation, the U.S. central bank can keep rates lower for longer without triggering overheating. The ability to keep rates low has allowed for longer business expansions.
The current economy is doing quite well.
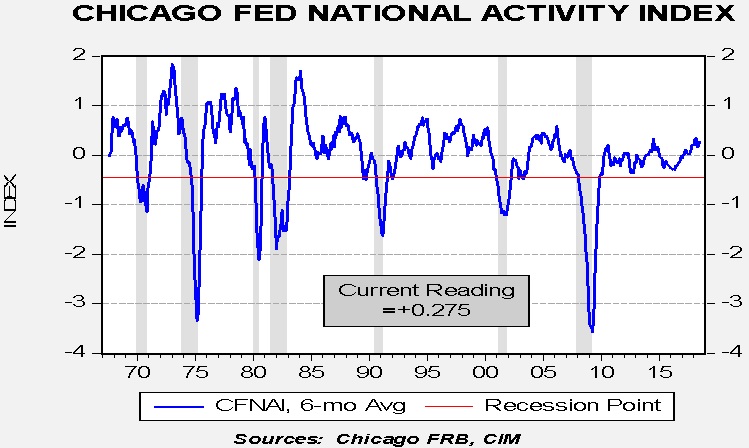
This chart shows the Chicago FRB National Activity Index, a broad-based index of economic indicators which are structured against trend. When the reading is above zero, the economy is growing above trend and vice versa. We smooth the data with a six-month moving average. Overall, the economy is running well above trend.
The most interesting issue with the economy is potential growth.
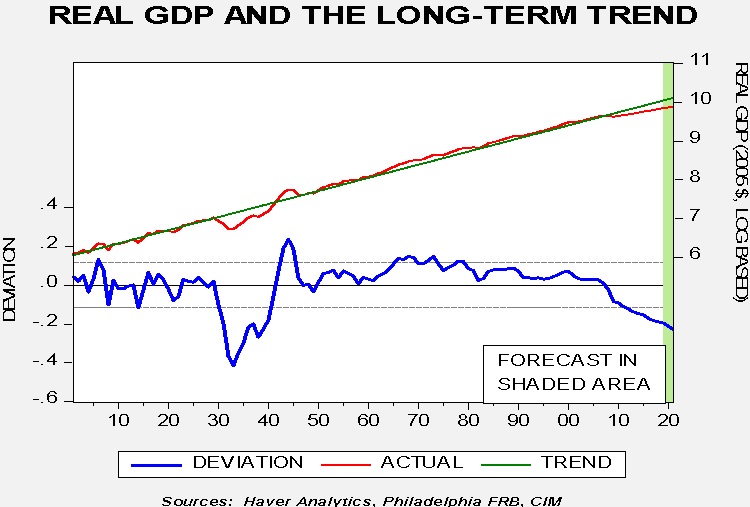
This chart looks at the long-term pattern of real GDP; we have put the data on a log scale and regressed it against a time trend. The deviation line on the lower part of the graph shows the deviation from the long-term trend. We have only seen two periods of well below-trend growth, during the Great Depression and the current environment. It is unknown whether or not the long-term trend still represents potential output. If it does, not only will the economy easily absorb the stimulus without triggering inflation but the FOMC should be very careful about tightening monetary policy. Note the dip in the deviation chart in 1937; that was due to premature fiscal and monetary tightening that led to a short but deep recession. We tend to think there is more slack in the economy than generally thought. Although the odds are rising that the FOMC will overtighten monetary policy, given the current path of policy, we probably won’t reach the point of concern until the middle of next year.
[1] The National Bureau of Economic Research is the arbiter of business cycles. It began tracking business cycles in 1854.