Asset Allocation Weekly (October 26, 2018)

by Asset Allocation Committee

One of the earliest lessons taught in statistics is that “correlation does not equal causality.”  Any relationship that exists between two variables usually rests on a myriad of conditions; if any of these conditions change, correlations can break down rapidly.  This doesn’t mean that correlation isn’t a useful tool but it show that one must be aware of the conditions that support the relationship.  If those conditions prove to be unstable, the resulting correlation can be unreliable.  In addition, when a correlation breaks down, it’s important to figure out why.  Sometimes the change in correlation is understandable; in other circumstances, it can signal more ominous problems.

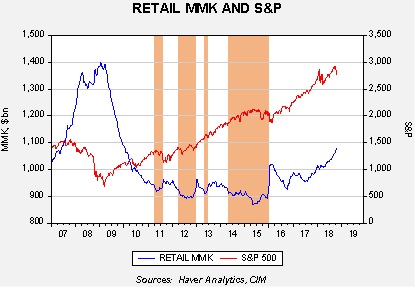
This chart shows the level of retail money market funds along with the S&P 500 on a weekly basis.  We have highlighted four periods.  These periods show that equity performance stalls when the level of retail money market funds falls below $920 bn.  It would seem that households had a minimum level of desired liquidity and if that level falls below that minimum then households would liquidate financial assets to rebuild cash.  After money market funds were rebuilt, equities tended to recover.

It appears that this relationship is breaking down.  We have seen choppy equity performance this year with money market funds continuing to rise; in other words, households have levels of cash available that, in recent years, would have led to equity purchases.  So, why did this relationship break down?  Although there could be a myriad of reasons, here are the two we think are most likely.

Current interest rates are attractive to investors.  After years of near-zero interest rates on cash and near-cash instruments, current yields look remarkably high.

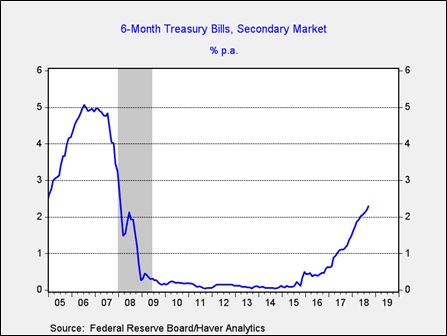
This chart shows the six-month T-bill rate; in the middle of 2015, the yield was a mere 9 bps.  The current yield is 2.29%.  Although this is still a low rate historically,[1] the perceived penalty for holding cash is much less onerous than three years ago.

There are rising levels of fear among investors.  Fear is hard to define but here are three potential concerns that are probably reducing enthusiasm for equities.

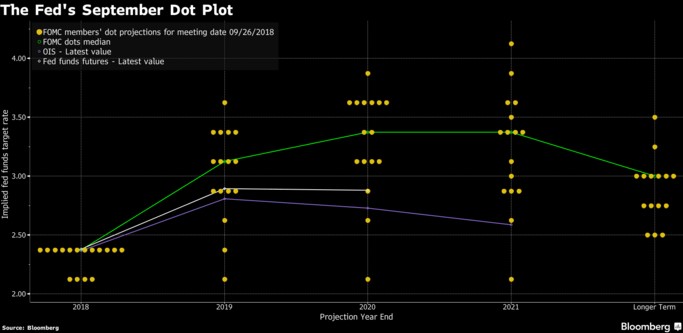
  1. Monetary policy tightening is raising the risk of recession. Business expansions don’t end “naturally.”  The usual causes are excessive monetary policy tightening or a geopolitical event.  Although the FOMC is raising rates, we are not yet at a level that would be considered tight by any measure.  Real fed funds remain below zero; the past three recessions occurred with real fed funds in excess of 2.5%.  That would imply a fed funds of nearly 5% based on the current overall CPI of 2.3%.  However, the 2008 Financial Crisis may have changed how the economy works and thus there may be greater sensitivity to policy tightening.  The FOMC does appear cognizant of this risk and is moving rates up slowly.
  2. Fears of a change in the inflation regime. After peaking at 14.8% in March 1980, overall CPI has averaged a mere 2.6% since 1985.  The Federal Reserve is given much of the credit for this development, although we believe globalization and deregulation played a much larger role in keeping price increases contained.  Unfortunately, these two factors also tend to cause inequality and there is growing political backlash against both.  President Trump’s changes to trade policy and the rising criticism against technology companies are, perhaps, a signal of a regime change.  The fact that we have seen weak equities and rising long-duration yields simultaneously may be signaling that concerns about the inflation regime are rising.  However, our analysis suggests that most of the recent rise in long-dated yields can be explained by monetary policy tightening.  If the inflation regime changes (inflation expectations become unanchored, using “Fedspeak”) we would expect further price weakness for equities and long-duration debt.
  3. Lingering fears of 2008. The 2008 Financial Crisis was a generational event, undermining investor faith in markets and policy.  After the Great Depression, it took investors years before confidence returned.

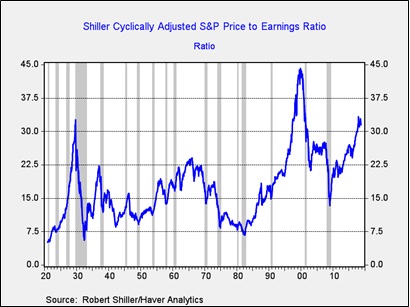
This chart shows the Schiller CAPE.  Although there were occasional bounces when the P/E rose above 15x after the Great Depression, it wasn’t until the late 1950s that we saw a sustained rise in multiples.  That has not been the experience of the equity market thus far but the market has also been supported by extraordinary policy support.  Although anecdotal, in our travels talking to investors, we hear a nearly universal comment that, “I can’t suffer through another event like 2008 again.”  Thus, it would not be unreasonable to see investors move to cash if they see even faint signs of recession.

So, what do we glean from this analysis?  Rising rates are looking attractive to some investors, especially those with high levels of risk aversion.  At the same time, even 3.0% on T-bills isn’t much of a return and probably has had a limited impact on equities.  The fear section is more telling.  If the primary fear is overly tight monetary policy, then any hint of a pause should be bullish for equities.  That’s especially true given high cash levels.  A regime change in inflation is perhaps the greatest threat; there are clearly changes occurring that are worrisome but the general realization that the regime has changed takes time.  We are watching this issue carefully but, so far, we are not ready to declare a change.  If regime change were the primary factor, long-term interest rates would be rising much faster.  The fear of another 2008 will be with investors for a generation.  That fear may lead to more frequent corrections, especially under conditions where monetary policy isn’t overtly accommodative.  In some respects, that is a healthier situation for equity markets as it reduces the odds of bubbles.  Our take is that the primary factor behind the rise in cash is monetary policy tightening.

View the PDF


[1] The average rate since 1970 is 5.04%.

Weekly Geopolitical Report – Return of the Strongman: Part I (October 22, 2018)

by Thomas Wash

On October 7th, Jair Bolsonaro, a far-right populist, made it out of the first round of presidential elections in Brazil in decisive fashion. A controversial figure within his country, Bolsonaro was able to build his popularity on the growing distrust of the government. Rising crime, corruption scandals and a record-breaking recession have led the public to push for an end to the current three-party coalition’s dominance in government. Bolsonaro’s off-the-cuff remarks, although sometimes considered offensive, have helped him form an image as being relatable to the common Brazilian. His political opponent, Fernando Haddad of the Workers’ Party, has struggled to gain support in light of the corruption scandals that plague his party. As a result, Bolsonaro has a commanding lead in the polls going into the second round of run-off elections. Barring a major upset, Bolsonaro is poised to win the October 28th presidential election.

Brazilian equities jumped following the results of the first round of elections. The rise can be attributed to the anticipated removal of the Workers’ Party from office as opposed to approval of Bolsonaro. Furthermore, the reputation of the Workers’ Party for overspending and mismanaging Brazil’s economy has deterred voters. Rising scandals have only added to those woes as its party leader, Dilma Rousseff, was impeached from the presidency and its original presidential candidate, Luiz Inácio Lula da Silva, was convicted and jailed on corruption charges. However, it appears that markets may be willing to give Bolsonaro a chance. He has admitted he does not know much about economics but says he is willing to allow his economic advisors to guide his policies.[1]

Despite being the largest economy in South America, Brazil has a turbulent economic history. Blessed to be rich in commodities, Brazil’s reliance on commodity exports has left it vulnerable to boom and bust cycles. As a result of the fluctuations in its economy, the public has experimented with different political regimes and schools of economic thought. In Part I of this report, we will give a brief summary of Brazil’s history, from its time as a Portuguese colony to what it has become today. The report will be broken into three periods, the first will discuss Brazil’s time as a colony, then Brazil as a military dictatorship and finally present-day Brazil as a republic.

View the full report


[1] https://www.bloomberg.com/news/articles/2018-10-10/brazil-s-far-right-candidate-jair-bolsonaro-is-having-a-bad-day

Asset Allocation Weekly (October 19, 2018)

by Asset Allocation Committee

The accompanying notes to the release of the FOMC minutes on October 17th indicated expectations from a majority of members to eventually push fed fund rates above the level that they would otherwise view as neutral.  In the most recent projections, the average of members’ estimates for the neutral level by 2021 is 3.0%.

(Source: Bloomberg)

We understand the hawkish tone these notes carry within the context of the mention of the Beveridge Curve.  According to this data, the labor markets appear to be tight.  The chart below shows a modified Beveridge Curve, which is a graphical representation of the relationship of the number of openings represented as an index and the unemployment rate.  The chart starts toward the end of the previous cycle in 2007 and tracks the relationship through the end of August.  The lower end of the curve represents the slowing momentum in the previous cycle and the higher end of the curve represents the current cycle.  A reversal of the curve would typically signal an inflection point within the cycle; a reversal downward toward the right signals deceleration, whereas a reversal upward toward the left signals acceleration.  According to the chart below, the Beveridge curve continues its upward trend as job vacancies hit a cycle record at 172.51 in August, while the unemployment rate remained steady at 3.9%.[1]

(Source: BLS, CIM)

Although the Beveridge Curve suggests there is tightness in the labor market, the chart below indicates a degree of slack still remains.  Wage growth is widely perceived as being insufficient to encourage longer term unemployed individuals to re-enter the labor market; hence the concerns of some market participants that Fed tightening could lead to an economic downturn.

Though we acknowledge overly tight labor conditions can lead to inflation surprises, at this juncture we view the inflationary data to be productive and not hostile.  Moreover, the Fed actions appear to be geared toward asset inflation as opposed to inflation in the real economy. In light of Fed tightening, we don’t expect an acceleration of the pace of rate hikes; thus, financial markets should be able to adjust without significant disruption.

View the PDF


[1] Due to JOLTS being published on a one-month delay, August is the latest reading.  The current unemployment rate is 3.7%.

Keller Quarterly (October 2018)

Letter to Investors

Here we are just a little more than three-quarters of the way through 2018.  While many might regard this as a rather unusual year for the stock market, it really hasn’t been all that unusual.  This is true even though the market is now experiencing its second downturn of greater than 5% in 2018 (per the S&P 500 Index, as in the following discussion).  This is completely normal.  As we noted in our quarterly letter from six months ago: “Our firm’s Chief Market Strategist Bill O’Grady recently reported that over the last 90 years the stock market has averaged 3.4 corrections of 5% or greater per year.  Over the same time frame the market also averaged 1.1 corrections of 10% or greater per year.”  On January 26th of this year the market peaked and proceeded to fall just over 10% during the next couple of months.  After that the market recovered and then exceeded the January 26th high.  After peaking at a new high on September 20th the market then declined about 8%.  “What is happening here?”  Nothing strange at all.  In fact, this sort of market volatility is completely normal.  What was unusual was that for almost two-years prior to January 26th we had no sell-offs of even 5%!

As we’ve pointed out on numerous occasions, we welcome the return of normal volatility because it gives the opportunity to buy shares of great companies at discounted prices.  We play the long-game here at Confluence.  By that I mean we make investments on behalf of our clients that are intended to be in place for many years.  In some of our equity strategies we’ve held some stocks for a decade or two.  We believe that long-term investing is not only tax-efficient, but it just works better for investors whose time horizons are also long term.  Thus, day-to-day or even month-to-month volatility doesn’t cause us to change our long-term strategies; in fact, we expect the volatility and plan to take full advantage of it.

Many regard a “normal” bull market as one where all stocks appreciate together.  “A rising tide lifts all ships,” is a phrase you may have heard.  That is often the case in a new cyclical bull market emerging from a recession or in a world of low interest rate policy.  But, in the sort of world we’re in now, it’s not unusual to see the performance of many stocks and sectors diverge.  What is that world?  It’s a world of more rapid economic growth and rising interest rates.  In economic climates like this one, investors tend to chase stocks of fast-growing companies and eschew those with high dividends.  This is normal at this point in the cycle.

Well, then, shouldn’t an investor try to “move around” the market, selling what’s out of favor this year and buying what’s in vogue?  If only it were that easy.  It’s actually not only difficult but creates great risks to long-term performance.  But what if it were easy, and what’s out of favor this year were stocks of outstanding businesses owned for many years at low cost bases?  Would it make sense to sell those and pay the taxes for a fling with lesser businesses that are popular vehicles this year?  And what if you don’t get back into your outstanding long-term stocks soon enough and have to pay up for them?  You see where I’m going with this, I hope.  While some see investing as trading from one fast horse to the next fast horse at just the right time, we see good long-term investing as more of a marathon, won by the ownership of great companies for many years, even if they lag in some years.

This is a year when many of the best companies whose businesses are protected by some of the widest moats are lagging the market.  On the other hand, stocks of other great businesses are doing just fine this year.  That’s what divergence in the stock market means.  We’ve seen it before, and it doesn’t bother us at all because, as noted above, we take a long view of the business of investing.

We appreciate your confidence in us.


Gratefully,

Mark A. Keller, CFA
CEO and Chief Investment Officer

View the PDF

Asset Allocation Quarterly (Fourth Quarter 2018)

  • The U.S. economy is stable and growing, with sentiment indicators remaining high. A recession is not included in our cyclical forecast.
  • The Fed’s tightening policy has thus far had modest effects. We expect a continuation of increases in the fed funds rate in tandem with a reduction of the Fed’s balance sheet.
  • Though unemployment is low, we find that the employment/population ratio indicates a continuance of slack in the labor force, thereby blunting the potential impact of wage growth on inflation.
  • Midterm elections in the U.S. hold the potential for a divided government, which dims the prospect for new legislation to be enacted.
  • The asset allocation portfolios retain their high relative weighting to equities given economic health and expectations for continued GDP growth. At this point in the economic cycle, our style bias remains in favor of growth at 60%/40%.

View the complete PDF


ECONOMIC VIEWPOINTS

The U.S. economy continues to be on sound footing. Real GDP, as exhibited in the accompanying chart, has been growing for over nine years, representing the second longest U.S. economic expansion on record. Sentiment, as measured by the NFIB Small Business Optimism Index and the University of Michigan Consumer Sentiment Index, remains high. Inflation is contained, with readings of CPI regularly registering below the 20-year average. Corporate earnings are strong, with the vast majority of firms reporting results in the second quarter in excess of expectations.

Although economic conditions are positive and appetites among U.S. businesses and consumers are healthy, we are cognizant that events can transpire to upset a field of roses and buttercups. Trade frictions have commanded the headlines since February. Though we readily admit that tariffs and other barriers to trade have the potential to increase costs, thus leading to lesser profits for businesses and/or the kindling of nascent inflationary pressures, we believe that new supply chains can be woven to circumvent the barriers, thereby mitigating the full economic consequences of tariffs and trade obstacles. Of greater consequence, we believe, are lagging effects of last year’s tax reform. One area we have identified as being potentially poignant is the oversight among many rank-and-file workers to adjust their withholding in light of the modified tax tables. Though they have enjoyed higher take-home pay each month, those who have previously basked in a fat refund check during past tax seasons may well find themselves with lesser refunds come next spring. Should this affect a substantial proportion of middle income taxpayers, the derivative effects may be a climb in aggregate credit card debt outstanding, reduced consumer expenditures on travel and dining and, more explicitly damaging to the broader economy and thereby GDP, lower demand for consumer durables. In and of itself, diminished tax refunds will not in all likelihood cripple the economy. Yet in concert with the impact of trade policies, albeit diminished, an overall decline in sentiment, wage pressures and perhaps an overzealous Fed, economic conditions may be less appealing by this time next year.

An antithetical example is probably more plausible. In the event of a divided government wrought by the Democrats wrenching the U.S. House and even the Senate from the Republicans during the midterm elections, the Trump administration and Congress may find common ground on infrastructure spending. Should this transpire, it may push what some consider to be an already giddy economy into pure economic ecstasy, thereby propelling the U.S. equity markets to even higher valuations in what we have described as a “melt-up” in prior publications. The other side of the coin in this scenario is a bond market sell-off stemming from either higher issuance of Treasuries and municipals or elevated inflation expectations, or both.

Note that the foregoing paragraphs are certainly not our base case, which is for steady normalization of rates by the Fed, continued economic growth, solid corporate profitability and healthy confidence. Rather, the preceding illustrations are intended to underscore the importance of continually monitoring data to ascertain whether our asset allocation facings are appropriate or are in need of adjustment.  Although diversification among asset classes is a hallmark of modern portfolio theory, allocations based on stagnant assumptions can produce spurious results. Accordingly, expected returns, risk and yields require regular updates to provide proper diversification among asset classes. This is the crux of our cyclical asset allocation process, assessing the expected returns, risk and yields over the ensuing economic cycle utilizing relevant data to ensure risk-appropriate positioning.

STOCK MARKET OUTLOOK

Our views on the U.S. equity markets remain favorable. Although the probability of increased volatility is resident, we view the economic landscape as constructive for equities. While tariffs and trade barriers are affecting certain companies unfavorably, we expect corporate profitability in the aggregate to continue its ascent, though at a lower rate than experienced thus far this year, which was aided by changes to the tax code. The repatriation of assets held abroad has already had positive influences on dividends, share repurchases and increased M&A activity, despite the levels of repatriation being lower than the markets originally forecasted. However, as the IRS finalizes its rules on repatriation, the level is likely to grow. Our analysis suggests that this should prove beneficial for prices of companies classified as mid-cap and small cap, as well as in the lower strata of large cap, by virtue of increased M&A activity. Accordingly, all of our asset allocation portfolios have historically high levels of equity exposure and there is a leaning toward mid-cap and small cap equities for the portfolios where it is risk appropriate.

With regard to style and sectors, we find that our existing 60% tilt toward growth remains appropriate at this juncture in the economic cycle. Equities traditionally characterized as growth are generally rewarded in the latter stages of expansions. An area of the growth style that encourages near-term caution include those securities that have been reclassified as part of last quarter’s configuration of the communication services sector. Even though the repositioning has already occurred, we expect some choppiness as an echo from the reclassification. Beyond the tilt to growth, we remain overweight to the energy, financials and materials sectors. Since these contain stocks that are classified mostly as value, the collective overweight to these sectors has the effect of reducing the growth tilt to roughly 55% in the large cap sleeve of the portfolios.

Beyond the U.S., we retain much of last quarter’s non-U.S. equity positioning. Valuations for non-U.S. companies relative to their U.S. counterparts remain compelling, yet returns for U.S.-based investors are obviously influenced by the value of the U.S. dollar. We also have exposures to emerging market equities in the portfolios where risk appropriate.

BOND MARKET OUTLOOK

Hand-wringing over the flattening of the yield curve that was so prominent during the summer months has been supplanted in just a few weeks by concerns of curve steepening caused by increases in inflation expectations. Comments about the bond market are typically filled with hyperbole, but the histrionics this year have seemed to become shrill.  Despite the angst expressed by many, we hold the opinion that in its current trajectory the Fed is moving toward a more sound and normalized footing. We recognize that there exists the potential for a misstep by the Fed, either through being overzealous in efforts to raise fed funds and reduce the size of the balance sheet or by becoming too docile in response to a Tweet storm. However, we believe the laddered positioning that we enacted at the beginning of the year is the appropriate positioning for this phase of the economic cycle. The duration posture of the portfolios tend to be shorter than the broader indices, mostly due to the quarterly erosion effected by the use of the ladders. The portfolios remain heavily exposed to investment-grade credit through the laddered ETFs and the exposure to longer dated Treasuries has been reduced. We continue to harbor some trepidation regarding speculative-grade bonds given their tight spreads to maturity-equivalent Treasuries and the necessity of refinancing nearly $1 trillion of high-yield bonds set to mature between 2019 and 2022. As a result, the exposure to speculative grade bonds is at historically low levels in our portfolios.

OTHER MARKETS

We retain an allocation to REITs in the more income-oriented portfolios due to attractive and improving dividend yields and the diversified income stream they afford. Relative to speculative-grade bonds, we find the potential risk/reward to be superior in REITs.

The modest allocation to gold is maintained owing to the combination of its ability to offer a hedge against geopolitical risk and the safe haven it can offer during an uncertain climate for the U.S. dollar.

View the complete PDF

Asset Allocation Weekly (October 12, 2018)

by Asset Allocation Committee

Politics is usually an uncomfortable topic for financial market analysts.  The subject is fraught with high emotion, and being overly concerned about a specific political outcome can sometimes cloud judgement.  At the same time, political trends offer insight into future policy changes that can affect financial market performance.  For example, we have documented the growing trend of populism and its potential impact on economic and market performance.[1]

One of the more disturbing trends we have noted in recent years is the growing division among Americans that is being reflected in our political system.  Race and gender concerns in marriage have become less of a concern, but marrying across political lines has become increasingly frowned upon.[2]   The level of partisanship has increased steadily over the past two decades.

(Source: Rosenthal and Poole)

This data measures the difference between the party voting patterns in Congress.  The higher the number, the greater the degree of difference, meaning a higher level of partisanship.  A similar measure that estimates the percentage of overlapping members (likelihood of voting across party lines) has diminished as well.

(Source: Rosenthal and Poole)

This deepening polarization, coupled with the widespread use of social media, is leading to increasingly aggressive behavior and threats.[3]  More American institutions are progressively being viewed under the lens of partisanship; the courts, regulatory agencies and law enforcement are all facing scrutiny for their decisions.  Reaching an agreement on the impact of seemingly objective facts is becoming increasingly difficult.

The reasons for polarization are beyond the scope of this report.  Our concern is the impact of polarization and partisanship on financial markets.  So far, the Federal Reserve has mostly avoided the worst of this trend.  However, it would seem naïve to believe that the U.S. central bank can remain above the partisan fray indefinitely.  Already, President Trump has undermined protocol with regard to monetary policy established by Robert Rubin in the mid-1990s.  That protocol meant the White House would refrain from commenting on monetary policy, with the concept being that the less political pressure the Federal Reserve faced, the more confidence investors would have in the central bank maintaining anchored inflation expectations.  President Trump has been openly critical of monetary tightening.  So far, we have not seen political pundits frame monetary policy in a partisan fashion.  But, the risks of such events are rising.  If monetary policy actions are increasingly viewed through the parameters of partisan politics, we would expect the following market effects:

  1. Long-duration interest rates will rise. These rates are sensitive to inflation expectations.  Undermining Federal Reserve independence will tend to raise fears that policymakers won’t increase rates for fear of criticism, leading the central bank to tolerate higher inflation.
  2. The dollar will weaken. If the central bank won’t act against inflation impulses, then the attractiveness of the dollar will be diminished.
  3. Gold prices will rise. Gold will be seen as a store of value instrument, which will become more appealing in a rising inflation environment.
  4. Equity markets will suffer through falling multiples. Price/earnings multiples are partly a function of inflation expectations.  If prices are rising, earnings become suspect and investors lower the price at which they will purchase those earnings.

To date, there is no evidence that monetary policy has been affected by White House criticism.  However, that condition may not endure.  We continue to closely monitor developments but we will take appropriate action if the Federal Reserve finds its independence compromised. 

View the PDF


[1] See Weekly Geopolitical Reports, Reflections on Politics and Populism: Part I (7/16/18) and Part II (7/23/18); and European Populism (1/12/15).

[2] https://www.voanews.com/a/mixed-political-marriages-an-issue-on-rise/3705468.html

[3] https://thehill.com/homenews/administration/348014-threats-of-political-violence-rise-in-polarized-trump-era

Weekly Geopolitical Report – The Dollar Problem: Part II (October 8, 2018)

by Bill O’Grady

Last week, we introduced the characteristics of a reserve currency, including a discussion of the costs and benefits of providing the reserve currency.  This week, we will conclude the report with a short explanation of the S.W.I.F.T. network and its importance to international finance.  From there, we will discuss the potential competitors to the dollar as the reserve currency, examining the possibility of competing trade blocs.  As always, we will conclude with potential market ramifications.

View the full report


Asset Allocation Weekly (October 5, 2018)

by Asset Allocation Committee

As the unemployment rate declines, there is a worry that wage growth may accelerate and lead to a wage-price spiral, forcing the FOMC to raise rates rapidly.  Although possible, the key issue is slack in the labor market.  Based on the unemployment rate, there would appear to be little; based on the employment/population ratio, employers should still be able to find workers without having to raise wages to attract them.

This chart shows yearly wage growth for non-supervisory workers.  We forecast the results from two models of wages, one using the unemployment rate and the other using the employment/population ratio.  Until the latest recovery, both models worked reasonably well; however, in the current recovery, there is a significant divergence.  The model using the unemployment rate suggests wage growth should be closer to 4%.  Using the employment/population ratio, wages should be growing around 2.5%, which is about in line with actual wage growth.  This analysis would suggest there is probably more slack in the economy than the unemployment rate would indicate.

However, just because this pattern has been in place for several years doesn’t mean it will continue.  One potential signal that the labor market is “running short of workers” would be if the unemployment rate remains low while non-farm payroll growth slows.  To see if slowing payrolls occurs when the unemployment rate is low, we compared five periods since the 1950s when the unemployment rate was under 4.5% for an extended period.  We compared payrolls to their maximum to see if payrolls turn down while unemployment is low.

There were four periods in the past that met this criteria.

The 1950-53, the 1955-57 and the 1998-2001 periods all had payrolls decline from their maximum even with low unemployment.  However, it should also be noted that in all cases the unemployment rate began to rise as well.  In other words, a decline in payrolls doesn’t necessarily offer any better signal than simply watching the unemployment rate.  In the 1966-70 period, payrolls continued to rise even though the unemployment rate began to rise.   Of course, we have the current event, which still shows rising payrolls.

So, what does this mean for markets?  This analysis shows that slowing payrolls won’t necessarily offer a better signal for weakening labor markets than rising unemployment.  And, for now, the employment/population ratio is a superior measure of slack.  Based on this analysis, there is probably more room for additional increases in the labor force before wage growth accelerates.

View the PDF

Weekly Geopolitical Report – The Dollar Problem: Part I (October 1, 2018)

by Bill O’Grady

In May, the Trump administration exited the Joint Comprehensive Plan of Action (JCPOA), otherwise known as the Iran nuclear deal.[1]  In conjunction with its exit, the U.S. implemented new sanctions and the goal of U.S. policy is to reduce Iran’s oil exports to zero barrels by November.

The other parties in the agreement, China, Russia, the EU and Iran, are unhappy with the U.S. decision.  The EU is working to create a payment structure which will not use the U.S. financial system.[2]  The plan, which creates a special purpose vehicle that will process trade-related payments between Iran and the EU, could become an alternative to the S.W.I.F.T. network, the current system.  Although S.W.I.F.T. is headquartered in Europe, it is dominated by the U.S. financial system because of the dollar’s reserve currency role.

Because the U.S. has a tendency to implement financial sanctions against its perceived adversaries, there have been growing calls for an alternative to dollar-based trade.  It is not clear whether an alternative system would end up facing U.S. sanctions as some of its users will likely also use the American financial system.  Still, the concern about the U.S. “weaponizing” the dollar has raised the idea of a global reserve currency.

In Part I of this report, we will introduce the characteristics of a reserve currency, including a discussion of the costs and benefits of providing the reserve currency.  Part II will begin with a short explanation of the S.W.I.F.T. network and its importance to international finance.  From there, we will discuss the potential competitors to the dollar, examining the possibility of competing trade blocs.  As always, we will conclude with potential market ramifications.

View the full report


[1]https://www.nytimes.com/2018/05/08/world/middleeast/trump-iran-nuclear-deal.html

[2]https://www.washingtonpost.com/world/2018/09/26/yes-world-leaders-laughed-trump-theres-another-less-obvious-sign-diminishing-us-influence/?utm_term=.1012f272b77d