Asset Allocation Weekly (July 5, 2019)

by Asset Allocation Committee

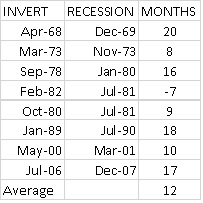
Although it’s not official,[1] it appears the current expansion has reached a new record.

(Source: NBER)

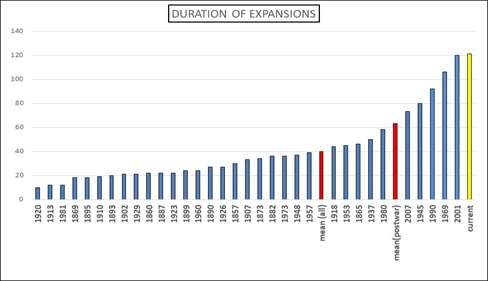
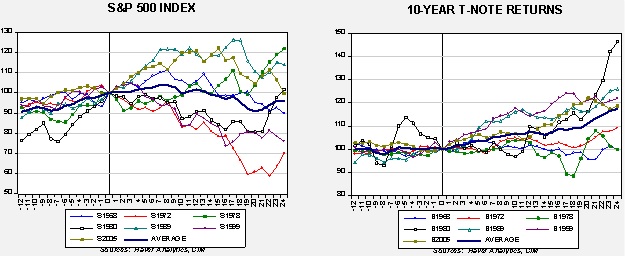
This chart shows expansions by months since 1850.  The current expansion just reached 121 months, exceeding the 1991-2001 expansion, which was previously the longest.

Part of the reason this expansion has lasted so long is because economic growth has been rather slow.

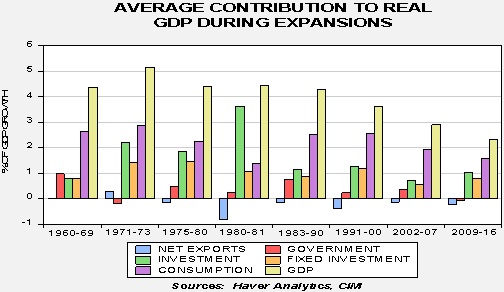
This chart shows the average GDP for expansions since 1960; we have also isolated the average contribution from the components of GDP.[2]  Not only has this expansion had the slowest average GDP growth, but two of the components, net exports and government, were negative contributors.  That had never happened over this time frame before.

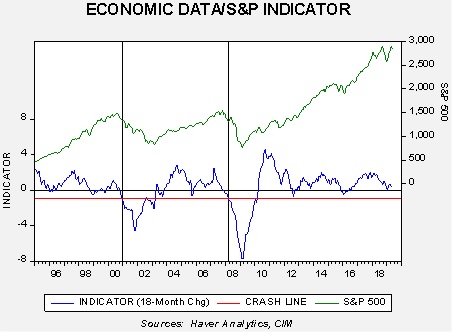
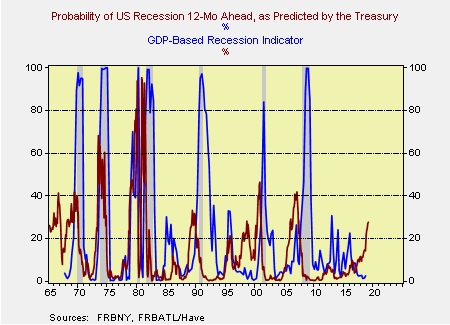
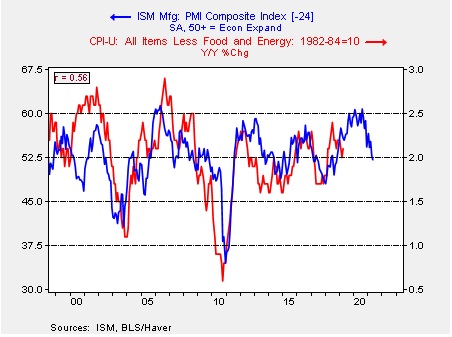
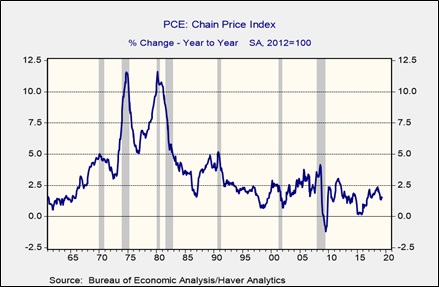
Because the expansion was slow, the bottlenecks that often develop in a long expansion have not become evident in this cycle.  Inflation remains tame, with the overall PCE deflator below 2.5%.  In previous recessions this measure of inflation had exceeded 2.5%, which would tend to trigger policy tightening.

Recessions are usually triggered by either policy tightening or a geopolitical event.  The former tends to occur when policymakers are facing rising inflation.  With current inflation tame, excessive tightening would be a major mistake.   The potential for a geopolitical risk is elevated at this time but not high enough to suggest a significant defensive position.

So, until inflation rises or a geopolitical event occurs, there is no reason that the current expansion can’t last longer.  And, as long as the expansion continues, equities should continue to perform relatively well. 

View the PDF


[1] The National Bureau of Economic Research, a private body, is the official arbiter of business cycles.  When it dates the onset of recession, it is usually months after the downturn has occurred.  Thus, it is possible (but not likely) that the group could determine that a recession began before July.  We won’t know for certain that the current expansion is the longest until the next recession starts.

[2] We break out fixed investment to eliminate the impact of inventories.  The actual calculation is GDP = Consumption + Investment + Government + Net Exports.

Asset Allocation Weekly (June 28, 2019)

by Asset Allocation Committee

Gold prices have been strong recently, supported by perceptions of easing monetary policy and oblique statements from the White House hinting at supporting a weaker dollar.  Lower interest rates and dollar weakness are generally bullish for gold prices.

Our coincident gold price model suggests the recent rally is merely “catching up” from an undervalued condition.

This model uses the balance sheets of the Federal Reserve and the European Central Bank, the EUR/USD exchange rate, the fiscal account as a percentage of GDP and the real two-year Treasury yield.  The model has been suggesting that gold was undervalued for the past two years.  The recent rally has closed the gap; however, as the dollar weakens and the central banks return to expanding their balance sheets, the model’s forecast will rise and support gold prices.

On a longer term basis, the unscaled level of the deficit does tend to suggest a favorable environment for gold.

This chart shows the Congressional Budget Office’s level of the deficit (on an inverted scale) and forecast to 2025.  The body is suggesting the deficit will worsen in the coming years which has tended to be supportive for gold prices.  Interestingly enough, the mere level has the biggest effect on prices compared to scaling the fiscal account to GDP.  Most likely, the level is easier for gold buyers to understand.

With inflation low and Modern Monetary Theory becoming popular, the likelihood of rising deficits is elevated.  A position in gold is one way investors can position for a secular trend in rising deficits.

View the PDF

Business Cycle Report (June 26, 2019)

by Thomas Wash

The business cycle has a major impact on financial markets; recessions usually accompany bear markets in equities.  We have created this report to keep our readers apprised of the potential for recession, which we plan to update on a monthly basis.  Although it isn’t the final word on our views about recession, it is part of our process in signaling the potential for a downturn.

Economic data released for May suggests the economy remains strong but is showing some signs of weakness. Currently, our diffusion index shows that 10 out of 11 indicators are in expansion territory, with several indicators approaching warning territory. The index currently sits at +0.818.[1]

The chart above shows the Confluence Diffusion Index. It uses a three-month moving average of 11 leading indicators to track the state of the business cycle. The red line signals when the business cycle is headed toward a contraction, while the blue line signals when the business cycle is headed toward a recovery. On average, the diffusion index provides about seven months of lead time for a contraction and three months for a recovery. Continue reading for a more in-depth understanding of how the indicators are performing.

View the complete PDF


[1] The diffusion index looks slightly different from last month due to adjustments we made to the formula and revisions in certain data sets.

Weekly Geopolitical Report – The Mid-Year Geopolitical Outlook (June 24, 2019)

by Bill O’Grady

(Due to the Independence Day holiday and a short summer hiatus, the next report will be published July 15.)

As is our custom, we update our geopolitical outlook for the remainder of the year as the first half comes to a close.  This report is less a series of predictions as it is a list of potential geopolitical issues that we believe will dominate the international landscape for the rest of the year.  It is not designed to be exhaustive; instead, it focuses on the “big picture” conditions that we believe will affect policy and markets going forward.  They are listed in order of importance.

Issue #1: Deglobalization

Issue #2: Election Meddling

Issue #3: Iran

Issue #4: China

View the full report

Asset Allocation Weekly (June 21, 2019)

by Asset Allocation Committee

In 2017, we introduced an indicator of the basic health of the economy and added it to the many charts we monitor to gauge market conditions.  The indicator is constructed using commodity prices, initial claims and consumer confidence.  The thesis behind this indicator is that these three components should offer a simple and clear picture of the economy; in other words, rising initial claims coupled with falling commodity prices and consumer confidence is a warning that a downturn may be imminent.  The opposite condition should support further economic recovery.  In this report, we will update the indicator with May data.

This chart shows the results of the indicator and the S&P 500 since 1995.  The updated chart shows that the economy did slip late last year but has recovered in 2019.  We have placed vertical lines at certain points when the indicator fell below zero.  It works fairly well as a signal that equities are turning lower, but there is a lag.  In other words, by the time this indicator suggests the economy is in trouble, the recession is likely near or already underway and the equity markets have already begun their decline.

To make the indicator more sensitive, we took the 18-month change and put the signal threshold at -1.0.  This provides an earlier bearish signal and also eliminates the false positives that the zero threshold generates.  Notwithstanding, we will pay close attention when the 18-month change approaches zero as it did in January.

What does the indicator say now?  The economy has decelerated but is not yet at a point where investors should become defensive.  Breaking below the red line would be our signal to expect a broader downturn.  Most likely, we are going through a period similar to what we experienced in 2016.  If this is the case, and the economic data begins to improve, then equities should remain supported into H2.

View the PDF

Weekly Geopolitical Report – War with Iran? (June 17, 2019)

by Bill O’Grady

Over the past year, U.S. relations with Iran have deteriorated.  In May 2018, President Trump announced he would withdraw from the Joint Comprehensive Plan of Action (JCPOA), a multinational treaty that was designed to slow, but not eliminate, Iran’s nuclear development.  As part of exiting the JCPOA, the U.S. reapplied sanctions that have reduced Iran’s oil exports.  Since the U.S. has taken this action, the Iranian economy has suffered, with inflation rising to dangerous levels.

This chart shows the yearly change in Iran’s CPI.  We have placed a vertical line at the point where the U.S. pulled out of the JCPOA.  Note that inflation has jumped from a yearly increase of 10% to over 50%.

Sanctions have dramatically reduced Iran’s oil exports, shown on the following chart.  Before the U.S. withdrawal, Iran was exporting around 2.5 mbpd of crude oil.  That number has declined to 0.3 mbpd.

(Source: Bloomberg)

Iran has been threatening to retaliate in the face of a weakening economy.  In a previous report last year, we examined potential responses by Iran.  These included restarting the nuclear program, projecting power into the Middle East, closing the Strait of Hormuz, deploying a cyberattack, building a coalition against the U.S. and renegotiating the JCPOA.

Some of the actions that Iran might take could escalate into a hot war with the U.S.  In this report, we will begin with an examination of the geography and geopolitics of Iran.  Using this information, we will discuss what a war with Iran might look like.  We will also reflect on the very nature of war and alternatives to the use of military force within the context of Iran.  As always, we will conclude with market ramifications.

View the full report

Asset Allocation Weekly (June 14, 2019)

by Asset Allocation Committee

Establishing when “the” yield curve inverts is a bit of guesswork as there are a plethora of permutations one can use to calculate the spread.  One yield curve we like is the same one the Conference Board uses in its index of Leading Economic Indicators, namely, the 10-year T-note less fed funds yield.  As we show below, this particular spread has inverted this month.  Because of the time it takes to fully accumulate all the data points in the leading indicators, the inverted yield curve won’t be in the index until August.  But, the inversion will start to act as a drag on the leading indicators and likely start signaling a slowdown in the economy.

Here is a chart of the 10-year/fed funds yield curve.

This spread didn’t become a reliable indicator of the economy until the 1960s.  It isn’t perfect; it has had two false positives (shown as a black lines on the above chart).  In the 1981-82 recession, the curve didn’t invert until the recession was underway.  We have shown the current inversion as a black line, but we will change this if, or when, the recession develops.

This table shows the time period from the inversion to recession.  Although there is variation, the average is 12 months.  Using the range, a recession would be due at the earliest in February 2020 or the latest at February 2021.

So, with inversion, what should investors do?

These two charts show equities (the S&P 500) and long-duration bonds (10-year T-notes total return index), indexed to the yield curve inversion (shown as a vertical line on the chart).  We looked at the data 12 months before the inversion and 24 months after the inversion, excluding the 1982 inversion since the recession was already underway.  We also calculated the average for the seven events.  These calculations show that the financial markets don’t always treat inversions as bearish.  Under low inflation conditions, long-duration interest rates tend to perform well.  Equities decline about 10% or less after inversion the majority of the time; however, in three cases, they actually continued to rise.  Furthermore, during the 2005 inversion, the real bear market didn’t start until two years after the yield curve turned negative.

There are two key issues for investors.  First, it is possible that the current inversion is a false positive.  If the FOMC moves quickly to cut the fed funds rate, the slope of the curve could return to positive so remaining fully invested is recommended.  Second, even if this inversion is a harbinger of recession, there were several events where equities performed quite well for some time after the inversion.  This is especially true when the inversion predated the recession by more than a year.  At the same time, investors are now on notice that if the Fed doesn’t react soon to unwind this inversion then the odds of recession are rising, thus it would be prudent to build a plan to become defensive.

View the PDF

Weekly Geopolitical Report – Reflections on Tiananmen (June 10, 2019)

by Bill O’Grady

Thirty years ago, on June 4, troops from the People’s Liberation Army (PLA) descended upon Tiananmen Square to forcibly remove protestors who had been using the space for about two months.  The protestors were agitating for democracy, an end to corruption and a more inclusive political system.

Details of the incident remain unsettled.  There are no doubts that hundreds of students were killed or injured.  Arrests were made.  But, the Communist Party of China (CPC) has studiously avoided publishing a full account of the Tiananmen Square events.

Since Western media has offered numerous accounts of the events on June 3-4, 1989, we are not going to present a history of the protests or the harsh reaction of the CPC leadership.  Instead, we will offer various insights into the aftermath of the event itself and how it affects policy and relations today.  As always, we will conclude with market ramifications.

View the full report

Asset Allocation Weekly (June 7, 2019)

by Asset Allocation Committee

Monetary policymakers are facing divergent trends that complicate future policy actions.

Financial markets are signaling that the policy rate needs to be cut immediately.

The chart on the left shows the implied three-month LIBOR rate, two-years deferred, from the Eurodollar futures market.  Last October, the implied rate was around 3.30%; it has fallen sharply to 1.625%, a decline of nearly 70 bps.  The chart on the right compares that implied rate to the fed funds target.  History shows the Fed has tended to cut the target rate when the implied rate inverts relative to the policy rate (shown on the upper line).  The spread has widened considerably, meaning the Fed should be moving to cut rates soon.  This data would suggest the longer policymakers wait, the higher the probability of a recession.

Current economic conditions probably don’t warrant a rate reduction.

This chart shows the NY FRB recession indicator, which projects the odds of recession 12 months out and the Atlanta FRB GDP-based recession indicator.  In general, combining the two indicators reduces the chance of a false positive, namely, predicting a recession that doesn’t occur.  We use the 20% threshold as a warning sign; if both indicators are above 20% then a recession warning is warranted.  The only false positive that was triggered with the 20% threshold was in 1995 and that event was considered a rare “soft landing.”  As the first chart shows, in 1995, the Greenspan Fed did cut rates and this action probably extended the expansion.  The current reading of these two indicators suggests caution, but the economic data is not signaling that a downturn is imminent.  And, as a cautionary tale, we had a similar configuration in the data in 1997-98.  The Fed did ease in that event, in part driven by the LTCM Crisis, and that easing is often blamed for stoking the tech bubble in 1999.

Inflation remains controlled, but tariffs could affect prices.

This chart compares the ISM Manufacturing Index to core CPI.  The ISM index tends to lead inflation by two years.  Comparing core CPI to the ISM Manufacturing Index suggests that inflation might lift in the coming months but should not overshoot by a wide margin.  However, it is important to note that tariffs are a form of consumption tax.  While the incidence of the tax does not automatically fall to the consumer (the producer or importer could absorb the cost, cutting profit margins, or the dollar could appreciate and offset the tariff), there is the possibility of an unexpected rise in inflation.

These three issues will likely keep the FOMC on hold in the near term.  If that analysis is correct, the chances of recession will tend to rise in the coming months.

View the PDF