

Asset Allocation Weekly (August 9, 2019)

by Asset Allocation Committee

Since the end of WWII, there have generally been three factors that have caused recessions.  The first, and most important, is policy error.  Although fiscal tightening can cause recessions, major tax increases have become less common.  The usual source of policy error comes from the monetary side, where the central bank either raises rates too high or doesn’t move quickly enough to lower rates when business conditions weaken.  The second cause comes from geopolitical events.  The 1973-75 recession was triggered by the Arab Oil Embargo, a direct result of U.S. aid to Israel during the Yom Kippur War.  The 1990-91 recession was due to the Persian Gulf War.  The third cause is due to inventory mismanagement.  The third reason has become rare due to improved logistics technology.  Although inventory issues can affect sectors of the economy, it hasn’t led to a national downturn since the 1950s.

As a result, currently, there are two factors we watch most closely to predict recessions, monetary policy and geopolitical issues.  Although predicting recessions is difficult, at least with monetary policy, there are consistent indicators, such as yield curves, financial stress indexes, volatility indexes, Phillips Curve measures, etc.  Obviously, timing is difficult, even when the indicators flash warning signs, but at least there are fairly consistent indicators one can monitor.

Geopolitical indicators are far more idiosyncratic.  Global tensions are constant.  There are always geopolitical tensions so it is hard to parse the signal from the noise.  To some extent, this is always a problem with geopolitics.  It’s not that there is a lack of situations that could develop into a threat to the business cycle; it’s just that most don’t.

Perhaps a better way to think about geopolitics and theor impact comes from the book, Ubiquity: Why Catastrophes Happen.[1] In this book, Mark Buchanan makes the case that geopolitical events are much like sandpiles where grains rise steadily, making the structure increasingly unstable.  A final grain triggers a collapse and, due to the post hoc, egro propter hoc fallacy, that last “grain” becomes the “cause” of the collapse.  In reality, the structure had been losing stability for some time and the triggering event may not have led to the catastrophe under conditions of stability.

For example, the Persian Gulf War occurred mostly because Saddam Hussein miscalculated the reaction of the world to his invasion of Kuwait.  He probably would not have invaded Kuwait if the Kuwaitis had been willing to reduce production to allow Iraq to have a greater market share of world oil markets, something that Iraq felt it was owed from the Persian Gulf states due to its prosecution of the war against Iran.  In addition, if the Soviet Union hadn’t collapsed, Moscow would have probably not supported the invasion by its client state.  The trigger to the war, the reports that Kuwait was using horizontal drilling to tap Iraq’s oil fields, was the proximate cause of the war.  But, the mere act of taking the oil may not, by itself, have triggered the invasion without the other factors in play.

The current trade conflict with China has similar complicated characteristics.  The U.S. has been struggling to develop a consistent foreign policy since the end of the Cold War.  Policy toward China has mostly been to support its economic development on the idea that the richer it becomes, the more likely that it will democratize, following the path of other Asian nations.  Unlike Japan, South Korea and Taiwan, however, China was not as reliant on American security.  Those nations were directly protected by the U.S., whereas China only relied on America’s sea lane security.  In addition, China viewed its commitment to communism as something to be maintained.  The construct of the Trans-Pacific Partnership, which was designed to isolate China, showed that the U.S. was rethinking its relationship with China by 2008.

Under President Trump, the relationship with China has become increasingly contentious.  The application of tariffs and continued negotiations have caused increasing equity market turmoil.  Nevertheless, so far, the impact on the economy has been less dramatic.  However, we may be reaching the point where the trade conflict will begin to affect the economy.  The most recent decision by the Trump administration to apply 10% tariffs on $300 bn of imports, by itself, is probably not enough to trigger a downturn.  But, the culmination of earlier tariffs and the impact to technology restrictions may be creating conditions that lead to recession.

History suggests that recessions induced by geopolitical events are difficult to avoid even with stimulative economic policies.  The unknown is whether we are near a point where geopolitical risks are great enough to trigger a downturn.   At this point, we are probably not at that level but risks are escalating and the odds of a geopolitical mistake are rising.  Although it is probably too soon to position portfolios in a defensive manner, tactical planning is in order.

View the PDF


[1] Buchanan, Mark. (2000). Ubiquity: Why Catastrophes Happen. New York, NY: Three Rivers Press.
Weekly Geopolitical Report – Turkey Lashing Out (August 5, 2019)

by Patrick Fearon-Hernandez, CFA

Here at Confluence, we write a lot about the rise and fall of hegemonic states – those great nations that develop enough power and influence to dominate the global economy, or at least some region of it.  These superpowers use their extraordinary military might and other levers to impose order on their sphere of influence, providing the security necessary for international trade.  They also provide the reserve currency that acts as a common medium of exchange for that trade.  These hegemons therefore provide the foundation on which a global or regional economy can function.

During the Cold War, the United States accepted leadership of the Free World and acted as hegemon for the non-communist bloc.  After the disintegration of the Soviet Union and the demise of Soviet-style communism in 1991, the United States became a global hegemon.  What is now less appreciated is that the burdens of hegemony and the demise of Soviet communism have eroded the willingness of U.S. citizens to maintain their country’s leading role in the world.  At the same time, the removal of the Soviet threat has encouraged other nations to once again assert their own interests and the freedom of action they sacrificed to come under U.S. protection during the Cold War.  This week’s report looks at one of the best examples of that dynamic, the recent discord between Turkey and the United States, which has culminated in Turkey’s defiant purchase of a Russian air-defense system.  We will review Turkey’s political dynamics and why its president, Recep Erdogan, has implemented a more assertive foreign policy that is putting the country at odds with the United States and the West, in general.  As always, we conclude with a discussion of the resulting market implications.

View the full report

Asset Allocation Weekly (August 2, 2019)

by Asset Allocation Committee

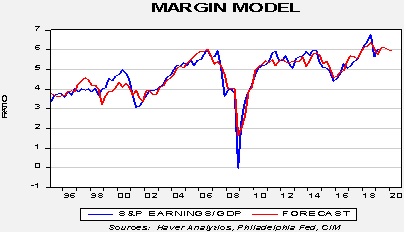
As wages and other costs rise and pricing power appears constrained, there are reasonable worries about the path of corporate earnings.  We use purely top-down analysis to forecast earnings.  Essentially, we forecast the percentage of total S&P company earnings relative to GDP.  We use the nominal GDP forecast from the Philadelphia FRB’s Survey of Economists along with our earnings as a percentage of GDP forecast to arrive at our estimate; we do note that this estimate is for total earnings for all members of the S&P 500 and not the per share estimate.

We are currently expecting S&P earnings to equal around 6% of GDP.

There are a large number of components in the model but the most statistically significant are net exports as a percentage of GDP, credit spreads, the dollar and oil prices.  The components suggest that margins will likely contract if the U.S. does move to reduce the trade deficit.  A weaker dollar will help lift margins, and higher oil prices will tend to lift margins as well.  Narrow credit spreads tend to support margins.

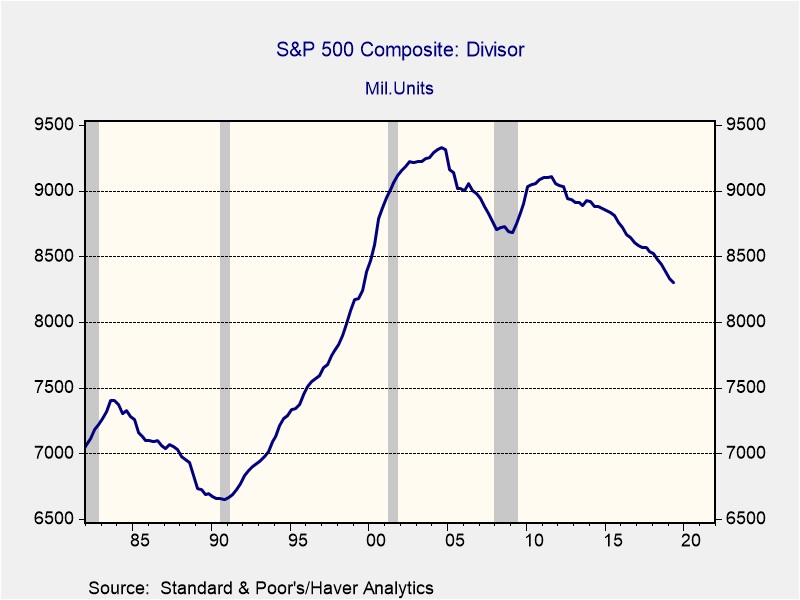
The process of getting to earnings per share is tied to the divisor of the index.  And, that has been steadily falling, which is lifting earnings per share.

The divisor adjusts the index by accounting for mergers, the exchange of new companies into the index, and share issuance and buybacks.  The persistence of share buybacks is clearly reducing the divisor which acts to boost earnings per share.

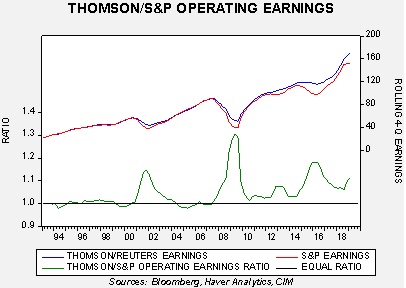
Adjusting for all these factors, our current forecast for earnings this year is $157.20, which is down from $160.93 at the beginning of the year.  We do use Standard and Poor’s earnings data, which tends to be less than the more widely reported data from Thomson-Reuters; we use the former because we have a much longer history of that data.  The current difference is significant.  Thomson-Reuters data is about 11% higher than what is reported by Standard and Poor’s.

Our conversion model suggests a Thomson-Reuters earnings number of $168.92, which is well above the current consensus of $165.21.  Given that we are working off a 3.8% nominal GDP growth rate (and so, 2% inflation would lead to a 1.8% GDP growth number), which seems achievable, the financial markets are probably too pessimistic on earnings for the rest of the year.  If we are wrong, it’s probably due to margin contraction.  Although there are worries about future policy causing margins to fall, the policy effect probably occurs next year, not in 2019.

View the PDF

Weekly Geopolitical Report – The Economic Triangle: Part II (July 29, 2019)

by Bill O’Grady

The Economic Triangle: Part II

 Last week, we referenced the basic philosophies of David Hume and Adam Smith and how their writings evolved into the economic theory of supply and demand.  From there, we examined the weakness of supply and demand at the macro level and discussed an alternative model, the Economic Triangle, as a different means of explaining how various economic participants operate and the way in which political factors affect the triangle.  This week, we will show how the Economic Triangle fits into the major economic systems, offer two contemporary examples and conclude with market ramifications.

The Theories
The history of economic thought and political economics has generated a plethora of theories and paradigms for balancing these interests.  Here are some of the important ones:

View the full report

Asset Allocation Weekly (July 26, 2019)

by Asset Allocation Committee

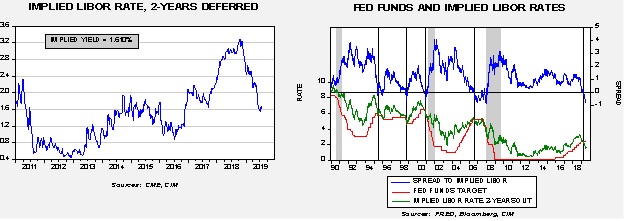
How much attention is the FOMC paying to international factors?  It appears to be quite a lot.  We have documented that the financial markets are clamoring for a rate cut.  We have seen some of the more popular yield curves invert and the implied LIBOR rate from the Eurodollar futures market, two years deferred, has moved into easing territory.

The chart on the left shows the aforementioned implied LIBOR rate.  In Q3 last year, the implied rate was 3.30%; it has fallen to just above 1.60%, a decline of 170 bps.  The chart on the right compares the implied rate to the fed funds target.  When this implied rate falls below the target, it is a signal to policymakers that monetary policy is too tight.  The Bernanke Fed mostly ignored this indicator, unlike his predecessor, and Bernanke had to deal with the deep 2007-09 recession.  This indicator is giving clear evidence that the Fed should be cutting rates aggressively.

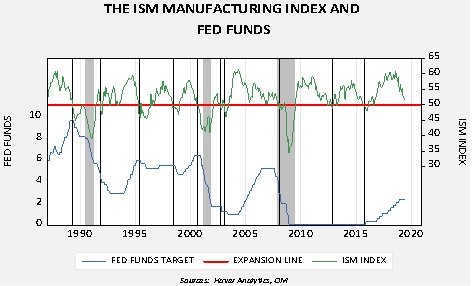
However, the signals from the domestic economy are not supporting a rate cut.  The ISM Manufacturing Index is well above 50; since the Federal Reserve began confirming the policy rate, it is rare to see rate cuts when the index is above 50.

We have indicated when the ISM index falls below the 50-expansion line with vertical lines.  The only time we saw significant rate cuts without the ISM index below 50 was in 2007, when financial markets were under clear stress.  In May 2007, the Chicago FRB National Financial Conditions Index, an index of financial stress, was reading -0.67.[1]  By August, it had risen to -0.13 and turned positive in November.

In this cycle, international pressures seem to be guiding policymakers to act.

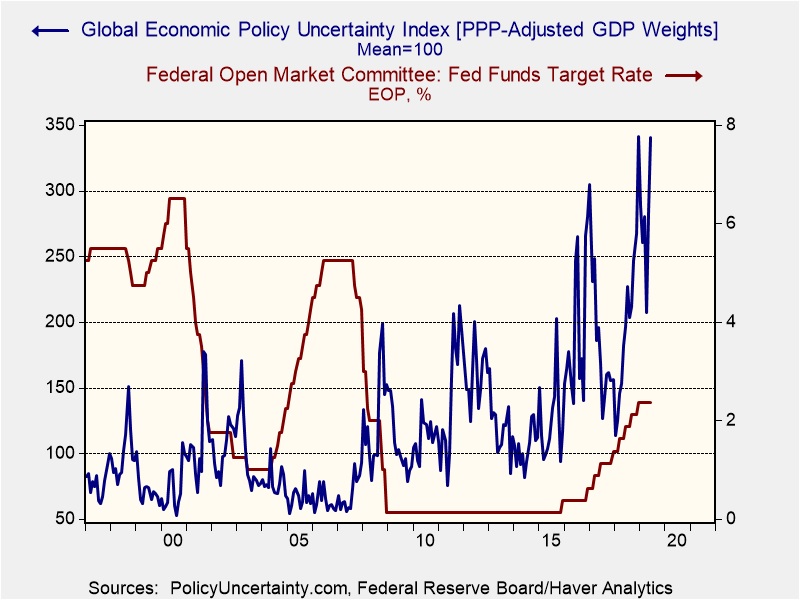
This chart shows the fed funds target with the Global Economic Policy Index.  This index measures mentions of economic or policy uncertainty in 20 nations; the index is weighted by GDP, adjusted for purchase power parity.  A rising reading suggests increases in policy uncertainty.  This chart supports Chair Powell’s continued references to overseas issues when calling for easing.

To some extent, there is a worry among market participants that the Fed is simply creating a narrative to allow it to ease, reducing pressure from the White House while maintaining some element of independence.  The third chart suggests the Fed does have good reasons for acting to lower rates.  With trade wars, the immigration crisis in Europe and the U.S., the potential for conflict in the Middle East and worries about a currency war, the level of global policy uncertainty is historically elevated.  This factor, we believe, reflected in the financial markets, is what is prompting the desire to cut rates.  We do expect a significant level of dissent among FOMC voters but, in the end, we look for two rate cuts this year, unless global stress levels unexpectedly diminish.

View the PDF


[1] A reading under zero suggests low levels of stress.

Business Cycle Report (July 24, 2019)

by Thomas Wash

The business cycle has a major impact on financial markets; recessions usually accompany bear markets in equities.  We have created this report to keep our readers apprised of the potential for recession, which we plan to update on a monthly basis.  Although it isn’t the final word on our views about recession, it is part of our process in signaling the potential for a downturn.

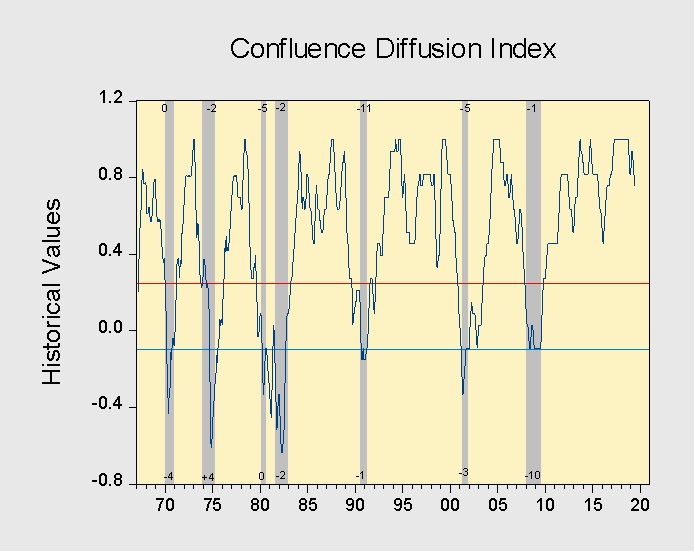
Economic data released for June suggests the economy remains strong but is showing some signs of weakness. Currently, our diffusion index shows that 9 out of 11 indicators are in expansion territory, with several indicators approaching warning territory. The index currently sits at +0.757.[1]


The chart above shows the Confluence Diffusion Index. It uses a three-month moving average of 11 leading indicators to track the state of the business cycle. The red line signals when the business cycle is headed toward a contraction, while the blue line signals when the business cycle is headed toward a recovery. On average, the diffusion index provides about four months of lead time for a contraction and two months of lag time for a recovery. Continue reading for a more in-depth understanding of how the indicators are performing.

View the complete PDF


[1] The diffusion index looks slightly different from last month due to adjustments we made to the formula and revisions in certain data sets.

Keller Quarterly (July 2019)

Letter to Investors

I’m writing to you at the end of a week in which the Dow Jones Industrial Average crossed 27,000 for the first time ever and in which the S&P 500 crossed 3,000 for the first time ever.  There’s something about these market averages reaching “all-time highs” that increases fears in the hearts of investors.  Now, this isn’t necessarily a bad thing.  After all, the formula for successful investing is not just buying low, but selling high.  By the way, many investors seem to get those activities confused, particularly when they let their emotions get the best of them and “run with the herd.”  Emotional investing inevitably leads to buying high and selling low.  So, there’s a sense in which it’s nice to find someone leaning the right way when prices are high.

I’d like to point out, however, that high prices don’t necessarily equate to high valuations.  Years ago, I read a piece by Warren Buffett that made this clear to me.  On this subject of all-time high prices, he noted that a passbook savings account, where the interest is compounded daily, hits an all-time high price every day!  No one would argue that this savings account is over-valued; it is simply growing on plan.  Over the long-term, that is exactly what the U.S. stock market does, albeit with more volatility.  As the U.S. economy grows over the decades, and the profits of American businesses grow with it, the market prices of U.S. stocks should regularly hit all-time highs.  The year-to-year irregularities of profit-growth, combined with the ebbing and flowing of investor sentiment, mean that the all-time highs don’t occur daily, as with your savings account, but we shouldn’t be shocked when they periodically occur.

In the past I’ve referred to Oscar Wilde’s famous saying that, “A cynic is a man who knows the price of everything, and the value of nothing.” Knowing the price is easy: it’s reported every day!  Thus, journalists write stories about the S&P 500 crossing 3,000.  Everyone with a smartphone knows when it happens.  But not nearly as many stories are written about the value of the S&P 500, as to whether at 3,000 it’s over-valued, fairly valued, or under-valued.  Your smartphone can’t tell you that.  Knowing the value of anything (stocks, bonds, real estate, artwork, etc.) requires diligent study into both the nature of the item to be valued and the market for it.  When studying the market for an item, one must study both the prevailing market and the historical market.  This is the hard stuff of investing.

So, you may ask, is the S&P 500 overvalued at 3,000?  In our opinion, no, it’s fairly priced.  As we noted in our January letter, we thought the fourth quarter 2018 sell-off had reduced the market to prices that reflected excess pessimism about the future of profits, and therefore represented a buying opportunity.  Thus, it was under-valued.  By our April letter, that discount had been erased by a strong first quarter rally, taking the market averages back to where they had been the previous September.  We thought then that stocks were fairly valued. Three months later, the S&P 500 is now just 3.5% higher than it was in April.  Relative to expected earnings, dividends, the economic climate, and the interest rate environment, we continue to think the market averages are fairly valued.  They’re not “dirt-cheap,” but they’re not “over-priced” either.  This is where stock market valuations usually dwell, where the short-term upside opportunity and downside risk are in balance.  This is why we at Confluence don’t play a short-term game.  For short-term investors, the risk and return structure usually offers difficult odds.

We much prefer the long-term game.  The only way to enjoy the long-term compounding effect of the U.S. economy, as described above, is to take a long-term perspective of investing; the odds in this game are much better.  And you may enjoy the all-time highs.

We appreciate your confidence in us.


Gratefully,

Mark A. Keller, CFA
CEO and Chief Investment Officer

View the PDF

Weekly Geopolitical Report – The Economic Triangle: Part I (July 22, 2019)

by Bill O’Grady

In mid-August 2016, I published a two-part series titled “Thinking about Thinking” (see Part I and II).  Occasionally, I will be asked which WGR is my favorite or most important.  I generally refer readers to the aforementioned reports.

One facet of that report is the three statements of knowledge—a priori analytic statements, a posteriori synthetic statements and a priori synthetic statements.  The first are logic statements, where the subject is contained in the predicate.  These statements are always true but generally trivial, essentially tautologies.  To say “all unmarried men are bachelors” is true if one defines all bachelors as unmarried men.  The second type of statements are inductive in nature.  We observe the world and draw generalized conclusions about it.  Such statements are always conditional.  The concept of such statements was well described by Nicholas Taleb in The Black Swan.[1]  Ornithologists in Europe suggested that black swans didn’t exist because no one had ever seen one.  Then, someone from Europe traveled to Australia and, lo and behold, black swans exist.  A posteriori statements are true only until contrary evidence is found.  Since science is built on induction, the notion of “settled science” is faulty; what we know from science is true based only on what we know now.  But, if contrary evidence emerges, concepts based on induction must adjust.

The real battleground in philosophy are a priori synthetic statements.  These are essentially “self-evident truths” that we believe to be true in all cases and are not derived from experience.  The skeptical Scottish philosopher David Hume argued that a priori synthetic statements were not possible.  Instead, he suggested that such statements were based on experience and thus a posteriori.  Emmanuel Kant tried to rescue a priori synthetic statements by suggesting that humans were born with the ability to impose patterns of thinking on the world.  In other words, we don’t actually perceive the world directly but we do so through the filter of one’s mind.  This filter essentially impresses our views on reality and allows us to make a priori synthetic statements.

Although Kant’s attempt to “save” a priori synthetic statements has generally thought to have failed, there is an insight from Kant’s thought that is useful.  Essentially, people tend to think in paradigms.  In other words, we adopt a certain worldview or narrative for how things work and then impose them on reality.  The problem is, of course, that our worldview or paradigm may not be true.  In fact, almost by design, paradigms of reality are mere models and thus will be incomplete.  At the same time, the paradigms we adopt shape how we interpret the world.  Thus, it makes sense that we understand the models that we adopt to be aware of their strengths and weaknesses.

In this report, we will examine supply and demand as a model of markets and suggest that at the macro level a different model, the “Economic Triangle,” might offer better insights into how the political economy actually operates.  We will discuss how the Economic Triangle explains the way various economic participants operate and how political factors affect the triangle.  Next week, we will show how the Economic Triangle fits into the major economic systems, offer two contemporary examples, and conclude with market ramifications.

View the full report


[1] Taleb, Nassim Nicholas. (2007). The Black Swan: The Impact of the Highly Improbable. New York, NY: Random House.

Asset Allocation Weekly (July 19, 2019)

by Asset Allocation Committee

In his last testimony to Congress, Chair Powell agreed with Representative Ocasio-Cortez (D-NY) that the relationship between unemployment and inflation appears to have been broken.  This relationship, usually referred to as the Phillips Curve, suggests there is an inverse relationship between the two variables.  If one desires low inflation, then the tradeoff is higher unemployment.

The Phillips Curve has a controversial history.  There is nothing in economic theory that necessarily supports the tradeoff.  In fact, in its original construction by the economist A.W.H. Phillips, the relationship was between wages and unemployment and was developed by observation.  On the one hand, the relationship makes intuitive sense.  The unemployment rate should offer some insight into the supply/demand balance for labor and it would be reasonable to expect that the relative scarcity of labor should increase wages.  Economists then took the next step and assumed that rising wages would lead to higher price levels.  There are periods when the relationship between prices and unemployment is stable.  But, history shows the relationship is far from consistent.

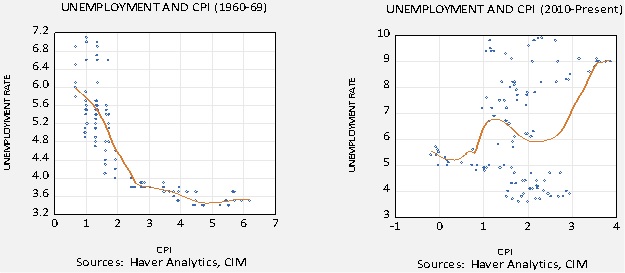
Both charts are scatterplots of the unemployment rate and the yearly change in CPI.  The chart on the left shows the relationship from 1960 through 1969.  It exhibits what the theory suggests—declines in unemployment are consistent with higher inflation.  It also suggests a non-linear relationship, in that when the unemployment rate declines below a certain point then inflation tends to rise quickly with little improvement in the labor markets.  This chart was part of the development of the theory of the “natural unemployment rate,” which suggested there was a long-term unemployment rate and falling below that rate would lead to sharply higher prices, thus limiting the impact of policy.

The chart on the right suggests something quite different.  In the data since 2010, the relationship is positive, meaning that higher levels of prices are consistent with high unemployment.  Although that relationship is due, in part, to the distortions caused by the Great Financial Crisis, the fact that the curve slopes upward does suggest the relationship between price levels and unemployment may be sensitive to other factors.

It is no great secret that the relationship between unemployment and price levels is inconsistent.  So, in light of this problem, why has the Federal Reserve clung to the Phillips Curve in policymaking?  As the linked article above notes, Chair Powell appears to have given up on the relationship but others on the FOMC have not.  We suspect the Phillips Curve served an important narrative for the Federal Reserve tied to its dual mandate.  The Fed is expected to execute monetary policy that yields stable prices and full employment.  The Phillips Curve made it clear that this mandate had a tradeoff; if the Fed delivered low unemployment, there was an inherent risk of rising price levels.  The belief in the Phillips Curve allowed the Fed to avoid policies that brought very low unemployment that might risk higher price levels.

For the Federal Reserve, the Phillips Curve was a useful theory even if it wasn’t always consistent.  But, if there is a belief that the Phillips Curve doesn’t work anymore, then one could see Congress demanding ever lower levels of unemployment.  If the theory really doesn’t hold, there is no risk of inflation coming from falling unemployment.  However, there may be other issues.  For example, very low interest rates could distort financial markets.  It could lead to malinvestment in the economy.  Perhaps the most potent problem is that terms such as “stable prices” and “full employment” are not fully defined.  Former Fed Chair Allen Greenspan defined stable prices as inflation that is low enough to where consumers and firms do not take inflation into account when making investment and purchase decisions.  Although workable, Greenspan’s definition is clearly ad hoc.  It is arguable that any level of inflation is inappropriate.  Defining full employment has been difficult as well.  Part of the Phillips Curve theory is the concept of Non-Accelerating Inflation Rate of Unemployment (NAIRU), which suggests there is a minimum rate of unemployment consistent with steady prices.  Policymakers have used NAIRU as a proxy for full employment, even though it changes over time.  Most elected members of Congress would describe full employment as every likely voter in their district or state has a job if they want one.

The problem for the Fed is that if the Phillips Curve is jettisoned, there could be a focus on the unemployment rate of the mandate and the inflation mandate could become secondary.   After all, if inflation isn’t affected by the unemployment rate, the political class would generally want a rate as close to zero as possible.  Since inflation is affected by the degree of deregulation and globalization, it may be possible that inflation will remain low even at historically low levels of unemployment.  Unfortunately, it is also possible that the Phillips Curve relationship has become dormant for a myriad of reasons, including the aforementioned globalization and deregulation policies, demographics, and custom.  One observation we have noted is that the level of service seems to decline when the unemployment rate falls significantly.  Businesses note that they don’t have much pricing power and, in the face of rising wages, firms may opt to simply deliver less in terms of normal service.  In other words, hotel rooms may not be available at check-in time due to the lack of housekeeping staff or tables in restaurants may not be bussed as quickly due to the lack of entry level staff.  Such deterioration is not technically “inflation” but can occur in response to factors that otherwise would trigger rising price levels.

In the end, the Fed may find itself without an adequate response to Congress when it demands ever lower levels of unemployment.  The Phillips Curve was useful for the FOMC to avoid being forced into extreme policy positions.  Without the Phillips Curve, there is the potential that the Fed will be forced to engage in persistently accommodative monetary policy, with outcomes that could either lead to inflation or significantly distorted financial markets.

View the PDF