

Tag: dollar
Asset Allocation Bi-Weekly – #139 “US Capital Flight and the Implications for Investors” (Posted 5/5/25)
Asset Allocation Bi-Weekly – US Capital Flight and the Implications for Investors (May 5, 2025)
by Patrick Fearon-Hernandez, CFA | PDF
Oh, what a difference one calendar quarter can make! Shortly after Donald Trump was sworn in to his second term as president of the United States, we wrote that the US seemed to enjoy exceptional advantages versus the rest of the world in terms of its economic growth, political stability, and stock market returns. Other economists and market commentators echoed those views. However, just three months into Trump’s new term, many investors seem to be losing confidence in the US’s economic growth and management. As we discuss in this report, the evidence pointing in that direction includes a rise in the yields on US Treasury obligations, a depreciating dollar, and surging gold prices. Below, we discuss these trends and what they may mean for world financial markets going forward.
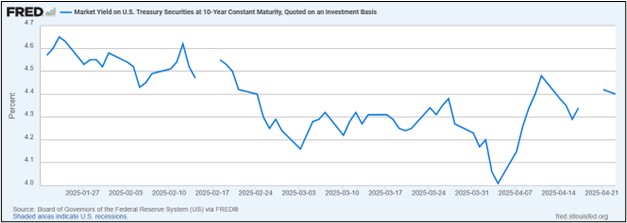
Reduced Bond Buying / Rising Bond Yields. As shown in the chart on the next page, the yield on the benchmark 10-year Treasury note stood at 4.57% on the first business day after Trump’s inauguration in January. Investors continued to scoop up Treasurys in the weeks following the ceremony, driven by expectations of slower economic growth, easing inflation pressures, and further interest rate cuts by the Federal Reserve. As the administration revealed more about its tariff plans and other aspects of economic policy, growing concerns about the US economy pushed 10-year Treasury yields as low as 4.01% in early April. Since then, however, Treasurys have sold off sharply. Importantly, it appears that foreign institutions in Japan and elsewhere have been a big part of the sell-off. In any case, 10-year Treasury yields have spiked to more than 4.40% since mid-April. The yield on 30-year Treasurys has spiked to as high as 4.91%.
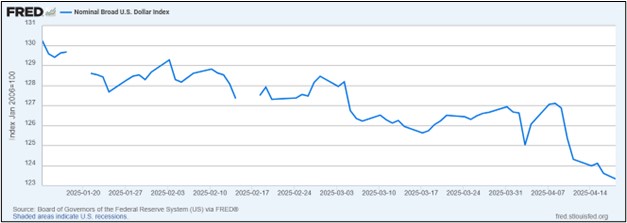
A Depreciating Dollar. Just as US Treasurys have sold off, the dollar has depreciated against many key currencies. The chart below shows the Fed’s nominal US Dollar Index, which tracks the value of the greenback against a broad range of foreign currencies. The broad index shows the dollar has lost about 4.10% of its value since Inauguration Day, with an especially sharp drop since Trump announced the pause in his “reciprocal” tariffs on April 9. The dollar has especially fallen sharply against developed country currencies, such as the euro.
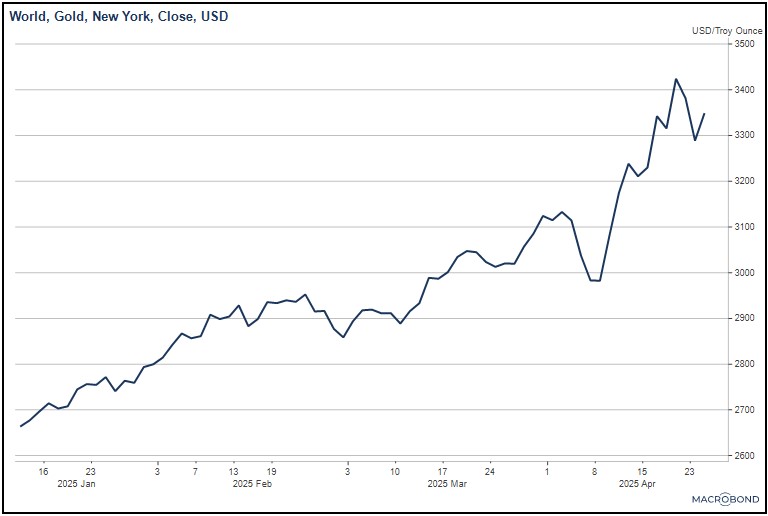
Rising Gold Prices. Rising bond yields and a falling dollar point to falling confidence in the US among global investors, so it should be no surprise that gold — the quintessential safe haven — has appreciated sharply. As shown in the next chart, gold prices have even reached a record high above $3,400 per ounce, with much of the increase coming since early April.
Of course, many long-term investors have been more focused on the recent volatility in US risk assets, especially stocks. In our view, the unique combination of market forces described above may be the more important underlying story. The rise in US bond yields, the decline in the dollar, and the surge in gold represent a rare alignment of market trends that may indicate some measure of capital flight from the US. This pattern of market moves suggests that global and even some domestic investors are trying to cut their exposure to US assets and the dollar. The likely culprit is the administration’s effort to rapidly and fundamentally change the US economic relationship with the rest of the world. As long as that endeavor continues, and investors are unsure of where the to-and-fro of policymaking will take them, these trends are likely to remain in place. Therefore, over the coming months and quarters, the most attractive assets may be much different than what we and other observers had expected at the start of the year. In particular, any continued US capital flight is likely to favor foreign equities, foreign currencies, and gold in the near term.
Don’t miss our accompanying podcasts, available on our website and most podcast platforms: Apple | Spotify
Asset Allocation Bi-Weekly – From Magnificent 7 to European Revival (April 14, 2025)
by Thomas Wash | PDF
European equities have long suffered from investor skepticism and been burdened by perceptions of excessive regulation, bureaucratic inertia, and elevated operating costs. These structural challenges have historically overshadowed the region’s fundamental strengths. Yet 2025 has marked a striking reversal, with European stocks delivering exceptional returns that have handily surpassed US market performance.
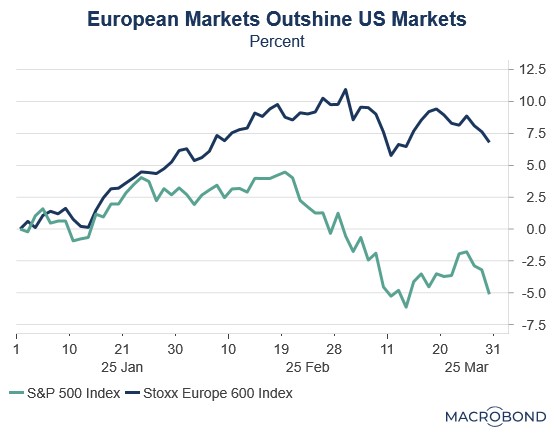
Much of Europe’s recent outperformance relative to the US can be traced to the unwinding of the “Trump trade,” which began in the weeks following Donald Trump’s victory in the November 2024 election. During this time, markets seemed to embrace the narrative that his policies — deep tax cuts, aggressive deregulation, and a pro-growth agenda — would cement US economic dominance. While tariffs were always a part of the equation, investors initially expected them to be used selectively rather than aggressively.
While US equities surged after the November election, European stocks languished as investors anticipated a widening growth divide. The eurozone has now gone seven consecutive quarters without achieving 2% annualized growth in its gross domestic product, a streak dating back to the third quarter of 2022. Nowhere were these struggles more apparent than in Germany, where the industrial sector — traditionally the Continent’s economic powerhouse — became its biggest drag.
Market expectations shifted abruptly in the Trump administration’s early weeks as it simultaneously challenged existing trade arrangements and demanded greater military spending from allies. The tariff threats created immediate uncertainty as businesses shelved investment plans and consumers braced for inflationary pressures. Meanwhile, growing doubts about US security commitments prompted EU leaders to accelerate plans for strategic autonomy.
We think the rotation from US to European equities was primarily valuation-driven, with the US’s once-dominant Magnificent 7 declining as investors shifted from growth to value. This marked a dramatic reversal from previous years when tech-heavy growth stocks consistently outperformed. European markets, with their heavier weighting in value sectors and more attractive price-to-earnings ratios, became natural beneficiaries of this change in investor preference.
While capital rotation remains modest to date, escalating trade tensions may accelerate foreign divestment from US assets in favor of European markets. These geopolitical strains have triggered a broad risk-off shift among investors, with capital flowing toward value assets rather than growth equities. This reallocation reflects a fundamental reassessment of global trade dynamics as nations increasingly recognize that traditional US trade relationships may be changing for good.
This shifting sentiment marks a potential inflection point after years of sustained US equity outperformance. For decades, global investors have disproportionately favored US markets, having been lured by three key advantages: (1) superior growth prospects, particularly in the technology sector; (2) unrivaled market depth and liquidity; and (3) the structural strength of the dollar. These factors became particularly pronounced in the post-pandemic era when the greenback’s appreciation created an additional return tailwind for foreign investors.
In an especially important development during this period, the US began running deficits in both its trade balance and its “primary income” balance. This twin deficit was problematic because it signaled that foreign investors were earning higher returns on their US investments than what US residents were earning abroad. In other words, the US was not only importing more than it exported but also paying out more in interest and dividends to the rest of the world than it was receiving.
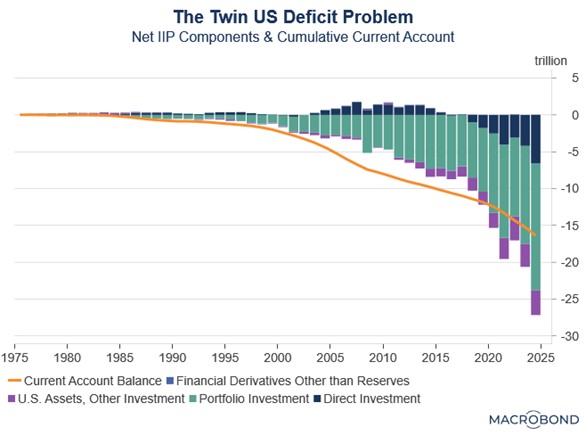
The growing imbalance stemmed from two key factors: persistent US equity outperformance relative to global markets and the Fed’s rate hikes that made Treasurys more attractive to foreign investors. These forces converged in the Net International Investment Position, resulting in the value of foreign-held US assets eclipsing America’s cumulative trade deficit for the first time ever. The shift reflected both a reversal from direct investment surplus to deficit and rising portfolio investment values — twin manifestations of superior US asset returns.
Typically, such conditions would prove problematic for most economies as they could trigger disproportionate currency outflows and subsequent depreciation or make its markets vulnerable to panics. However, the US dollar’s unique status as the global reserve currency and its deep and open capital markets have largely shielded it from these adverse effects.
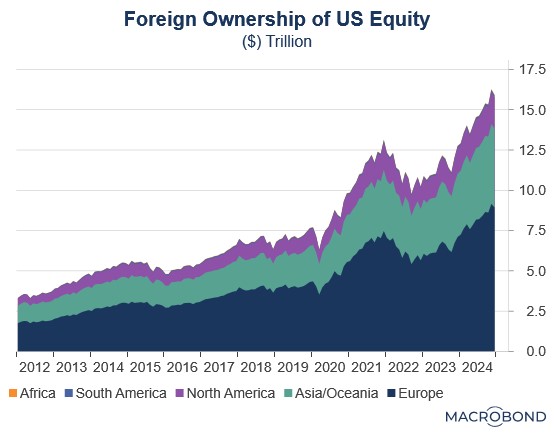
Nevertheless, significant risks remain. US equity markets could experience heightened volatility should foreign investor sentiment deteriorate, with the technology sector being particularly vulnerable due to its elevated valuations. The scale of this exposure is evident in foreign holdings, which now compose over 30% of US equities, driven by a dramatic surge in both portfolio income and direct investment flows.
A sudden erosion of confidence in US equities could precipitate a significant capital rotation into foreign equities and gold. Europe appears particularly well-positioned to benefit from this shift, owing to its relative valuation discount and potential for capital repatriation flows. Within the region, Germany stands out as especially attractive given its increased defense spending commitments. Meanwhile, gold could emerge as the safe-haven asset of choice, with the potential to displace US Treasurys as a reserve asset over time.
Don’t miss our accompanying podcasts, available on our website and most podcast platforms: Apple | Spotify
Asset Allocation Bi-Weekly – #138 “From Magnificent 7 to European Revival” (Posted 4/14/25)
Bi-Weekly Geopolitical Podcast – #52 “Prospects for the Dollar in a Fracturing World” (Posted 9/9/24)
Bi-Weekly Geopolitical Report – Prospects for the Dollar in a Fracturing World (September 9, 2024)
by Patrick Fearon-Hernandez, CFA | PDF
As investment managers and strategists, we are often asked by clients about our outlook for the United States dollar. Very often, our clients have heard some worrisome news about a rival currency becoming more attractive than the greenback or global investors selling off the dollar because of economic or political problems in the US. Their concern is often about the US’s growing debt or political polarization. As the world continues to fracture into relatively separate geopolitical and economic blocs, another concern is that China, Russia, Iran, and some of their authoritarian allies want to stop using the dollar for trade and investment. If those countries cut their demand for the greenback, the fear seems to be that the currency will lose value, its purchasing power will decline, and consumer price inflation will rise.
In this report, we provide some guideposts for thinking about exchange rates. We then examine the main global forces that could theoretically reduce demand for the dollar and cut its value. We conclude with a discussion of the prospects for the dollar and the implications for investment strategy.
Don’t miss our accompanying podcasts, available on our website and most podcast platforms: Apple | Spotify
Bi-Weekly Geopolitical Podcast – #12 “The 2022 Mid-Year Geopolitical Outlook” (Posted 6/21/22)
Bi-Weekly Geopolitical Report – The 2022 Mid-Year Geopolitical Outlook (June 21, 2022)
by Bill O’Grady and Patrick Fearon-Hernandez, CFA | PDF
(N.B. Due to the Fourth of July holiday, our next geopolitical report will be published on July 18.)
As is our custom, we update our geopolitical outlook for the remainder of the year as the first half comes to a close. This report is less a series of predictions as it is a list of potential geopolitical issues that we believe will dominate the international landscape for the rest of the year. It is not designed to be exhaustive; instead, it focuses on the “big picture” conditions that we believe will affect policy and markets going forward. They are listed in order of importance.
Issue #1: The Russia-Ukraine War
Issue #2: Xi as China’s President for Life
Issue #3: The Global Food Crisis
Issue #4: Weather Disruptions
Issue #5: Latin American Politics
Issue #6: The U.S. Midterms
Issue #7: Fed Policy and the Dollar
Quick Hits: This section is a roundup of geopolitical issues we are watching that haven’t risen to the level of the concerns described above but should be monitored.