

Tag: CPI
Bi-Weekly Geopolitical Report – Prospects for the Dollar in a Fracturing World (September 9, 2024)
by Patrick Fearon-Hernandez, CFA | PDF
As investment managers and strategists, we are often asked by clients about our outlook for the United States dollar. Very often, our clients have heard some worrisome news about a rival currency becoming more attractive than the greenback or global investors selling off the dollar because of economic or political problems in the US. Their concern is often about the US’s growing debt or political polarization. As the world continues to fracture into relatively separate geopolitical and economic blocs, another concern is that China, Russia, Iran, and some of their authoritarian allies want to stop using the dollar for trade and investment. If those countries cut their demand for the greenback, the fear seems to be that the currency will lose value, its purchasing power will decline, and consumer price inflation will rise.
In this report, we provide some guideposts for thinking about exchange rates. We then examine the main global forces that could theoretically reduce demand for the dollar and cut its value. We conclude with a discussion of the prospects for the dollar and the implications for investment strategy.
Don’t miss our accompanying podcasts, available on our website and most podcast platforms: Apple | Spotify
Asset Allocation Weekly – #55 “The Prices We Don’t See” (Posted 10/1/21)
Asset Allocation Weekly – #41 (Posted 6/11/21)
Asset Allocation Weekly – #36 (Posted 4/23/21)
Asset Allocation Weekly (April 23, 2021)
by Asset Allocation Committee | PDF
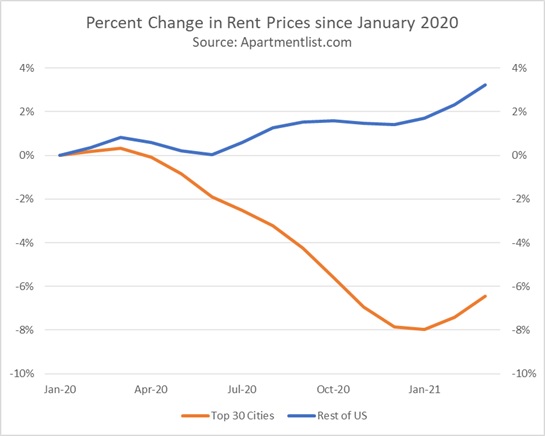
A decade ago, the Rent Is Too Damn High Party became a viral sensation after a candidate for the New York governorship, Jimmy McMillan, announced lowering New York rent as his central platform. Now, over a decade later, rent prices in New York have finally started to fall. The pandemic-driven moratorium on evictions has likely played a role in declining prices in New York, but more of this change can likely be attributed to the phenomenon of people leaving cities in favor of suburban and rural areas. In fact, this migration out of major cities into the suburban and rural areas has been so pronounced that national rent prices have risen. Additionally, this increase in rental rates has led some economists to speculate that the uptick in rent prices is a sign that inflation is on the horizon. In this report, we will discuss how the rise in rental rates, and home prices for that matter, may not have as big of an impact on the Consumer Price Index (CPI) as many would claim.
The real estate market has changed dramatically since the start of the pandemic. Rent prices have dropped in the most populated cities, while suburban and rural areas have seen an increase. Since last year, the top 30 cities by population have seen a decline of roughly 6% in rent prices, while the rest of the country has seen a 4% rise. Purchase prices for homes have also risen sharply during the pandemic, with the S&P CoreLogic Case-Shiller index showing an 11% rise since January 2020. Because shelter is heavily weighted in the CPI, there have been concerns that increasing rental and home prices could push the overall CPI higher.
The CPI estimates the total cost of shelter for the urban areas in the country. Shelter prices account for approximately one-third of headline CPI and about 40% of core CPI. Its heavy weighting is due to the fact that it is the one service most consumers cannot avoid. Because of its weight, a significant movement in shelter prices can lead to huge swings in the index. This is one of the reasons people have been paying close attention to rental and home prices. Shelter has two major components: rent for primary residence and owners’ equivalent rent. Owners’ equivalent rent accounts for approximately 73% of the shelter price, while rent for primary residence accounts for 24%.[1]
Since homes are a capital investment, they are excluded from CPI. As a substitute, the index uses owners’ equivalent rent, which is the implicit rent that homeowners believe they would have to pay if they were to rent their own home. In order to gauge what the prospective rent went would be, the BLS asks consumers who own their primary residence the question, “If someone were to rent your home today, how much do you think it would rent for monthly, unfurnished and without utilities?” This approach reduces the impact home prices could have on CPI because the consumers have to take into account actual economic conditions when responding. Thus, consumers cannot simply answer the question by stating their mortgage payment.
In addition, the way shelter is calculated may also contribute to why CPI doesn’t seem to reflect the upturn in rental and home prices. Because 88% of the population lives in urban areas, CPI primarily tracks prices in cities. In fact, the top five heavily weighted cities ― New York, Los Angeles, Dallas, Philadelphia, and Chicago ― account for about one-fifth of the sample size. Therefore, any increase in rent prices and owners’ equivalent rent in areas outside these cities will not likely swing the index significantly. This helps explain why shelter prices in the CPI have waned in recent months, despite the rise in real estate purchase prices. Put another way, the BLS, which calculates CPI, has to create a weighted average for the entire economy. The problem of averaging is that there is a dispersion around an average that may be wide, but the average masks that issue.[2] It also makes sense to weight the average by population; after all, the central bank would probably not want to react to rising rent prices in Salina, KS, when rents are not rising in New York, NY.
In short, due to the way the CPI is constructed and sampled, increases in rental and home prices may not have a strong impact on the index, depending on the dispersion of pricing changes. Furthermore, the slowdown in the rise in shelter prices, as determined by CPI, is due to people moving out of major cities in favor of suburban and rural areas. Thus, we suspect inflation fears about the rise in rental prices are likely overblown, at least in terms of the CPI. On the other hand, because each person purchases their own unique basket of goods and services, some people may be experiencing rising prices in a way that is different from the average experience across the economy.
[1] The other two components are lodging away from home and tenants’ and household insurance.
[2] Often this situation is highlighted in statistics classes by the example of a person with their head in a 350o oven and foot in an ice bucket; on average, the person’s temperature is normal.
Asset Allocation Weekly – #35 (Posted 4/16/21)
Asset Allocation Weekly (April 16, 2021)
by Asset Allocation Committee | PDF
In the NBC mockumentary show The Office, the character Jim Halpert gets tricked into choosing his wife, Pam, as “Employee of the Month.” Perplexed and suspicious, coworkers begin to probe into how Jim’s wife was deserving of the award. Pam, who was also surprised, attempts to justify the result, saying, “I didn’t miss a day, I came in early, I stayed late, and I doubled my sales last month.” Not buying her answer, a coworker rebuts, “Oh, really! From what? Two to four?” In an aside to the camera, Pam replies, “Yup!” This example illustrates how an otherwise shocking statistic can be rendered meaningless when viewed in the proper context. In this report, we will discuss the importance of context when evaluating the Consumer Price Index (CPI) over the next few months and how an expected sharp rise in inflation may not be a cause for concern.
The CPI tracks the monthly price movements of consumer goods and services. The index is based on a weighted average in which services make up 60% of the index and goods make up the remaining 40%. To minimize distortions due to normal monthly variations, the index is adjusted to take seasonality into account as both demand and supply can be affected by seasons. For example, beef demand usually rises in the summer (the “grilling season”), so statisticians at the Bureau of Labor Statistics will adjust for the price effects of this seasonal demand through a seasonal adjustment process. However, these adjustments usually only deal with predictable yearly effects. Unusual weather events or one-off situations are not taken into account. As a result, outlier events such as supply disruptions, war, drought, and, most recently, pandemics aren’t part of the seasonal adjustment process. Thus, the frequently reported yearly change in CPI can sometimes be more reflective of changes in the comparison year rather than actual price pressures.
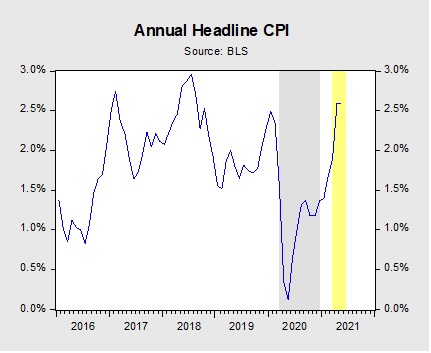
The chart above shows how the year-over-year change in the CPI will look if the index remains unchanged for the next three months. The grey region represents the start of the pandemic in March 2020 through the end of 2020. The yellow region shows annual inflation if the index remains unchanged from February. Using this assumption, headline CPI would show year-over-year increases of 1.9%, 2.6%, and 2.6%, respectively, over the next three months. The 2.6% figures would be near three-year highs. In other words, barring unforeseen deflation, the CPI report will likely show a steep rise in inflation.
The rise in the index over the next few months can be attributed to goods and services returning to their normal levels. Energy prices, particularly, are primed to be one of the key drivers pushing inflation higher. Fuel prices have risen 34.5% after hitting a 15-year low last May.[1] In general, prices for goods have outpaced services due to stronger demand from people forced to stay home. However, as vaccinations become more ubiquitous and restrictions on movement decline, this trend will likely reverse. Fares for travel and entertainment are expected to pick up as good weather sets in and more states begin to allow people to enjoy recreational activity.
It is also likely that stimulus checks could temporarily lift prices. Over the last few months, prices for durable goods such as used motor vehicles and major appliances have surged. White goods have done particularly well, with prices up 24.3% from February 2020. This suggests that households may have used their stimulus checks to purchase big-ticket items. That being said, this inflation will likely be limited as consumers are less likely to buy more of these goods over the next few years.
In summary, over the next few months, the CPI may not paint an accurate picture of inflation. Because the index does not make adjustments based on major outlier events such as pandemics, base-year comparisons can be distorted. As a result, the upcoming CPI report of annual inflation may reflect a combination of deflation in goods and services in the previous year and fiscal stimulus in the current year. Neither will result in the unfettered inflation that skeptics are warning about as both are one-time events. As a result, any adverse impact caused by these reports in the financial markets will likely be short-lived.
[1] In fact, last year, oil prices briefly fell below zero.