

Author: Rebekah Stovall
Asset Allocation Weekly (February 5, 2021)
by Asset Allocation Committee | PDF
The residential real estate market has made a strong recovery over the past year. Virtually all areas of housing, including home prices, starts, and ownership are showing signs of strength. Let’s start with prices.
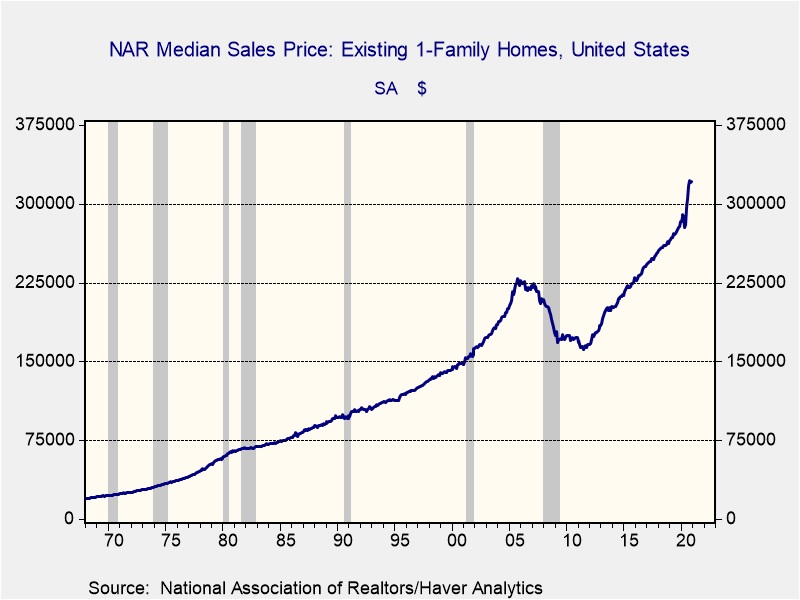
Home prices have been very strong recently. This chart shows single-family existing home sales. Over the past year, existing home prices are up 13.4%. Increases of this magnitude or higher only occur 4.8% of the time. New home prices are up as well, but not to the same degree; the median new home price is up 8.0%. Price increases of that level or higher occur abut 35% of the time.
Despite this rise in prices, housing affordability remains high. A rising NAR affordability index suggests easy buying conditions. The current reading is off its recent highs but well above the levels seen in 2005.
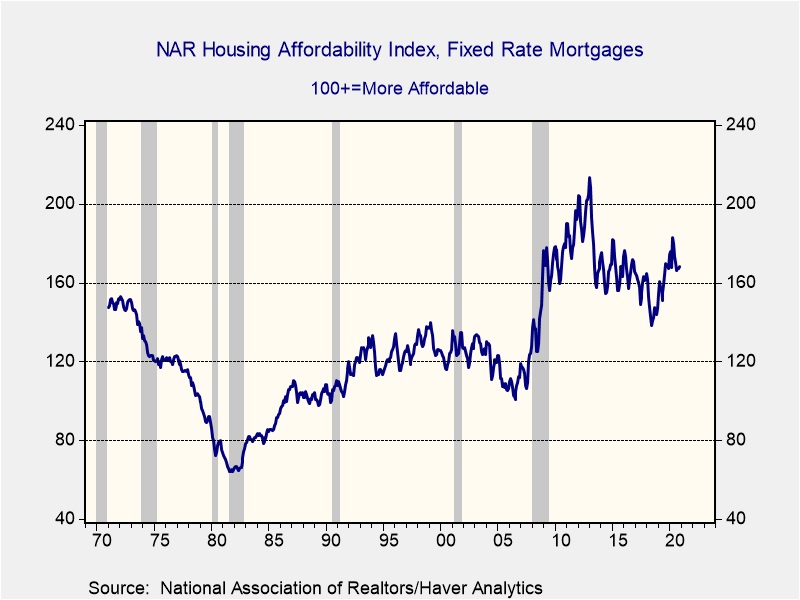
The index combines home prices, average wages, and mortgage rates. The latter two have improved the index recently,[1] offsetting the impact of higher home prices.
The rapid rise in household formation should provide a catalyst for continued home sales and construction.
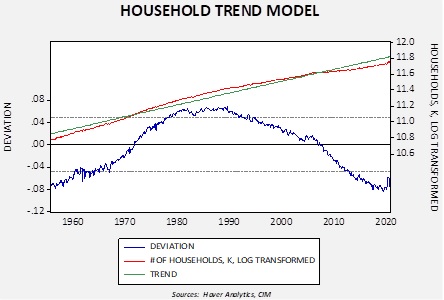
This chart shows the level of household formation on a log basis. Household formation has been declining since 1990 but has started to stabilize recently. In addition, recently the data was recovering quickly but did pull back due to the pandemic. We expect the recent bounce is a signal of faster formation as the large millennial generation begins to form households. If so, a rise similar to what was seen from 1960 to 1980 may be in store.
Finally, one of the factors that had hampered this sector was suburban sprawl. In some areas, the commutes to work had become so lengthy that workers could no longer move further away from urban centers to find affordable housing. However, the pandemic has proven, for many workers, that working from home is a possibility. As a result, workers are looking again at buying more space further “out” with the idea that instead of commuting five days a week, it may be three or less, which is more manageable.
For these reasons, the Asset Allocation Committee remains favorable toward the homebuilding and related industries, expecting them to perform well in the coming years. And, as we noted in our 2021 Outlook, if the Federal Reserve is serious about improving the lot of the bottom 90% of households, then it should keep interest rates low because this group’s largest asset is its home, and low interest rates support the price of that asset.
[1] The pandemic has pushed average wages higher because lower paid service workers have suffered larger job losses.
Weekly Energy Update (February 4, 2021)
by Bill O’Grady, Thomas Wash, and Patrick Fearon-Hernandez, CFA | PDF
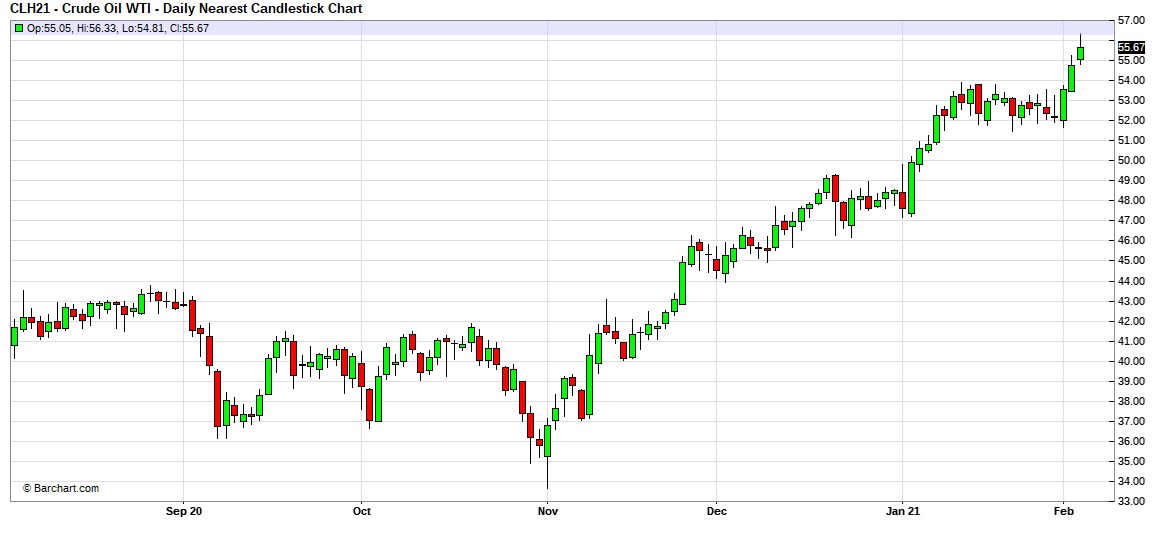
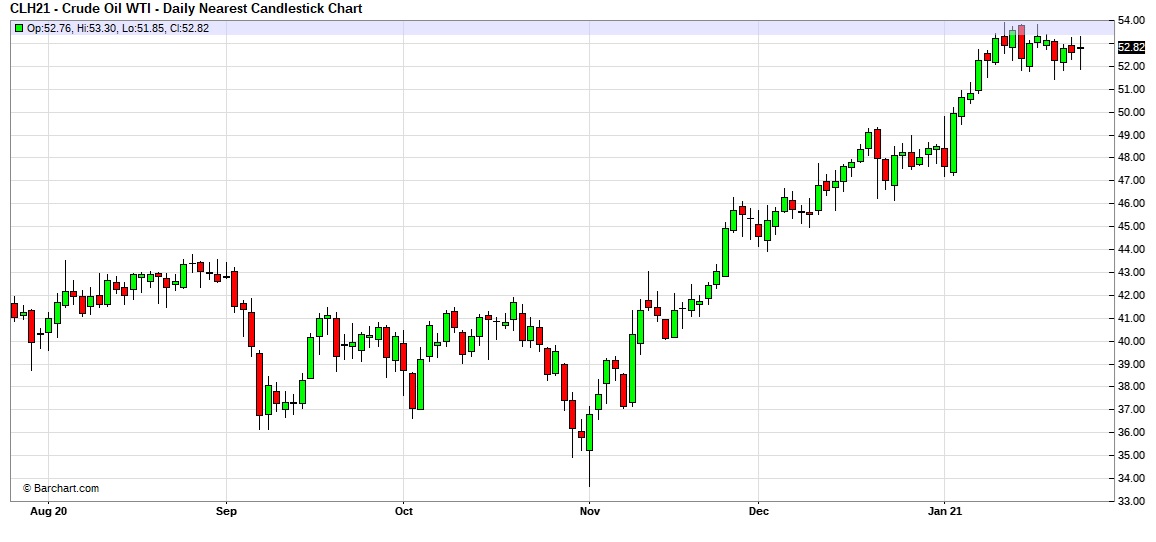
Here is an updated crude oil price chart. Prices broke out of their recent trading range and are now well above $55 per barrel.
Commercial crude oil inventories unexpectedly fell 1.0 mb when a build of 3.0 mb was forecast.
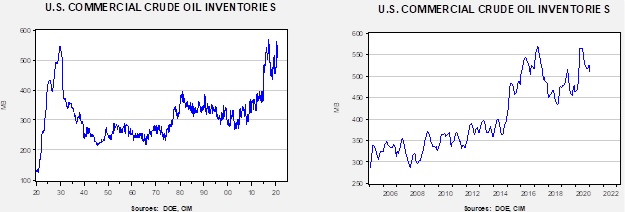
In the details, U.S. crude oil production was unchanged at 10.9 mbpd. Exports rose 0.1 mbpd, while imports increased by 1.4 mbpd. Refining activity rose 0.50%.
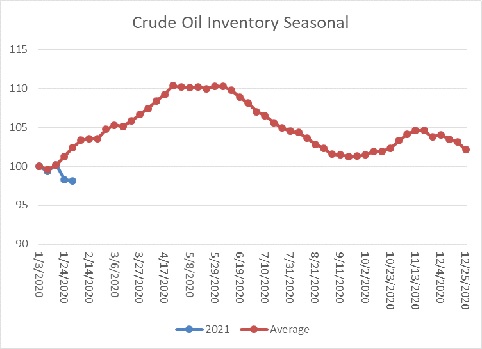
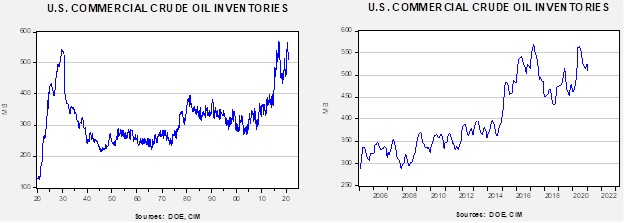
The above chart shows the annual seasonal pattern for crude oil inventories. This week’s decline, though small, is contraseasonal. The usual seasonal pattern occurs due to refinery maintenance; in the past, the U.S. oil industry had limited ability to export, which contributed to the seasonal pattern. With the potential for higher exports, the expected seasonal build may not occur, which would be bullish for prices. If we were following the normal seasonal pattern, oil inventories would be 22.4 mb higher.
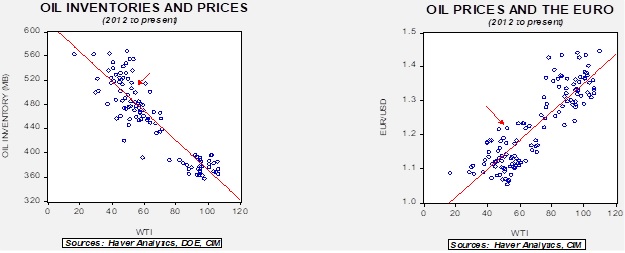
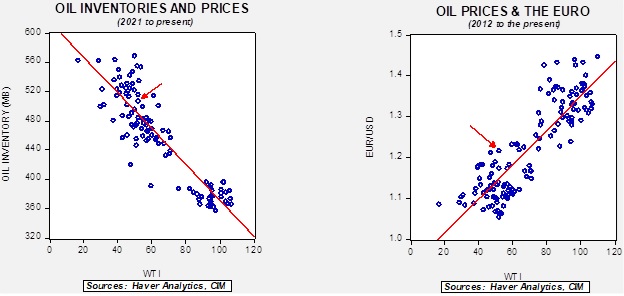
Based on our oil inventory/price model, fair value is $48.37; using the euro/price model, fair value is $70.79. The combined model, a broader analysis of the oil price, generates a fair value of $58.32. The wide divergence continues between the EUR and oil inventory models.
Geopolitical news:
- The Biden administration has reportedly offered the EU its terms for allowing the Nord Stream 2 project to be completed. First, the U.S. wants the EU (read: Germany) to renegotiate its gas transit contract with Ukraine. Second, it wants to build in a shutdown mechanism on the pipeline so that if Russia cuts off natural gas flows through Ukraine, the Nord Stream 2 flows would also be suspended. It’s hard to see why the EU would accept these terms. The whole point of the pipeline is to avoid the bottleneck through Ukraine, which holds the EU hostage to Russian/Ukrainian relations. But, Germany and the EU may want to show they want to work with the incoming Biden administration and agree.
- Israel is warning that it has new plans to attack Iran’s nuclear program. Given that relations with the Arab states have improved through the Abraham Accords, the logistics of an Israeli attack have improved. We doubt Israel will act but it is a warning to the new administration that the situation in the Middle East is fluid and may become a problem.
- Although the Biden administration says it would like to return to the Iran nuclear deal signed under the Obama administration, it is unlikely that Iran would return under the previous agreement. This situation makes returning to the deal difficult. Compounding the problem is Iran’s continued development of missile technology, which was generally excluded from the original agreement.
- At the same time, the Biden administration is suspending arms sales to the UAE and the KSA. This decision includes the sales of F-35s to the former, which was made in return for its recognition of Israel; we do expect the sale to be completed at some point.
Energy industry news:
- Although hope is rising for energy shares, it is still unclear if the industry, especially shale, can woo investors back. As we note below, the future isn’t bright. Although the world will be using oil and gas for the next couple of decades, it’s likely that consumption will decline over time.
- Adding to pressure is that pipeline projects are becoming much more difficult to complete. It may be that major projects have become impossible.
- Worries about a shrinking industry led two of the supermajors, Exxon (XOM, USD, 45.63) and Chevron (CVX, USD, 87.06), to discuss a merger in early 2020. As industry growth slows, and eventually contracts, cost-saving through mergers will likely become more common.
- The earnings for oil companies in 2020 were “brutal” as the pandemic and regulation weighed on the sector. This year will be better, but not stellar.
- It is important to note that commodities are priced based upon current supply and demand fundamentals with less regard for future market conditions. In other words, the price of oil a decade from now doesn’t have a major impact on current crude prices. But it does affect energy equities, which discount the future. Thus, the outlook for future oil demand is bearish for energy equities, but paradoxically it is actually supportive for oil prices because less investment means supplies will fall, likely faster than demand contracts.
- The only commercial carbon capture program closed, oddly, due to low oil prices. The program sold the carbon dioxide it pulled from burning coal to oil producers to enhance oil production (CO2 injection is one method to enhance oil output). When oil prices fell, it was no longer economical to operate the plant. Carbon capture has been one hope the fossil fuel industry has to maintain the industry in a low carbon world. Unfortunately, thus far, the programs have failed to deliver.
Alternative energy/policy news:
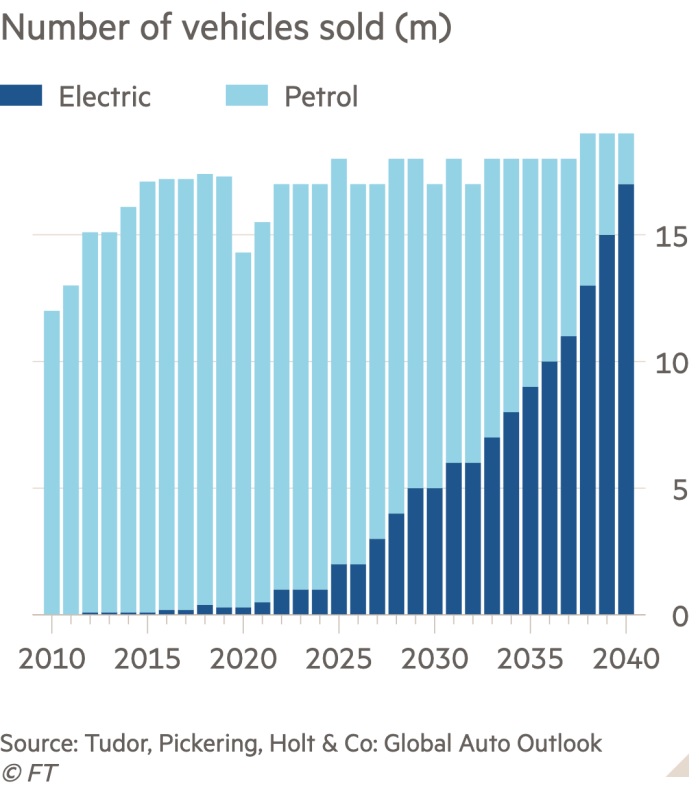
- General Motors (GM, USD, 52.48) announced it would phase out gasoline and diesel fuel vehicles by 2035, the first major automaker to create a hard timeline to offer a fully electric line of vehicles. It is not clear whether other automakers will follow, but if governments start to back this decision, the future of oil in transportation is facing a serious threat.
- Although the new administration is moving quickly to establish climate change regulation, the energy industry is responding, trying to slow the rollout.
- The oil and gas industry is trying to make common cause with the farm belt. After all, the electrification of transportation will curtail the use of ethanol and reduce the demand for corn. Unfortunately for oil and gas, the industry has undermined the use of ethanol by supporting the EPA’s exemptions for meeting the mandate for ethanol demand. It is expected that the Biden administration will not be as generous in granting exemptions. When a refiner can’t use enough ethanol to meet the mandate, it must buy Renewable Identification Numbers (RINs) to fulfill the mandate. The prices of RINs have been rising since summer. Farm groups have been upset by the wide use of exemptions which undercut the demand for corn ethanol.
- The Trump administration used the Commodity Credit Corporation (CCC) as a conduit for aid to farmers affected by the China trade conflict. This use was outside of the original mandate of the CCC, which was created during the Great Depression to support commodity prices. The Biden administration wants to continue to use this broader mandate, perhaps using the CCC funding to support a carbon bank, paying farmers for absorbing carbon by the crops they plant.
- In the waning days of the Trump administration, the OCC ruled that banks could not exclude industries from lending simply based on the industry itself. The Biden administration has reversed this ruling, which means that banks can decide not to make loans to oil and gas firms.
- The Fed is expected to support environmental lending as part of its regulatory mandate.
- Fund managers are getting into the act as well.
- Although the new administration has tried to make the point that expansion of jobs in solar and wind will offset losses in fossil fuels, the numbers don’t support the claim.
- The EU is creating a body to foster the development of batteries.
- The “hottest” area of batteries is solid state. Solid state batteries will charge faster, have greater range, and last longer than the current arrays. China claims it is making progress toward the commercialization of such a battery. Despite the hopes, it will probably take years before the technology is developed and commercialized.
- A problem for “green” energy is that much of it requires rare earths in construction. Rare earths production is mostly controlled by China, but the Pentagon is trying to support non-Chinese mining and processing by awarding contracts to firms.
- The other fuel we are watching is hydrogen. Although most of the focus is on batteries, a competitor would be fuel cell cars fueled by hydrogen. The process of extracting hydrogen from water offers the most promise but is still far too expensive to be practical. However, there is continued progress on this front.
View PDF
Weekly Geopolitical Report – The U.S.-China Balance of Power: Part III (February 1, 2021)
by Patrick Fearon-Hernandez, CFA | PDF
In Part II of this report, we provided a head-to-head comparison of U.S. and Chinese military power. Obviously, military power is the ultimate source of coercion that one country can use to influence others. During non-conflict times, however, countries tend to use less violent means of influence. One of the most important such peaceful sources of power is economic. This week, in Part III, we examine the relative economic power of the U.S. and China, mostly in terms of the leverage they gain from importing enormous amounts of goods and services from other countries and providing investment capital abroad. Next week, Part IV will describe the relative diplomatic positions of the two countries around the world. Finally, Part V will dive into the associated opportunities and threats for U.S. investors.
Asset Allocation Weekly – #25 (Posted 1/29/21)
Asset Allocation Weekly (January 29, 2021)
by Asset Allocation Committee | PDF
Although there are always sundry risks to financial markets, a proximate and substantial risk comes from inflation. Of course, there is always risk of some degree of generalized price changes to financial assets. It also is important to realize that there is always some degree of inflation or deflation in an economy. Prices are rarely perfectly stable. The goal of policymakers is not necessarily to rid an economy of inflation but to have a degree of price stability so that economic actors don’t feel compelled to take price changes into account when making decisions. Overall, societies can generally cope with modest changes in prices over a year, which has led central banks to target inflation around 2%. There is nothing particularly special about 2%, other than it seems to work. It is also possible that 3% would work as well.
A price index is a basket of goods and services and their prices are subject to micro changes in a particular market and macro changes that affect prices from policy variables or other markets. For example, the price of crude oil is affected by the supply and demand for the product (the micro). It is also affected by exchange rates, the cost of public transportation, employment, etc. For a basket of goods, weighted by some methodology, the causal factors are not only impossibly large but unstable; in other words, there are lots of inputs that affect an inflation index, and the impact of these inputs can vary over time.
In the face of such complexity, there is a clear desire for simplicity from policymakers, economic actors, and investors. Economic theory has tried to provide simple rules. Monetarists suggested that monitoring the money supply is sufficient. Keynesians offered the Phillips Curve. Supply side economists argued that inflation was generated from excessive regulation. Others suggested that excessive fiscal spending was the culprit. Exchange rates seemed to have an impact. At times, these explanations have worked; in others, they have failed. Our take is that because the factors that trigger inflation are complicated, the conditions surrounding a change in the money supply, a decline in unemployment, an increase in regulation, additional fiscal spending, or a currency depreciation matter greatly.
Another important factor is inflation expectations. Our view is that inflation has an element of a balance sheet decision. Essentially, households and businesses receive liquidity and make a balance sheet decision on how it is held. If there is confidence that inflation will remain low and the return on cash is high enough, it will be held either as cash or in a near equivalent. If inflation expectations remain low but the returns on cash and near-cash instruments are low, financial assets are the likely destination. If inflation fears are elevated, the cash will be converted to real assets. For businesses, this may mean accumulated inventory. For households, this can be accomplished by purchases of consumer durables (cars, houses) or food in the freezer and canned goods in the basement.
Measuring inflation expectations is far from exact. The TIPS market provides a market estimate, but it seems to closely track crude oil, suggesting that market participants are not necessarily in possession of any great insight. Since 2008, the implied inflation rate from the TIPS market and oil prices are correlated at the 76.5% level. There are inflation surveys as well, but our read is that they tend to reflect the recent past. Milton Friedman argued that inflation expectations tend to be built over a lifetime; in our modeling, we use a 15-year average of the yearly change in CPI as a proxy.
For the next few months, we are likely to see what appears to be a spike in inflation.
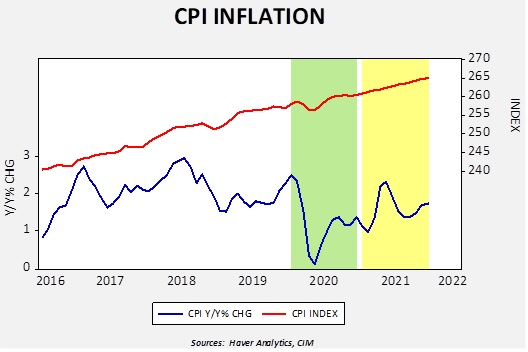
This chart shows the CPI Index (upper line) and the year-over-year percentage change (lower line). The area shaded green shows last year. Note that from February through May, the index fell and then rose. This time period represents the first pandemic lockdowns which led to a sharp drop in economic activity and price levels. The lower line shows that the yearly inflation rate fell to 0.1% in May before it began to rise as economic activity restarted.
In the yellow area, we show how inflation will behave assuming the index grows at 0.015% per month, which is the average monthly rate over the past five years. Using that assumption, due to base effects, we will see a rather sharp rise in yearly inflation in the second quarter where overall CPI will rise to 2.3% in May. If the overall index rises faster, the yearly change will as well. The point of this exercise is to warn investors that there will be a rise in reported inflation coming soon. It doesn’t necessarily mean that the rise will be sustained, but we would expect concerns to be raised which may adversely affect financial markets.
Business Cycle Report (January 28, 2021)
by Thomas Wash | PDF
The business cycle has a major impact on financial markets; recessions usually accompany bear markets in equities. The intention of this report is to keep our readers apprised of the potential for recession, updated on a monthly basis. Although it isn’t the final word on our views about recession, it is part of our process in signaling the potential for a downturn.
In December, the diffusion index rose further, signaling that the economy remains on track to continue its recovery. Financial markets were mixed; equities strengthened, while the yield curve steepened as vaccine production boosted growth expectations and lifted inflation expectations. Meanwhile, the labor market had a setback as a rise in COVID-19 cases led to new lockdown restrictions. Manufacturing remains strong as a weaker dollar promoted more exports abroad. As a result, four out of the 11 indicators are in contraction territory, unchanged from last month. The reading for December remained unchanged from the previous month at +0.2727, above the recession signal of +0.250.
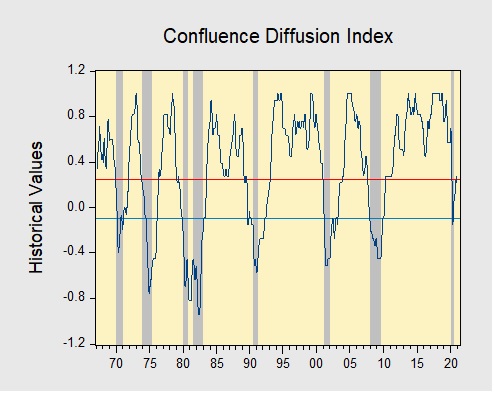
The chart above shows the Confluence Diffusion Index. It uses a three-month moving average of 11 leading indicators to track the state of the business cycle. The red line signals when the business cycle is headed toward a contraction, while the blue line signals when the business cycle is headed toward a recovery. On average, the diffusion index is currently providing about six months of lead time for a contraction and five months of lead time for a recovery. Continue reading for a more in-depth understanding of how the indicators are performing and refer to our Glossary of Charts at the back of this report for a description of each chart and what it measures. A chart title listed in red indicates that indicator is signaling recession.
Keller Quarterly (January 2021)
Letter to Investors | PDF
There is an adage I repeat to my colleagues during every election cycle (of which I’m sure they’ve long ago grown tired): “We don’t get to manage money in the world we wish we had, we can only manage money in the world we have.” Every four years approximately half our clients are disappointed about the election results and can’t see how their investments could possibly survive the newly sworn-in administration. And, yet, they do in fact survive and, often, even prosper. These last two election cycles have been particularly emotional for many. After the 2016 election many of our clients thought their investments would plummet in value and leave them penniless. Right now, I’m hearing similar fears from the “opposite side of the aisle.” In both cases, these groups were influenced by “experts” whose opinions had more to do with their political views than with their knowledge of the economy and markets. And in both cases, we believe, they are (and were) wrong.
Why is it that people are so often wrong about the effect of political swings on markets? Half of the population usually gets the election’s impact on the stock market wrong because of a simple factor: emotion. Few activities in American life generate more, and hotter, emotions than politics. Without exception, emotions are the greatest stumbling block to good investment decision-making.
Emotions are one of the elements that make us human. I’m not denigrating them universally. But emotions cloud our powers of reasoning, causing us to overlook evidence to the contrary or to overweight evidence that we like, leading us to the conclusions we want rather than to the conclusions the evidence infers. Emotions can lead us to make poor decisions on individual stocks or on the entire investment climate. During and after major elections, this phenomenon is rampant.
People have often spoken of the twin catastrophic emotions of investing, fear and greed; fear is extreme pessimism regarding investments and greed is optimism run amok. That greed, ironically, generally leads investors to either lose money or make much less than they could have made, while fear usually leads investors to not make the money they should have made. It is fear that tends to afflict investors most during election cycles.
I touched on this subject in my recent October 2020 letter. (In fact, I was tempted to just reissue the same letter after changing the date and changing the future tenses to past tenses.) Fear combines with an important historical tendency to create a big problem for investors. That tendency is to overestimate the impact of presidential elections on investment portfolios, often by a lot. Factors that are generally well beyond the short-term impact of politics, such as economic progress and corporate earnings, have a much bigger impact. This is not to say that politics plays no role in the economy at all, but it is less than one would expect, especially in the short run. The impact of political decisions usually plays out over decades, not years, and even then, it is often swamped by secular trends that politicians can’t control.
As I noted in that previous letter, the economic recovery currently underway, the Fed’s extraordinarily favorable monetary policy, and the likelihood that COVID-19 will recede over the next two years should lead to higher stock prices, regardless of the political landscape. Those reasons for optimism still hold, in my view. In fact, the positive results of vaccines were unknown three months ago. Thus, my optimism is higher still.
If the outlook, independent of the election, was dire, I would tell you as much. But that is not the case today. As I noted three months ago, the outlook was (and is) positive, regardless of the election’s outcome.
President Franklin Roosevelt began his first inaugural address (March 4, 1933, in the depths of the Great Depression) by asserting that “the only thing we have to fear is fear itself.” When I first heard that phrase, I thought it was non-sensical; then I got into the investment business. We observe that phenomenon almost daily. Do not let fear debilitate your investment goals.
We appreciate your confidence in us.
Gratefully,
Mark A. Keller, CFA
CEO and Chief Investment Officer
Weekly Energy Update (January 28, 2021)
by Bill O’Grady, Thomas Wash, and Patrick Fearon-Hernandez, CFA | PDF
Here is an updated crude oil price chart. Prices are consolidating between $54 to $52 dollars per barrel after a strong rally from early November into late January.
Commercial crude oil inventories unexpectedly fell 9.9 mb when a build of 1.5 mb was forecast.
In the details, U.S. crude oil production declined 0.1 mbpd to 10.9 mbpd. Exports rose 1.1 mbpd, while imports declined 1.0 mbpd. Refining activity fell 0.8%.

The above chart shows the annual seasonal pattern for crude oil inventories. This week’s decline is abnormal. The usual seasonal pattern occurs due to refinery maintenance; in the past, the U.S. oil industry had limited ability to export, which contributed to the seasonal pattern. With the potential for higher exports, the expected seasonal build may not occur, which would be bullish for prices. Of course, one week doesn’t constitute a trend, but the decline was notable.
Based on our oil inventory/price model, fair value is $48.05; using the euro/price model, fair value is $70.80. The combined model, a broader analysis of the oil price, generates a fair value of $58.18. The wide divergence continues between the EUR and oil inventory models.
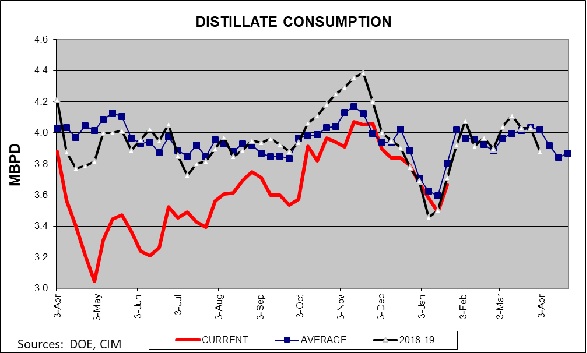
Distillate consumption has returned to normal and should continue to rise on a seasonal basis.
We continue to see evidence of market and policy measures causing a divergence between oil and gas prices compared to related equities.
- The steady supply of oil relies, in part, on continued exploration and field development. Last year, there was a notable decline in acreage acquisition by the largest oil companies in part due to low oil prices. Because virgin oil fields require investment well before they begin producing, there is a risk that future declining demand will strand the investment. We are already seeing declines in exploration budgets.
- We expect that pipeline growth will be further restricted. This is bullish for oil and gas prices, and bullish for existing pipelines, but determining the impact on individual companies is hard to generalize.
- As expected, the Biden administration is restricting drilling on federal lands. The oil industry will likely engage the courts to overturn this ruling, but, for now, it looks like this area won’t be available for production. It represents about 9% of onshore production.
- By early in the next decade, it is estimated that 50% of new car sales will be EVs.
Here is the geopolitical news:
- In a bid to diversify its economy, the Kingdom of Saudi Arabia (KSA) is using its sovereign wealth fund to encourage health and tech companies to set up operations in the country.
- Also in the KSA, the U.S. is engaging in a quiet buildup of forces to counteract Iranian actions.
- As the Biden administration takes power, Israel is starting to saber-rattle, warning it may attack Iran. Such comments dwindled under the last administration but were common during the Obama government. Our take is that Israel probably won’t take unilateral action, but there is a chance that a coordinated action may be more likely as relations improve with the Arab Gulf states.
- Indonesia has detained Chinese and Iranian oil tanker crews who were engaged in illegal oil transfers in Indonesian waters. We suspect this was done to evade sanctions.
- China is expanding its investment in green projects as part of the “belt and road” program.
On the alternative energy front, here is what we saw this week:
- Lenders are offering lower interest rates to commodity firms and traders who lower their carbon output. This allows the banks to package these as “green” loans to investors to meet ESG goals.
- Blackrock (BLK, USD, 709.76) CEO Larry Fink warned companies that if they lag in achieving the goal of net zero emissions by 2050, the asset manager may exclude them from active portfolios. Blackrock is using its power as a large owner of company equities to press for climate change action.
- Exxon (XOM, USD, 46.38) has partially succumbed to activist pressure, announcing it will make changes to its board and take measures to reduce its carbon output.
- Large battery arrays are becoming more common as utilities use them to smooth out the variable flows from wind and solar power.
- We are seeing a buildup of U.S. battery production.
- Recent studies suggest the costs of solar power will continue to decline and replace conventional energy.