

by Asset Allocation Committee | PDF
(Due to staff vacations, there will not be an accompanying podcast and chart book this week. The multimedia offerings associated with this report will resume next week, May 7.)
In our asset allocation strategies, we continue to have a separate provision to homebuilders. The reason for this particular position is due to our belief that homebuilding and associated industries are poised for a multiple-quarter expansion. One reason for this expectation is that housing and homebuilding are still recovering from the housing bubble that peaked in 2005. The aftermath of that bubble caused a decline in homebuilding.
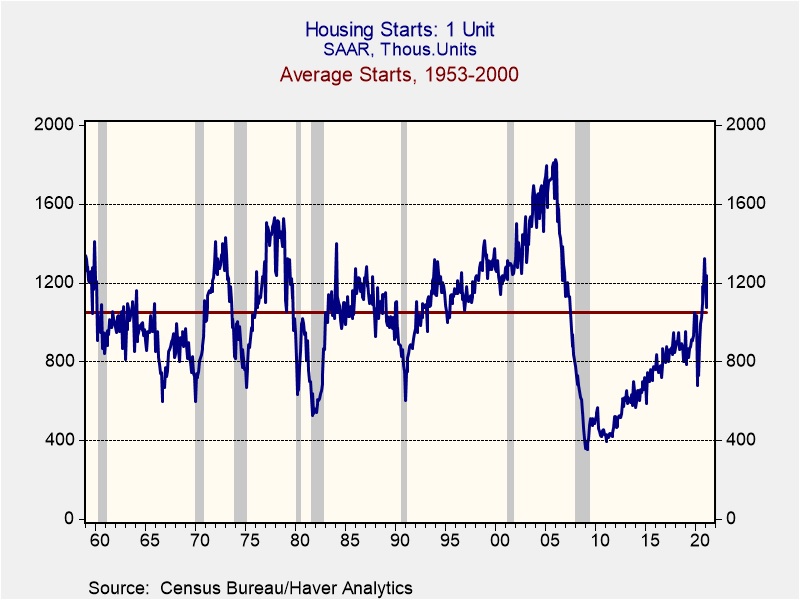
This chart shows housing starts from 1953 to the present. From 1953 to 2000, the average was 1.048MM single-family starts per month on a seasonally adjusted annualized basis. Note that starts rose well above average during the housing bubble and then plunged during the Great Financial Crisis. They only returned to their earlier average last August. Given that the population was smaller in the past, existing sales per capita would be even lower now.
The shortage of single-family homes relative to starts is even more stark when compared to the single-family home vacancy rate.
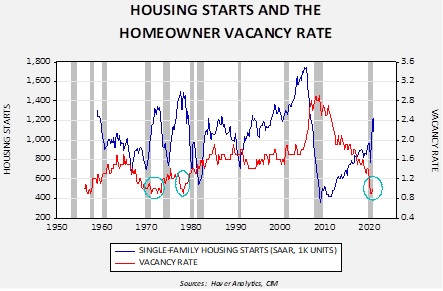
This chart shows single-family housing starts compared to the vacancy rate. We have marked low vacancy levels with teal circles. In the 1970s, vacancies at the current level led to starts between 1.3MM and 1.4MM starts. We are currently around 1.1MM, which suggests a boom in homebuilding is not only likely, but probably necessary to meet the demand for housing. Thus, our outlook for the homebuilding sector remains especially positive.