by the Asset Allocation Committee | PDF
After two years of press reports about skyrocketing home prices, we assume investors are well aware that the housing market has been hot. However, “housing” includes at least two main asset types: single-family homes and apartment properties. A deep dive into the data reveals significant differences between these two submarkets in terms of their current conditions and future outlooks. As we show in this article, the economic environment is currently worsening for the builders and sellers of single-family homes, even if the longer-term position looks bright. In contrast, conditions look favorable for apartment owners in the near term, but they may face future problems from overbuilding.
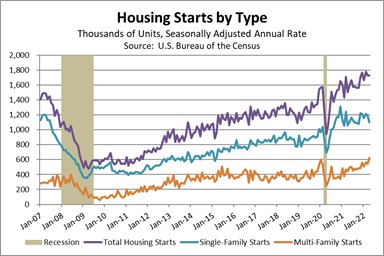
As shown by the purple line in the chart below, new U.S. home construction began to accelerate late in the previous economic expansion, around the start of 2019. Homebuilding plunged when the pandemic hit in early 2020, but it quickly recovered and accelerated further in response to the Federal Reserve’s dramatic interest-rate cuts, the federal government’s massive fiscal support to individuals, and people’s desire for more “work from home” space. What many people miss is that the jump in single-family home construction was a one-time event. Groundbreakings for single-family homes jumped from an annual rate of 1.003 million just before the pandemic to a rate of 1.308 million in December 2020 but have plateaued at an average rate of 1.139 million since then (the teal line in the chart). The situation has looked much better for multi-family developers. Their groundbreakings were little changed in the first year after the pandemic hit, but they’ve been on a steady uptrend since early 2021 (the orange line in the chart). In the first four months of this year, single-family housing starts were up just 4.8% from the same period one year earlier, while multi-family starts were up 27.7%.
Over the coming year or so, we think these trends will continue to diverge. Rising mortgage interest rates and sky-high prices are already cutting into the demand for single-family homes. Sales transactions have started to fall, and we are even seeing a slowdown in price appreciation. These dynamics are a key reason we recently eliminated our overweight to the stock market’s Homebuilder sector in our asset allocation strategies. At the same time, we think high prices for single-family homes and low inventories of homes for sale will keep pushing people into the apartment market, driving up rents, and prompting companies to develop many new properties. But does that mean we’re on the hunt for investments in the apartment sector? Not necessarily.
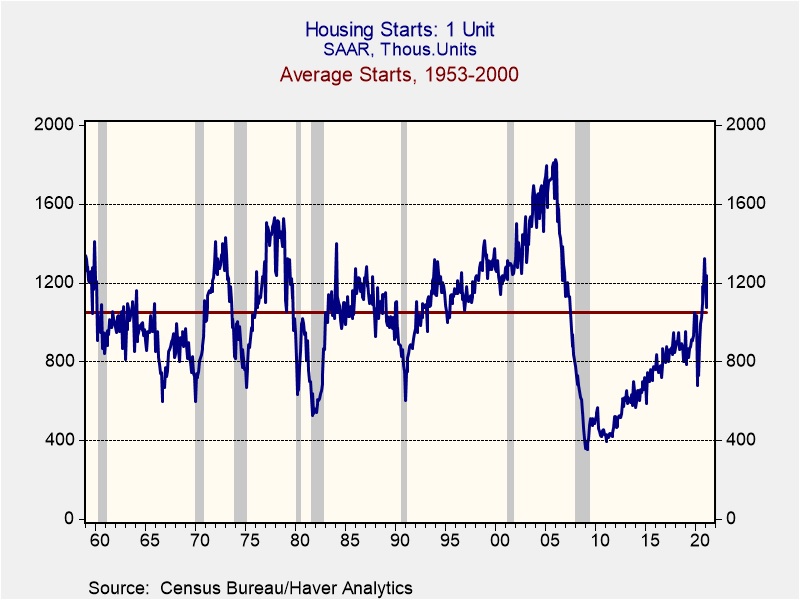
We think the longer-term outlook for single-family homebuilders remains bright despite the near-term challenges. After all, single-family home construction in the U.S. has still not recovered from its steep drop after the housing bubble burst. In the three decades just before that crisis, U.S. homebuilders each year broke ground for approximately 1.2 new single-family homes per 100 existing households. By 2011, they were breaking ground for just 0.4 new homes per 100 households, and the figure only recovered to 0.9 per 100 last year (see chart below). This implies that the U.S. has an enormous deficit of modern single-family homes. Reaching the previous 1.2-per-100 standard now would require firms to build and sell more than 1.5 million new single-family homes this year, versus their recent pace of about 1.1 million homes. Reaching the 1.2-per-100 standard plus making up the post-bubble shortfall over the next decade would imply building and selling about 2.5 million new homes each year.
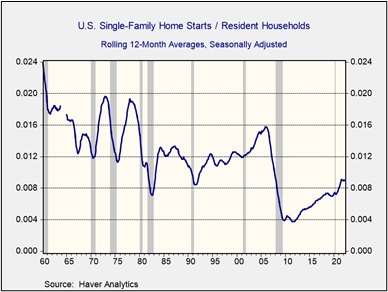
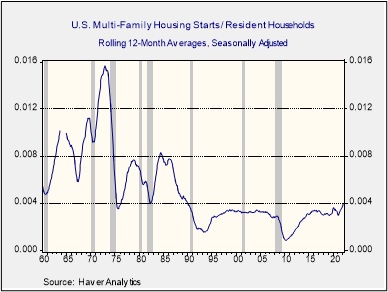
In contrast, today’s strong apartment building suggests that sector could eventually return to the overbuilding of the past, with its falling rents, reduced profitability, and weaker stock prices. Outside of recession periods, multi-family developers over the last three decades have typically built about 0.3 apartment units per 100 households. They are now consistently building 0.4 units per 100 households for the first time since the late 1980s (see chart below).
Admittedly, future single-family home construction could still be constrained to some extent by the new dominance of big, publicly traded homebuilders, the banking system’s strict post-bubble standards on construction loans, and challenges in finding buildable land. The sector could also face some headwinds from demographic changes like weaker population growth, population aging, and people’s increased preference to stay in their homes longer. Nevertheless, we think single-family homebuilders will have plenty of opportunities for profitable new business and higher stock prices once we get past the Fed’s current rate-hiking cycle and construction costs moderate again. In contrast, the risk of apartment overbuilding and the difficulty in finding suitable apartment-focused investments discourages us from trying to jump into that sector. We think the best strategy right now is to avoid the entire housing sector temporarily until we see a new buying opportunity in single-family homebuilders in the future.