

Business Cycle Report (April 29, 2021)
by Thomas Wash | PDF
The business cycle has a major impact on financial markets; recessions usually accompany bear markets in equities. The intention of this report is to keep our readers apprised of the potential for recession, updated on a monthly basis. Although it isn’t the final word on our views about recession, it is part of our process in signaling the potential for a downturn.
In March, the diffusion index rose further above the recession indicator, signaling that the recovery is continuing. In the financial markets, heightened inflation fears led to a sell-off in equities and 10-year Treasuries. Meanwhile, a slowdown in COVID-19 cases and easing restrictions made it easier to hire workers; thus, last month saw an improvement in labor market conditions. However, poor weather conditions and supply constraints, particularly the lack of semiconductors and lumber, led to a pullback in manufacturing activity. As a result, four out of the 11 indicators are in contraction territory. The reading for March was unchanged from the previous month at +0.2727, above the recession signal of +0.2500.
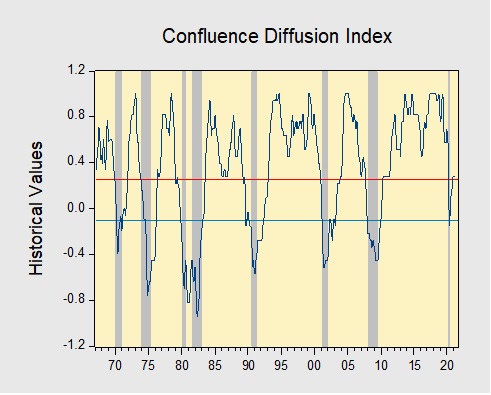
The chart above shows the Confluence Diffusion Index. It uses a three-month moving average of 11 leading indicators to track the state of the business cycle. The red line signals when the business cycle is headed toward a contraction, while the blue line signals when the business cycle is headed toward a recovery. On average, the diffusion index is currently providing about six months of lead time for a contraction and five months of lead time for a recovery. Continue reading for a more in-depth understanding of how the indicators are performing and refer to our Glossary of Charts at the back of this report for a description of each chart and what it measures. A chart title listed in red indicates that indicator is signaling recession.