[Posted: 9:30 AM EDT] It’s another quiet and mostly sluggish day in global markets. The French are holding a presidential debate today at 8:40 pm local time (2:40 EDT) that will be closely watched. Current polling hasn’t changed; Le Pen and Macron will likely win the first round and the latter should win easily in the runoff. However, given the mixed performance of polling in recent elections, there will be some degree of concern until the runoff is held on May 7. The first round will occur on April 23.
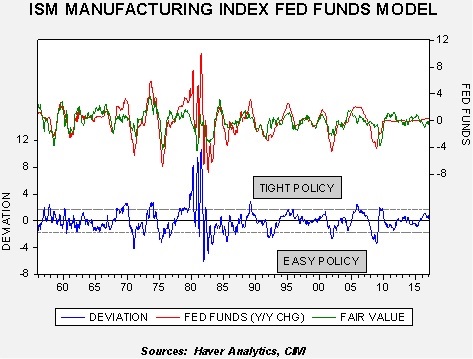
The NAPM remains robust, holding above 57. We are also seeing globally strong manufacturing data, suggesting an improving global economy. One of our alternative models for fed funds uses the NAPM manufacturing data.
The model compares the yearly difference in fed funds to the ISM manufacturing index; the index leads fed funds by six months. Given the time adjustment, this model would project one more rate hike by the end of Q3. Assuming the economy holds recent gains, the model’s forecast would be consistent with three hikes for the year. It also suggests that the FOMC isn’t “behind the curve” as the Phillip’s Curve-based models indicate, such as the Taylor and Mankiw Rules.
We continue to closely monitor the situation in North Korea, especially with Chairman Xi visiting the president in Florida. NBC carried a long interview[1] with Thae Yong Ho, the former Democratic People’s Republic of Korea (DPKR) deputy ambassador to the U.K. Ho warned that the “world should be ready” for some sort of missile attack from the Hermit Kingdom. Adm. Stavridis (Ret), former NATO commander, suggested the current situation is unusually dangerous. First, Kim Jong Un’s grip on the DPKR appears unstable, which accounts for his brutal purge. Second, there is political instability in South Korea due to the impeachment of its president. Third, the Trump administration appears to be aggressive in its tactics with North Korea. Ho suggested that the “young marshal” is capable of anything and his removal from office is the only way to ensure peace. It is rather obvious that the markets are not discounting any degree of flare-up on the Korean peninsula; if they were, the JPY would be significantly weaker because Japan would be a likely target. We view Korea as a “gray swan”; it is a known/unknown, but the degree and timing are uncertain.
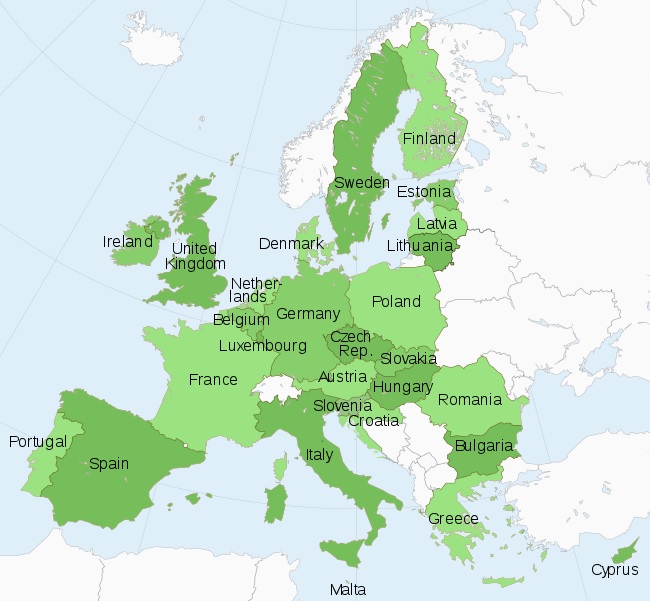
On March 25th, European Union (EU) leaders from 27 nations gathered in Rome to celebrate the 60th anniversary of the founding of the organization. Although the EU currently consists of 28 members, the U.K. was absent due to its recent decision to leave the EU.
On that day in 1957, France, West Germany, Italy, Belgium, Luxembourg and the Netherlands signed the Treaty of Rome, creating the European Economic Community (EEC), which eventually became the EU. Over time, new members joined the group. This map shows the current members.[1]
(Source: EU)
It should be noted that this wasn’t the first attempt at a supranational European body. France proposed the European Defense Community to be comprised of the six original EU members. However, the French failed to ratify the treaty. In 1951, West Germany and France built the European Coal and Steel Community which included the other four founding nations of the later EU and it became a forerunner of the EU. In 1957, the same six nations agreed to cooperate on nuclear power. Still, the EEC is considered the original source of what evolved into the EU.
The primary goal of the EU was to prevent another world war from being fought on European soil. That goal, at least so far, has been successful. The key to meeting this goal was to solve the “German problem.” That issue continues to evolve.
In Part I of this report, we will discuss the German problem and how NATO and the EU were developed in response to resolving that problem. In Part II, we will examine the post-Cold War expansion of the EU, including a discussion of the creation of the euro and the Eurozone. With this background, we will analyze the impact of the 2008 Financial Crisis and the difficulties the EU has faced in dealing with the problems it caused. There will be an analysis of immigration and European security as well. We will look at several proposals being floated in the wake of Brexit about reforming the EU and, as always, conclude with potential market effects.
[1] For the next two years, the U.K. will remain a member. PM May did submit an Article 50 letter on March 29 which begins the two-year process of exiting the EU. It is possible that this deadline could be extended depending on negotiations. Britain is the first nation to exit the EU.
[Posted: 9:30 AM EDT] BREAKING: There was a bombing on a St. Petersburg subway that has killed at least 10 and injured 50. This is still a developing story. Thus far, no group has claimed responsibility. With the recent widespread protests (according to reports, nearly 100 cities have seen some degree of organized protests), we will be watching to see if Putin tries to accuse the protestors of this attack.
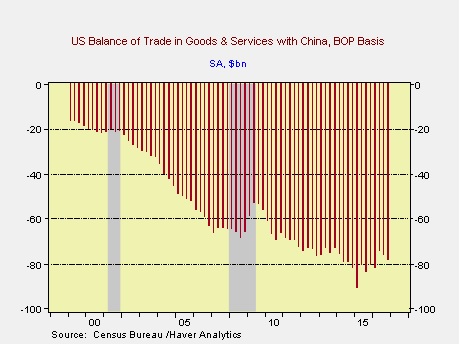
The big event this week is Chairman Xi’s visit to the U.S. He will be with the president in Florida. In a wide-ranging interview over the weekend with the FT, Trump made it clear that the trade deficit with China will be a key topic of conversation.
The bilateral trade deficit was $78.3 bn in Q4; last year, it was $309.8 bn. For comparison’s sake, the deficit last year with the EU was $92.3 bn. It isn’t clear what these negotiations will bring. If we were consulting with Chairman Xi, we would recommend he make expansive promises to engage in direct foreign investment in the U.S. to build plants and equipment. The promise of manufacturing jobs would probably be enough to forestall punitive tariffs. We also expect Xi to be supportive of the president’s family business ties to China.
There has been a spate of articles over the weekend on the growing role of Jared Kushner in the White House. The son-in-law has been given a broad portfolio, including streamlining government, handling relations with China and Mexico and solving the Middle East. A Politico article[1] suggests that Kushner may be cooling on Bannon, who had made a point to befriend Kushner early in the election process, likely perceiving his influence.
According to this and other reports, Kushner is increasingly siding with the establishment, becoming more closely aligned with Gary Cohn. Another Politico article[2] indicates that the White House is planning its own tax reform measure, having decided that relying on Ryan and Congress reduces the president’s control over the process. Reports suggest that the controversial border adjustment tax (BAT) won’t be part of this measure. Details are clearly scarce but killing the BAT will leave a large fiscal hole. Our read is that the president doesn’t really care about deficits and will likely lean on the OMB (which will create a different narrative than the CBO) to dynamically score the tax proposal by goosing growth. Lifting the deficit will be controversial; the most likely outcome is that it will be bearish for long-duration fixed income.
Finally, on the geopolitical front, there were two items of note. In the FT interview, President Trump indicated that the U.S. is willing to “go it alone” on North Korea. It isn’t clear if that means just sanctions or if military action is being considered. None of the military sites we monitor are suggesting a U.S. military mobilization against North Korea. We suspect this is a negotiating ploy to woo China into punishing the Kim regime.
Second, in comments that seemed to come out of the 16th century, a former Conservative leader, Lord Michael Howard, suggested that PM May would be willing to “go to war” against Spain in Gibraltar. Spain lost control of Gibraltar at the 1713 Treaty of Utrecht; voters on “the Rock” are strongly British, voting 18,000-187 on shared sovereignty with Spain. Spain has indicated it would veto any favorable measures for the U.K. during Brexit unless Britain gives up Gibraltar; given that all 27 nations must agree on Brexit, this veto threat is real. Although it is hard to imagine a hot war developing over this issue, as we have noted numerous times, the EU/NATO project was all about preventing war in Europe. The tenor of this spat shows those issues remain despite over 70 years of peace.
Historically, recessions tend to come from three sources—overly tight monetary policy, geopolitical events and inventory overhangs. The latter has mostly become irrelevant due to improved inventory management, leaving overly tight monetary policy and geopolitical events as the typical causes of downturns. As our regular readers know, we monitor both quite closely.
One of the problems with monetary policy is determining “tightness.” Although we have a plethora of models that attempt to calculate the “neutral rate” for fed funds, in reality, the correct neutral rate changes over time due to economic conditions. Again, we usually focus on inflation and the most visible data, such as the employment report and GDP, to gauge the health of the economy. However, we also monitor more obscure numbers which may offer insights into the economy that are not being picked up by the bigger and more common reports.
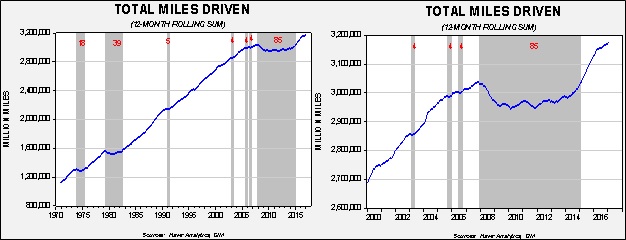
One of these lesser watched metrics tracks vehicle miles driven. The Federal Highway Administration measures how many miles are being driven by all vehicles, including commercial vehicles and passenger cars and trucks. We have found that miles driven are sensitive to economic activity and oil prices.
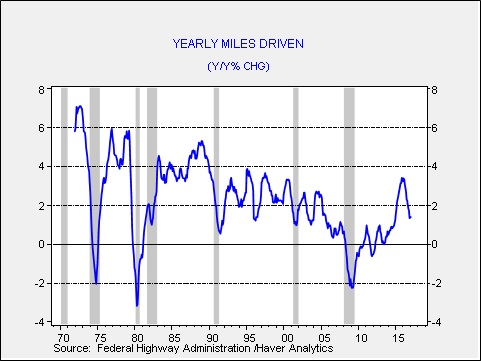
These charts show the same data on different time scales. The left chart shows the rolling 12-month data on vehicle miles driven since the early 1970s. The gray bars indicate periods when the monthly total is not a new peak. Once a new peak is reached, the gray bar ends. Although there have been short-term declines from the peak, there were three significant events seen in 1973-75, 1979-82 and 2007-2014. All three of these events occurred during deep recessions that coincided with high oil prices. The chart on the right shows the data since 2000. Note that we finally reached a new peak in early 2015, just over seven years after the previous high in late 2007.
As the chart on the right shows, in 2014, miles driven began to accelerate, suggesting the economy was improving. However, since Q2 2016, the growth rate in miles driven has started to stall. Although it is still making new highs, the slowdown does raise concerns.
This chart shows the annual change in the 12-month rolling total for vehicle miles driven. Until 2012, negative readings coincided with recessions but only severe ones that also suffered from high oil prices. However, even the 1990-91 downturn, which was part of the oil spike caused by the Iraqi invasion of Kuwait, did not bring a negative reading to this number.
There is a structural trend in the data as well. Note that the level of driving seems to grow at a slower pace during each expansion. The expansion after the 1973-75 recession was 3.8%; the expansion after the 1980-82 recession was 4.1%. However, the subsequent growth rate after the 1990-91 recession was 2.5% and after the 2001 recession was 1.3%. In this expansion, the average growth rate in miles driven is a mere 0.8%. Why are fewer miles being driven? We suspect a number of factors are at work. To some extent, the law of large numbers is having an effect. There are simply constraints to driving that are probably leading to slower growth, namely, road infrastructure and the amount of the population that can afford to own a car. The aging baby boom population is being replaced by Americans who seem to drive less.[1] The advent of social media may reduce the need to drive; baby boomers used to “cruise” to meet friends. The internet allows gatherings to occur without leaving home.
Still, the jump in the data from 2014 into early 2016 and the subsequent slowdown do concern us. This drop could be an early warning that consumers are retrenching; the lack of wage growth may be weighing on household spending. We note that consumption trends are showing slowing growth.
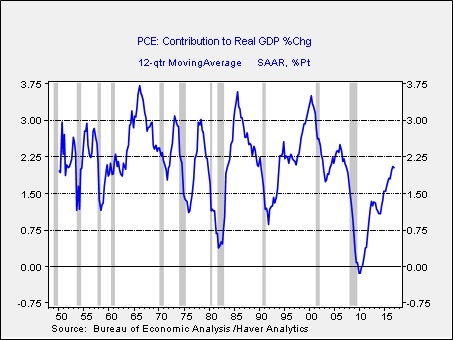
This chart shows the three-year moving average of the contribution to GDP coming from household consumption. The sharp decline in the last recession shows how damaging the last recession was to the household sector. Although the recovery has been robust, the level of growth remains well below previous cycles. In addition, for the past three quarters, the trend contribution level has been stuck at 2%. If this reading fails to accelerate, it would suggest growth will remain slow.
Thus, the miles driven number does suggest some softening in the economy. The slowdown isn’t serious enough to signal an imminent recession, but it should give policymakers pause on moving aggressively on interest rates. If monetary policy remains accommodative, the bullish environment for equities should remain in place.
[Posted: 9:30 AM EDT] Global equity markets had a weak tone overnight but much of that is probably related to quarter-end adjusting. We did see good Chinese data (see below) and sentiment surveys remain robust. For example, the National Association of Manufacturers’ outlook survey hit a new all-time high for the 20-year history of the index. We suspect some of this reflects hopes of trade relief from the Trump administration. The key is whether or not this boost in sentiment, seen in both business and consumer surveys, will translate into real growth. History suggests that we should see a boost to the economy over the next two to three quarters. However, there isn’t much evidence in the actual output data of a robust expansion.
On the trade issue, the administration is starting the push to address the trade deficit. Commerce Secretary Ross and the U.S. trade representative (Robert Lighthizer, who hasn’t been confirmed yet) are expected to conduct a comprehensive study on how foreign nations are taking advantage of the U.S. They are expected to report back to the president in 90 days on their findings. At the same time, Peter Navarro, the head of the newly created National Trade Council, is arguing that there is too much “dumping” occurring that the U.S. isn’t penalizing. Dumping occurs when a nation sells goods and services into the U.S. below the cost of production.
Given the struggles this administration has faced in terms of execution, it remains to be seen if much will come of all this. However, unlike health care and tax reform, there is much the president can do on trade without Congress. And, there are few champions of free trade left in Congress. Thus, we would expect little pushback from the legislature on protectionist measures. The reserve currency issue seems to have eluded this administration. Simply put, the reserve currency nation needs to run a trade deficit or it reduces the global money supply and cuts growth. The global ramifications of trade impediments will be negative for growth.
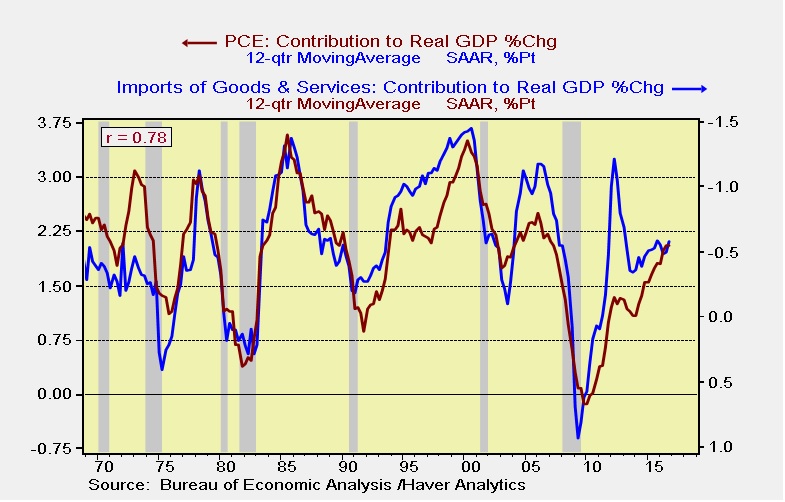
It should be remembered that the quickest way to reduce imports is to weaken consumption.
This chart shows the three-year average contribution to GDP from consumption and imports (imports shown on an inverted scale). The two series are tightly correlated. In general, the causality runs consumption to imports, which means that reducing imports doesn’t necessarily bring down consumption but consumption changes imports. Thus, the attempt to simultaneously boost growth and lower imports probably fails.
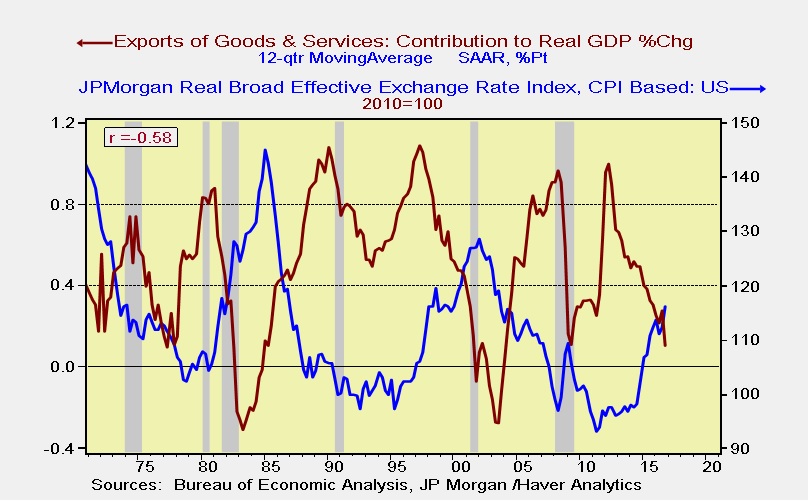
Of course, the other way to reduce the trade deficit would be to lift exports. Exports are always dependent on foreign growth but are also sensitive to the dollar. The Trump administration will likely figure out at some point that a weaker currency is key to narrowing the trade deficit.
Once this realization sets in, we would expect the FOMC to become the target of scorn as it raises rates. If the administration wants a narrower trade deficit, it needs a weaker dollar, which would be helped by easier monetary policy. The Fed raising the policy rate doesn’t support that goal.
We note the president warned, via tweet, that meetings next week with General Secretary Xi will be contentious. The steps the administration is taking with trade probably reflect this warning.
In South Africa, President Zuma has fired his well-respected finance minister, Pravin Gordhan, in a bid to solidify control. As we have noted, this move hasn’t been taken well by the financial markets. Gordhan was seen as a steady leader, one who modified the free-spending habits of Zuma. With Gordhan out of the way, markets fear an inflationary fiscal and regulatory expansion.
[Posted: 9:30 AM EDT] Markets are very quiet this morning. We are seeing the dollar lift in part due to hawkish comments from Fed officials yesterday. For example, Boston FRB President Rosengren called for three more hikes this year; we rate Rosengren as a moderate so his hawkish stance is notable. However, he isn’t a voter this year and we don’t expect the committee to lean against Chair Yellen, who seems content with two more increases. Still, this hawkish talk coupled with soft German inflation data is helping the dollar this morning.
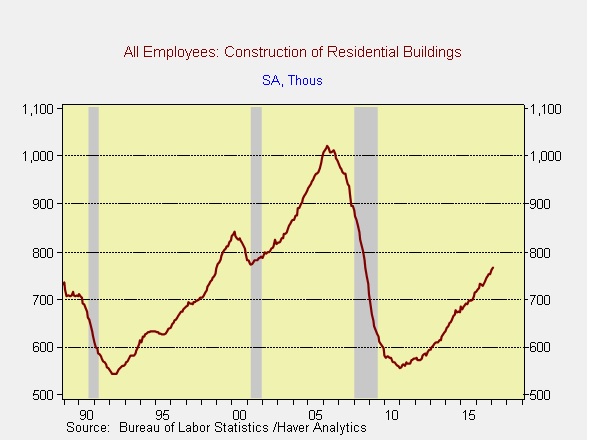
A WSJ editorial is critical of President Trump’s immigration policy, suggesting it is causing shortages of labor and lifting wages. Given that this is one of his goals, we doubt the president will be too concerned with the WSJ’s worry. Still, if labor shortages are developing, we should be seeing it in the data. Since the editorial specifically mentioned construction, we decided to take a look at the numbers.
Residential construction jobs represent 766.9k jobs in the U.S., about 0.6% of total private sector jobs. That number is up 37.7% from the trough in January 2011. Jobs in this category grew 6.5% in February from the previous year. Wage growth is up 3.4% compared to 2.5% for private sector jobs in general.
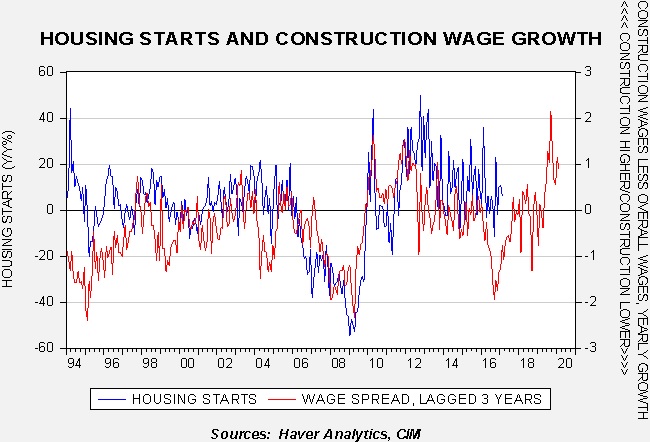
What is interesting in the data is that there appears to be about a three-year lag between construction wage growth relative to overall private sector wage growth and housing starts.
When wages paid to construction workers decline relative to other workers, housing starts decline with a three-year lag. We can’t determine the direction of causality; do starts fall because firms can’t find workers because they are finding better jobs elsewhere, or are relative wages falling because construction activity is soft? Because the relative wage data seems to lead starts, it suggests that relative wage growth drives starts. The current lack of workers that construction firms are anecdotally confirming is probably because three years ago construction wages lagged relative to other professions. The current rise is necessary to lure these workers out of those industries (or across the border, which is more difficult now). The data suggests that the process takes about three years, which makes some sense. If a worker had been in construction, lost his job in the downturn and has found other employment, luring him back to construction will take money and time. In other words, construction firms will need to offer higher wages for a period of time before workers will be willing to return. The data suggests that there could be some weakness in starts before picking up in late 2018 or early 2019. We do want to caution that the wage spread is not a strong determinant of starts—it is only a supply variable and demand variables, like housing affordability and the availability of mortgages, matter more. The bottom line is that we would expect tight labor conditions to persist in construction into next year as long as a recession is avoided.
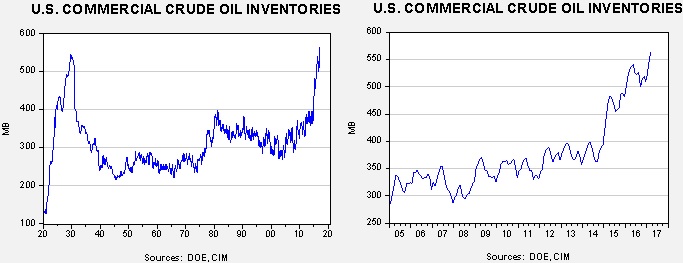
U.S. crude oil inventories rose 0.9 mb compared to market expectations of a 1.4 mb build.
This chart shows current crude oil inventories, both over the long term and the last decade. We have added the estimated level of lease stocks to maintain the consistency of the data. As the chart below shows, inventories remain elevated.
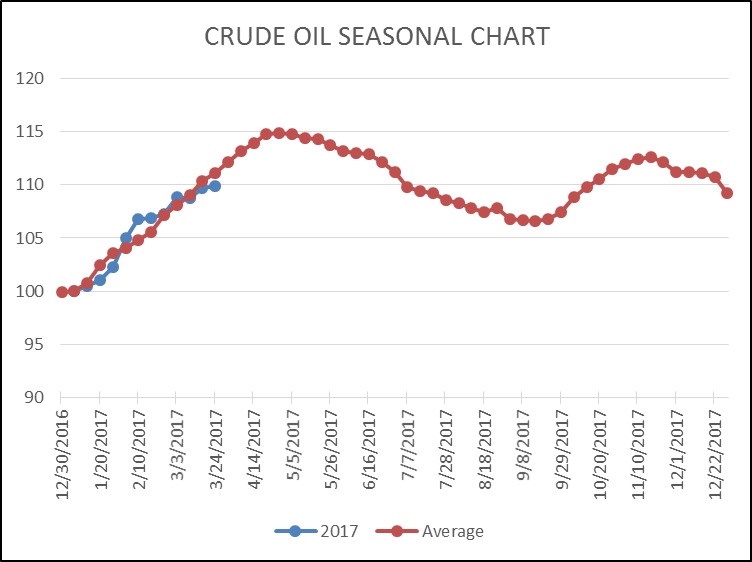
As the seasonal chart below shows, inventories usually increase into April before rising refinery operations for the summer driving season lower stockpiles. This week’s rise puts us further below normal. If we begin to see inventory accumulation slow below normal it would be supportive for prices. Although our models are still quite bearish, slowing inventory builds could portend faster withdrawals later this year and support oil prices.
(Source: DOE, CIM)
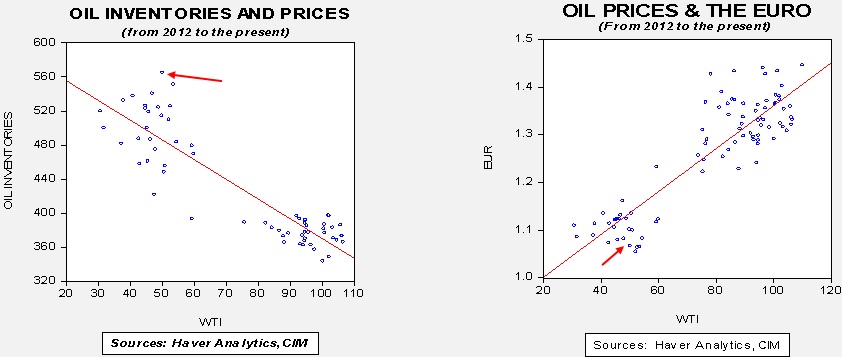
Based on inventories alone, oil prices are overvalued with the fair value price of $27.32. Meanwhile, the EUR/WTI model generates a fair value of $40.14. Together (which is a more sound methodology), fair value is $35.14, meaning that current prices are well above fair value. The data does show that the bullish case for oil mostly rests on a weaker dollar. If the dollar continues to soften, oil may be able to overcome the inventory overhang which should be approaching its seasonal peak.
(Sources: DOE, CIM)
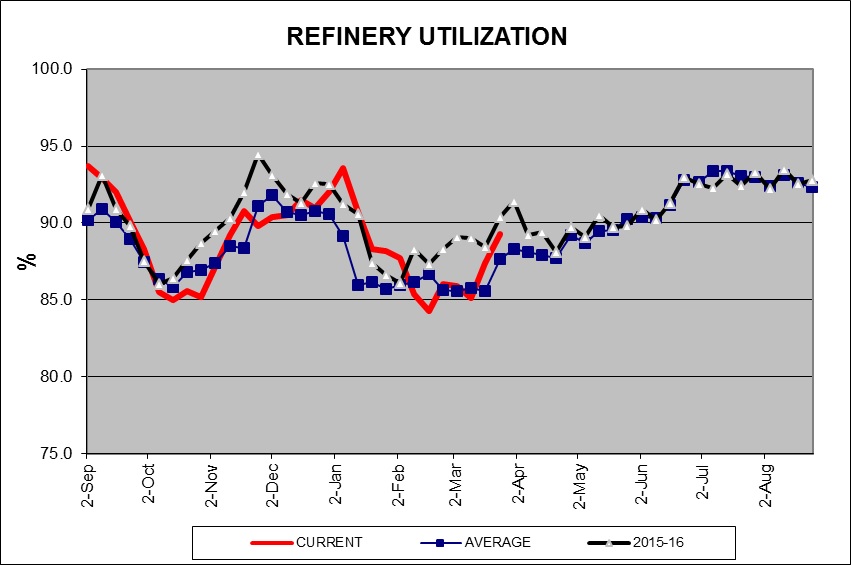
One of the bullish factors we are seeing is a pickup in refinery utilization. History suggests that we will see this number flatten into early May. If that fails to occur, the fundamentals for oil will improve.
[Posted: 9:30 AM EDT] The big news today is no surprise but is still important—PM May formally declared Article 50, beginning the process of the U.K.’s exit from the EU. The law gives both parties two years to work out the exit details. Article 50 has never been used before so the U.K. and the EU are creating the framework for any future nations to leave the EU. The law does allow for extensions, so we may not be finished in two years and a trade deal will probably take much longer to execute. We note that there has been a good bit of speculation on what will occur; most analysts expect this to be a negative event for the U.K., although Brexit supporters suggest the opposite. Because this action is unprecedented, we believe there will be lots of surprises that develop. Here are a few ideas we have been thinking about:
The U.K. government is about to expand. The EU provides regulations for a myriad of industries across Europe. Although members grumble about being restrained by “Brussels,” the fact is that the individual nations reduce governance costs by consolidating regulation. The U.K. will now have to take over this governance. While this will give the U.K. government more control over its economy and society, it will need to build the bureaucracy to actually regulate these activities. Sadly, we expect the EU to require similar regulations for tradeable goods and services, so the new U.K. regulations will likely look much like the ones it had before Brexit. This expansion of government will be expensive and likely lead to higher deficits.
Devolution may follow. Scotland has already started the process for an independence referendum. Northern Ireland is making similar noise. If former nations that were once independent decide they would like to return to the EU, or simply want independence, nations within Europe could split. Given that most nations in Europe have regions that would like more autonomy, other nations may face pressure to either follow the U.K. out of the EU in a bid for more independence or these regions will need to be placated in order to avoid this threat.
A broader rethink of the EU may be developing. Next week’s WGR will look at the EU at 60; on March 25, the EU officially celebrated its 60th birthday. Interestingly enough, there is growing sentiment that the current structure isn’t working and a looser confederation might be more effective. Brexit may turn out to be the turning point that the EU needed to adjust and historians may decide that it was this event that led to a new arrangement for the EU. The tensions within the EU have always been about sovereignty. Simply put, Brexit is a signal that sovereignty is important to nation states and the pseudo-consolidation offered by the EU is no substitute for the nation state.
The role of financial markets is to discount the future—Brexit will be hard to discount and thus market volatility for European assets will probably rise. The current consensus is that Brexit will be negative for the U.K. economy. The weakness in the GBP is part of that expectation.
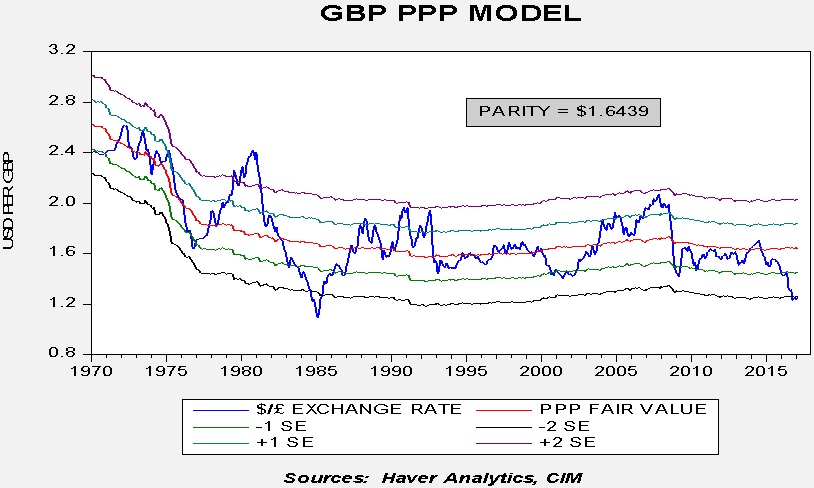
This chart shows the purchasing power parity for the GBP/USD; this model uses relative inflation to establish the valuation of the exchange rate. The current exchange rate, around $1.25, is well below the calculated parity of $1.6439. In fact, this is the second weakest level for the GBP since currencies floated in the early 1970s. The weakness is mostly due to Brexit and fears that it will lead to a much weaker economy. If the U.K. economy manages to avoid a downturn, the currency is quite cheap and could rebound.
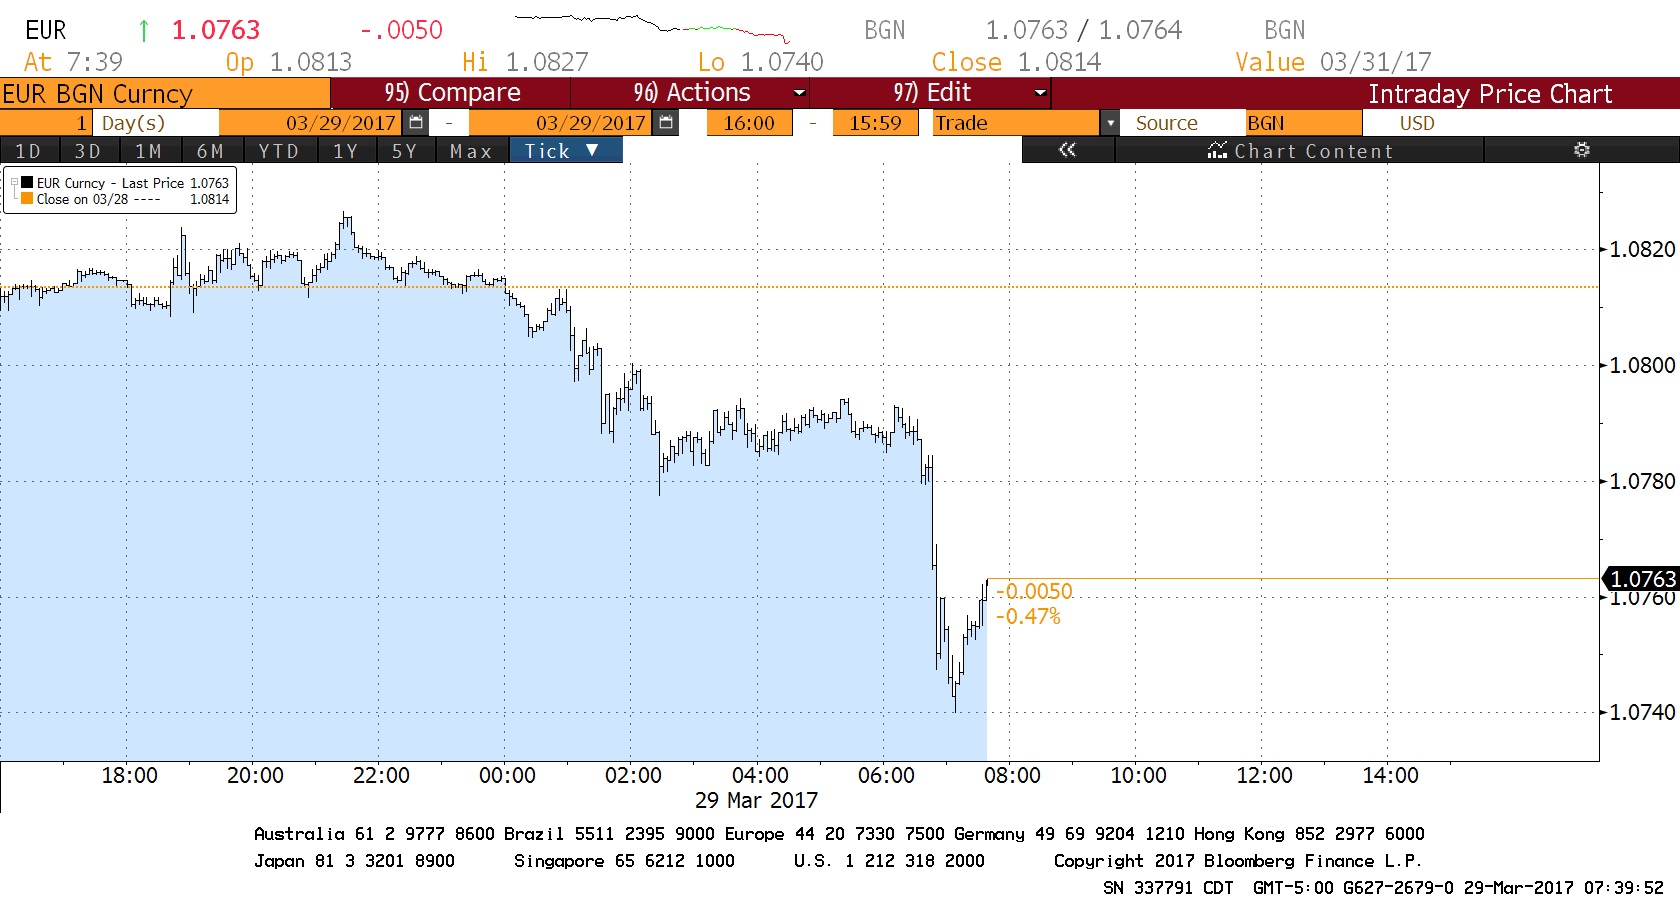
One of the more interesting market actions this morning has been the drop in the EUR.
(Source: Bloomberg)
Note that the EUR/USD rate dropped sharply around the time the letter from May to Donald Tusk, the current EU president, was acknowledged. It has recovered a bit but the market really doesn’t expect Brexit to be bearish for the EUR. In fact, it might be because other nations may leave and the actual membership of the Eurozone could be more fluid than the market expects. Again, this drop may only be temporary, but the fact that the currency sold off was unexpected.
In other news, the GOP is starting to consider its options on tax reform. It will be daunting to execute. Rules require that any use of budget reconciliation, which would allow tax reform to pass through the Senate without 60 votes, needs to be part of a broader budget bill. Since the White House budget was mostly panned it would mean that a new budget would have to be built. Congressional GOP budget plans assumed the repeal of ACA which didn’t happen (perhaps that is why we are hearing members talk about taking another swing at repeal). Another problem is that any tax change created by this process requires a 10-year sunset, which will dampen the effectiveness.
The other way to go about this process is to try to make it bipartisan by appealing to Democrats. Getting to 60 votes in the Senate requires eight Democrats to join with all Republicans. The good part about that course of action is that the tax changes would be permanent unless changed by Congress in the future; the sunset would not occur. The bad news is that this is not a bipartisan environment. We did note yesterday that the president is considering linking tax reform and infrastructure spending together, perhaps to encourage Democrats to go along with tax reform in order to get the infrastructure spending they want. However, if the president insists on not signing one without the other, he risks getting neither.
Tax reform is probably easier than health care reform. However, that doesn’t mean it’s easy. Consequently, the idea that this can be done quickly is probably incorrect.
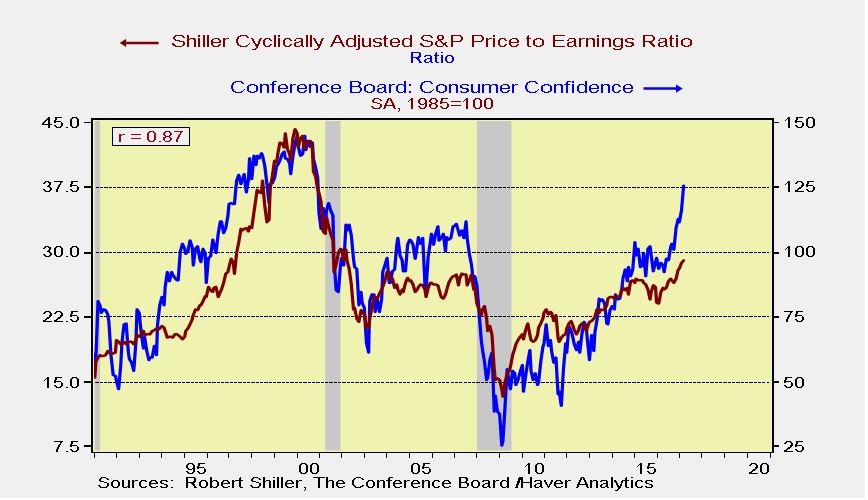
Yesterday, the Conference Board reported that March consumer confidence jumped to a 16-year high. The rise is significant as it should also be supportive for equities.
This chart shows the consumer confidence index along with the Shiller P/E. Since the early 1990s, the two series are highly correlated, around 87%. Although the Shiller P/E is complicated, the rise in consumer confidence suggests that it would be reasonable to expect multiple expansion. A simple model of the Shiller P/E and consumer confidence suggests a P/E of 33.1x relative to the current 29.0x.
Finally, Vice Chair Fischer suggested two more rate hikes this year. We suspect this is the baseline for the FOMC, putting the upper limit of fed funds at 1.50% by December.
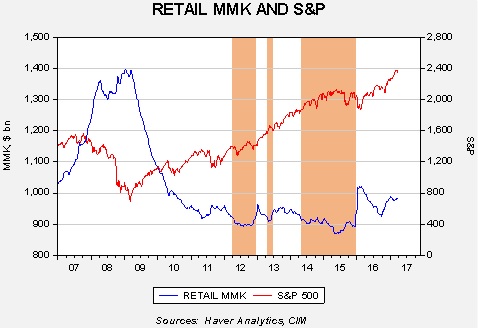
[Posted: 9:30 AM EDT] As we mentioned yesterday, we want to expand our thoughts on equities. Although growing disappointment is a worry regarding the president’s ability to execute his agenda, we do note that cash levels remain elevated.
This chart shows the level of retail money market funds and the S&P 500. The three amber blocks on the chart indicate periods when retail money market levels dipped toward $900 bn. At those levels, the rising trend in equities tends to stall. If investors are so inclined to boost their holdings of equities, it appears that there is ample cash to do so. As we saw in yesterday’s trade, equities opened lower but gradually edged higher during the day; this pattern is usually seen when there are investors waiting for a pullback with liquidity available.
Of course, this indicator does have another side to it; rapidly rising cash levels tend to coincide with declines in equities. Again, this makes sense. If investors are raising cash, they are probably doing so by selling assets, including stocks. We aren’t seeing that now and, barring some sort of panic, we suspect that the downside in equities is probably limited.
In the wake of the health care defeat, President Trump is now signaling that he wants to implement tax reform and infrastructure spending simultaneously. Although we don’t think he means to include them in the same bill, he is attempting to link the two and will probably indicate that he won’t sign one without the other. His thinking seems to be that the Democrats would really like infrastructure spending and the GOP really want lower taxes. If he links the two, he might be able to accomplish both. Although this is a novel idea, and it makes sense as a bargaining position, the problem is that it doesn’t appear that either policy change has been fully developed. Regarding infrastructure, although lists of projects have been drawn up, there isn’t much on funding mechanisms. Meanwhile, the only tax proposal is from Speaker Ryan and it includes the border adjustment tax (BAT), which has little support. There is growing talk that without the revenue from AHCA and BAT, the highest corporate marginal tax rate may only be cut to 28%, which is what President Obama proposed. That is well below the 15% to 20% that had been promised during the campaign. The idea of linkage has merit; however, there is the need for details, which this administration didn’t master with health care.
Yesterday, South African President Jacob Zuma called Finance Minister Pravin Gordhan back from a “road show” for foreign investors. Gordhan was on his first day of a seven-day tour of the U.K. and U.S. There are reports that Zuma wants to fire Gordhan, who has repeatedly prevented Zuma from implementing policies that the former sees as illegal patronage. Zuma has previously tried to fire his finance minister only to back down due to financial system stress. In the wake of this news, we have seen the ZAR weaken.
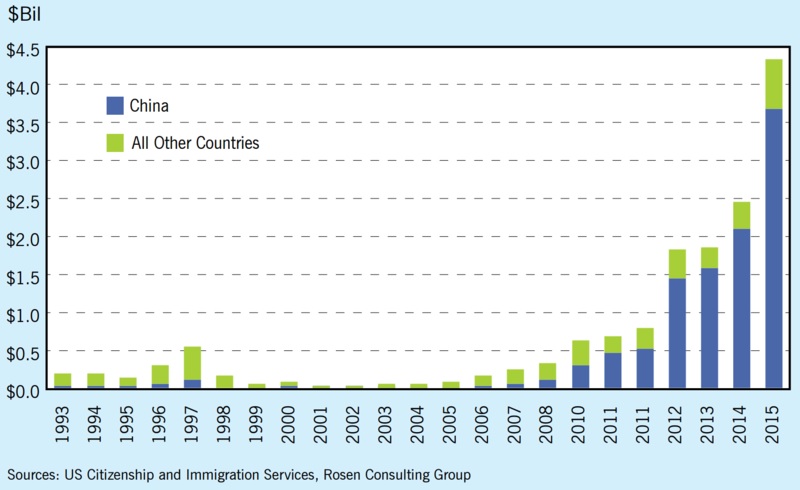
Bloomberg reported over the weekend that Chinese nationals are in a “race to apply for U.S. golden visas,” the EB-5 class. This visa allows any foreign investor to receive a green card who invests $1.0 mm in the U.S. (or $500k in targeted employment areas of high unemployment) that creates 10 jobs. What has spurred interest is that Congress is considering increasing the minimum on targeted employment areas to $1.35 mm (and $1.8 mm for investments outside the targeted employment areas). Chinese citizens can only legally move $50k per year outside of China but that restriction is apparently not all that tight, as this chart can attest. China is clearly the leading source nation for EB-5 visas.
Although this program is a small part of the estimated $728 bn that exited China last year, it is popular with Chinese nationals because it offers an “escape pod.” It is worth noting that Chinese investment in this program tripled in 2012 compared to 2011 when President Xi took office. We don’t know for sure all of the factors driving Chinese capital flight, although we suspect the crackdown on corruption may be part of that desire to move funds abroad. This program of giving a green card is likely an attractive option.
February 12th was the 100-year anniversary of the Russian Revolution. Surprisingly, the Kremlin has taken a very low-key stance on the centenary. We believe the government’s decision to downplay this historical event offers an insight into Russian President Putin’s thinking.
In this report, we will present a history of the Russian Revolution, showing how civil order deteriorated in the years after 1917. We will offer observations of how the Kremlin’s treatment of the revolution reflects Putin’s worldview. As always, we will conclude with potential market effects.
We use cookies to ensure that we give you the best experience on our website. If you continue to use this site we will assume that you are happy with it.