Daily Comment (June 8, 2017)

by Bill O’Grady, Kaisa Stucke, and Thomas Wash

[Posted: 9:30 AM EDT] Welcome to Super Thursday!

Today, there is a slew of geopolitical events that may have an impact on global markets.  In Europe, the ECB will hold a press conference about current and future policy decisions.  In the U.S., former FBI Director James Comey testifies to the Senate Committee about Trump’s influence in the Russia investigation.  In the U.K., there are parliamentary elections to decide the prime minister.

The ECB has decided to hold rates at their current levels and maintain the current level of quantitative easing.  Prior to the press conference, the ECB released a statement that left out the mention of possibly lowering interest rates in the future.  The market has interpreted this as a signal that the ECB is willing to exit the stimulus program.  As mentioned yesterday, the ECB has cut its inflation forecast and revised its GDP forecast higher.  During the press conference, Mario Draghi added that he expects monetary policy to remain the same for an extended period of time, even after the stimulus program ends.  He went on to say that increased momentum in the Eurozone economy shows that risks to the global outlook were broadly balanced, but the momentum has not translated into stronger inflation dynamics.  Draghi warned that global macroeconomic developments still present downside risk and that the ECB is prepared to increase asset purchases if the outlook were to become less favorable or financial conditions become inconsistent.  After the press conference, the euro depreciated against the dollar.

With the release of former FBI Director Comey’s statement that Trump asked him to “lift the cloud” of the investigation by publically stating that Trump was not personally under investigation, Comey’s testimony today could prove to be a bit anti-climactic.  The primary market worry would be that enough information will emerge to further distract the Trump administration from other goals.  We do note that Senate GOP leaders are looking at a health care bill; reports suggest that McConnell will give it a few weeks and, if nothing is done, tax issues will be taken up.  Tax cuts are what the market is mostly concerned over so if the Senate can move forward then it probably means equities will at least hold at current levels.

The other major item today is the British election.  Polls are scattered, with some late polls showing a dead heat, while others show a 10% lead for the Tories.  Our expectation is a Conservative win but no major pickup in seats and thus no expanded mandate.  This isn’t a great outcome but it probably doesn’t move the financial markets.

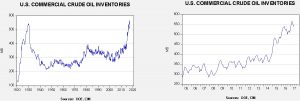
U.S. crude oil inventories unexpectedly rose 3.3 mb compared to market expectations of a 3.5 mb draw.

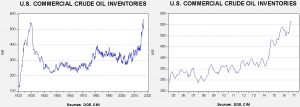
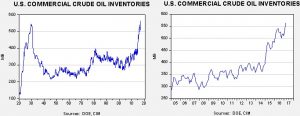
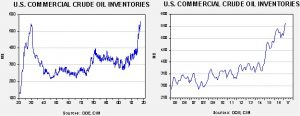
This chart shows current crude oil inventories, both over the long term and the last decade.  We have added the estimated level of lease stocks to maintain the consistency of the data.   As the chart shows, inventories remain historically high but have been declining.  We note that, as part of an Obama era agreement, there was a 1.7 mb sale of oil out of the Strategic Petroleum Reserve.  This is part of a $375.4 mm sale (or 8.0 mb) done, in part, to pay for modernization of the SPR facilities.  International agreements require that OECD nations hold 90 days of imports in storage.  Due to falling imports, the current coverage is near 140 days.  Taking that into account, the build was a less ominous 1.7 mb.

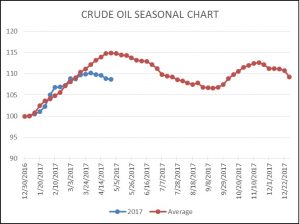
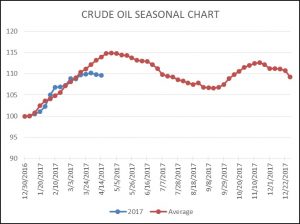
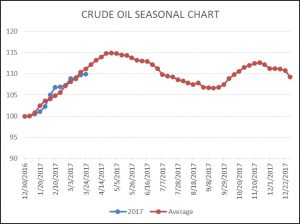
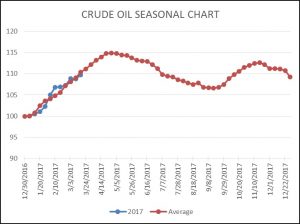
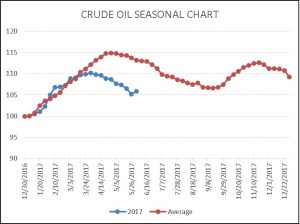
As the seasonal chart below shows, inventories are usually well into the seasonal withdrawal period.  This year, that process began early.  Although the actual level of stockpiles remains quite high, we are seeing stock declines at a rather rapid pace.  Assuming a similar drop from this year’s peak of 566.5 mb at the end of March, we will end up at 505 mb by late September.  In fact, current inventory levels have already declined more than the seasonal trough, which is supportive.  As a result, last week’s rise is something of an anomaly; we would not be surprised to see declines resume next week.
(Source: DOE, CIM)

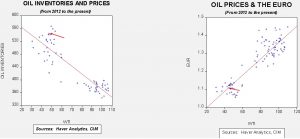
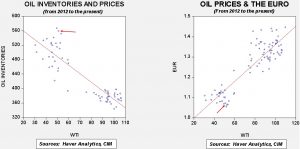
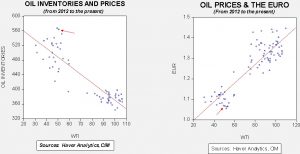
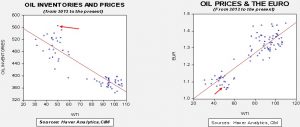
Based on inventories alone, oil prices are overvalued with the fair value price of $37.17.  Meanwhile, the EUR/WTI model generates a fair value of $53.24.  Together (which is a more sound methodology), fair value is $47.34, meaning that current prices are below fair value.  Inventory levels remain a drag on prices but the oil market seems to be ignoring the impact of dollar weakness.  Our position has been that oil prices are in a range between $45 and $55 per barrel and, accordingly, oil is attractive at current levels.  The worries about OPEC shattering over Qatar appear to us to be misplaced.  The cartel has managed to maintain relations with members at war before.  A bigger risk is that a conflict develops that disrupts flows.  It’s not highly likely, but it is more likely than OPEC expanding output based on tensions with Qatar.

View the complete PDF

Daily Comment (May 4, 2017)

by Bill O’Grady, Kaisa Stucke, and Thomas Wash

[Posted: 9:30 AM EDT] The Federal Reserve did just about what we expected; it did acknowledge Q1 economic weakness but expressed no serious concern about slowdown, suggesting that it isn’t all that concerned about future growth.  We note that fed funds futures are placing the odds of a 25 bps rate hike at the June meeting at 90%, up from the low 81% level before the meeting statement.  As long as economic data remains stable, it looks like a second hike is coming in June.

The House is planning to vote on a replacement bill for the ACA; the vote is expected to be close.  Usually, the leadership of the House won’t bring an important bill to a vote if they are not reasonably confident of the outcome.  If the bill passes, it probably won’t become law in its current form as it is highly unlikely the Senate will pass it without major changes.  However, if it fails to pass the House, it will be a defeat of sorts for the White House and perhaps raise concerns that the president is incapable of shepherding anything through Congress.  That outcome might undermine hopes of infrastructure spending and tax cuts.

SOS Tillerson gave a speech yesterday at the State Department laying out the administration’s vision for foreign policy.  He suggested that the U.S. has been “too accommodating” to emerging nations and allies and “things have gotten out of balance.”  We can see the logic of this statement.  The U.S. has been unusually generous for a hegemon on two fronts.  First, for the most part, we have single-handedly enforced peace in the world’s three “hot zones” of Europe, the Far East and the Middle East by putting troops and bases in these regions.  More importantly, we have taken over the security of Europe and Japan, removing the long-standing tensions that led to two world wars in Europe and the constant tensions between China and Japan.  We essentially did the same thing in the Middle East.  This policy has been quite costly in terms of “blood and treasure,” although we would argue that the costs were worth it since we didn’t fight WWIII.  However, without question, much of the world has enjoyed a “free ride” at the expense of American taxpayers and soldiers.

Second, the other element of hegemony has been to provide the reserve currency, which has led to persistent trade deficits and allowed a model of development designed to boost investment and exports, funded by domestic saving.  This topic is under discussion currently in our four-part Weekly Geopolitical Report series.  By being the global importer of last resort, we have bolstered global growth.  However, the cost to Americans has been a gutting of the middle class that has become clearly evident in the political turmoil observed over the past three elections.

What Tillerson didn’t do was explain how the “rebalancing” is going to occur.  Would it be through a reduction of the trade deficit by forcing foreign firms to source production in the U.S., sort of a “tribute” paid to America for access to the dollar?  Would it be by forcing allies to pay more for their own defense?  If allies pay more, can we still control them?  What if Germany rearms and decides to collect bad Greek debt by taking a few islands?

We can see the need for changes to American hegemonic policy.  However, a clear path isn’t obvious; in fact, it’s fraught with risk.  We are already seeing the results of “thawing” the frozen conflict in the Middle East.  The territorial integrities of both Syria and Iraq are mostly broken and we don’t know what will replace them.  Islamic State was the first attempt; that wasn’t such a great outcome.  An adjustment is necessary.  We believe the policies used since WWII have probably become politically impossible to maintain, but it isn’t known what can effectively replace those policies.  Until they are replaced, uncertainty will remain elevated.

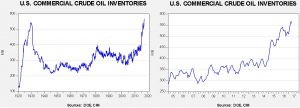
U.S. crude oil inventories fell 0.9 mb compared to market expectations of a 3.3 mb draw.

This chart shows current crude oil inventories, both over the long term and the last decade.  We have added the estimated level of lease stocks to maintain the consistency of the data.  As the chart shows, inventories remain historically high but have started the seasonal withdrawal phase.  We also note that, as part of an Obama-era agreement, there was a 1.5 mb sale of oil out of the Strategic Petroleum Reserve.  This is part of a $375.4 mm sale (or 8.0 mb) done, in part, to pay for modernization of the SPR facilities.  International agreements require that OECD nations hold 90 days’ worth of imports in storage.  Due to falling imports, the current coverage is near 140 days.  Taking that into account, the draw would have been 2.4 mb, roughly in line with expectations.

As the seasonal chart below shows, inventories are near their seasonal peak and should begin falling as rising refinery operations lower stockpiles.  This week’s decline rise puts us further below normal.  Although inventories remain high, this seasonal level is consistent with July, meaning that we may be on the way to an easing of the inventory overhang.  Last year, we saw a 45 mb draw from the April peak.  Assuming a similar drop from this year’s peak of 566.5 mb at the end of March, we will end up at 520 mb by late September.  Assuming a $1.09 EUR and using the model discussed below, fair value is $44.15 for oil prices.  Thus, we would need to see a much larger drop to justify current prices.

(Source: DOE, CIM)

Based on inventories alone, oil prices are overvalued with the fair value price of $31.03.  Meanwhile, the EUR/WTI model generates a fair value of $41.57.  Together (which is a more sound methodology), fair value is $37.68, meaning that current prices are well above fair value.  To a great extent, it appears that the oil market has already discounted a drop in inventory levels and a weaker dollar.

View the complete PDF

Daily Comment (April 20, 2017)

by Bill O’Grady, Kaisa Stucke, and Thomas Wash

[Posted: 9:30 AM EDT] The euphoria surrounding the election of President Trump appears to be waning.  Although the sentiment polls remain elevated, we note the fixed income markets are clearly showing some jitters.

(Source: Bloomberg)

This chart shows the two-year/10-year Treasury spread.  Although the curve is steeper than it was prior to the election, it has been flattening rather rapidly recently.  If this isn’t arrested soon, worries over the economy will increase and likely weigh on risk assets.

There were massive protests in Venezuela yesterday as those opposed to President Maduro braved security officials and the irregular Maduro forces armed by the president to call for elections and democratic reforms.  At least seven people died.  More rallies are expected today.  Oil production appears to be down to 2.0 mbpd; the country was traditionally a 3.0 mbpd producer.  Unrest there is a minor, but supportive factor, for crude oil prices.

U.S. crude oil inventories fell 1.0 mb compared to market expectations of a 1.7 mb draw.

This chart shows current crude oil inventories, both over the long term and the last decade.  We have added the estimated level of lease stocks to maintain the consistency of the data.  As the chart shows, inventories remain historically high.

As the seasonal chart below shows, inventories are near their seasonal peak and should begin falling as rising refinery operations lower stockpiles.  This week’s decline puts us further below normal.  Although inventories remain high, this seasonal level is consistent with July, meaning that we may be on the way to an easing of the inventory overhang.

(Source: DOE, CIM)

Based on inventories alone, oil prices are overvalued with the fair value price of $29.65.  Meanwhile, the EUR/WTI model generates a fair value of $40.35.  Together (which is a more sound methodology), fair value is $36.43, meaning that current prices are well above fair value.

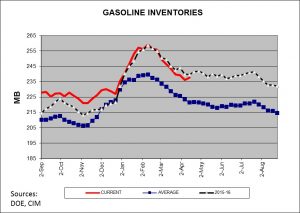
Yesterday, oil prices fell sharply, with the rise in gasoline inventories cited as the catalyst.  Although gasoline inventories usually decline from their February peaks, the pace of the decline is reaching its nadir and stockpiles normally stabilize through the summer.

This chart shows gasoline inventories.  The five-year average shows the seasonal pattern; however, this year’s data is closely tracking last year.  If this pattern continues, we will see mostly steady inventory levels until late July.  That isn’t necessarily bad news for oil prices but it isn’t supportive, either.

Saudi Arabia is pressing OPEC to extend its production cuts and there are reports that the cartel is going along with it.  This is the factor keeping prices higher.  At the same time, rising U.S. production is taking share away from OPEC.  As we have stated before, the oil market is being supported by what we would describe as epic “window dressing” in front of the Saudi Aramco IPO next year.

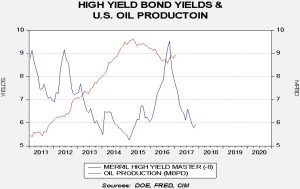
A secondary factor helping U.S. oil production, beyond OPEC propping up oil prices, is lower yields on junk bonds.

Since 2011, the correlation is a respectable -55% between the two series, with yields leading production by eight months.  Obviously, oil prices play a larger role but the combination of higher oil prices and a favorable financing environment will tend to support higher U.S. production.  Although higher U.S. output may be modestly negative for oil prices, it is supportive for U.S.-oriented oil producers…at least until the Saudis decide to retake market share.

View the complete PDF

Daily Comment (March 30, 2017)

by Bill O’Grady, Kaisa Stucke, and Thomas Wash

[Posted: 9:30 AM EDT] Markets are very quiet this morning.  We are seeing the dollar lift in part due to hawkish comments from Fed officials yesterday.  For example, Boston FRB President Rosengren called for three more hikes this year; we rate Rosengren as a moderate so his hawkish stance is notable.  However, he isn’t a voter this year and we don’t expect the committee to lean against Chair Yellen, who seems content with two more increases.  Still, this hawkish talk coupled with soft German inflation data is helping the dollar this morning.

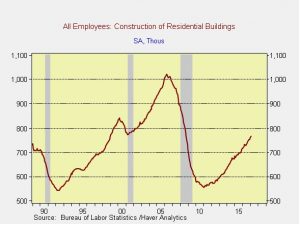
A WSJ editorial is critical of President Trump’s immigration policy, suggesting it is causing shortages of labor and lifting wages.  Given that this is one of his goals, we doubt the president will be too concerned with the WSJ’s worry.  Still, if labor shortages are developing, we should be seeing it in the data.  Since the editorial specifically mentioned construction, we decided to take a look at the numbers.

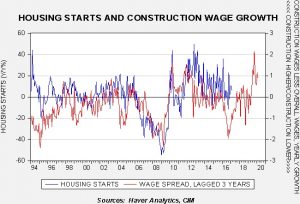
Residential construction jobs represent 766.9k jobs in the U.S., about 0.6% of total private sector jobs.  That number is up 37.7% from the trough in January 2011.  Jobs in this category grew 6.5% in February from the previous year.  Wage growth is up 3.4% compared to 2.5% for private sector jobs in general.

What is interesting in the data is that there appears to be about a three-year lag between construction wage growth relative to overall private sector wage growth and housing starts.

When wages paid to construction workers decline relative to other workers, housing starts decline with a three-year lag.  We can’t determine the direction of causality; do starts fall because firms can’t find workers because they are finding better jobs elsewhere, or are relative wages falling because construction activity is soft?  Because the relative wage data seems to lead starts, it suggests that relative wage growth drives starts.  The current lack of workers that construction firms are anecdotally confirming is probably because three years ago construction wages lagged relative to other professions.  The current rise is necessary to lure these workers out of those industries (or across the border, which is more difficult now).  The data suggests that the process takes about three years, which makes some sense.  If a worker had been in construction, lost his job in the downturn and has found other employment, luring him back to construction will take money and time.  In other words, construction firms will need to offer higher wages for a period of time before workers will be willing to return.  The data suggests that there could be some weakness in starts before picking up in late 2018 or early 2019.  We do want to caution that the wage spread is not a strong determinant of starts—it is only a supply variable and demand variables, like housing affordability and the availability of mortgages, matter more.  The bottom line is that we would expect tight labor conditions to persist in construction into next year as long as a recession is avoided.

U.S. crude oil inventories rose 0.9 mb compared to market expectations of a 1.4 mb build.

This chart shows current crude oil inventories, both over the long term and the last decade.  We have added the estimated level of lease stocks to maintain the consistency of the data.   As the chart below shows, inventories remain elevated.

As the seasonal chart below shows, inventories usually increase into April before rising refinery operations for the summer driving season lower stockpiles.  This week’s rise puts us further below normal.  If we begin to see inventory accumulation slow below normal it would be supportive for prices.  Although our models are still quite bearish, slowing inventory builds could portend faster withdrawals later this year and support oil prices.

(Source: DOE, CIM)

Based on inventories alone, oil prices are overvalued with the fair value price of $27.32.  Meanwhile, the EUR/WTI model generates a fair value of $40.14.  Together (which is a more sound methodology), fair value is $35.14, meaning that current prices are well above fair value.  The data does show that the bullish case for oil mostly rests on a weaker dollar.  If the dollar continues to soften, oil may be able to overcome the inventory overhang which should be approaching its seasonal peak.

(Sources: DOE, CIM)

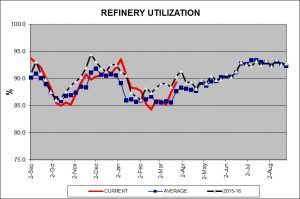
One of the bullish factors we are seeing is a pickup in refinery utilization.  History suggests that we will see this number flatten into early May.  If that fails to occur, the fundamentals for oil will improve.

View the complete PDF

Daily Comment (March 23, 2017)

by Bill O’Grady, Kaisa Stucke, and Thomas Wash

[Posted: 9:30 AM EDT] Yesterday, there was a terrorist attack near Parliament in the U.K.  Five people were killed (including the terrorist) and around 40 injured.  Although reports suggest the attacker, who hasn’t been named yet, acted alone, eight others have been arrested.  This attack followed the pattern where the terrorist uses a vehicle to attack pedestrians in a busy area and then uses a weapon in an attempt to escape or expand the attack.  This mode was recently used in France and Germany.  We suspect this method is being used because security in Europe has been tightened.  For example, it may be more difficult to gather materials commonly used in bomb making because they are being tracked more closely.  However, cars and trucks are ubiquitous and it’s hard to see how security forces can stop their use.  It is noteworthy that many important public venues have been hardened; for instance, the number of barriers around Washington would tend to thwart vehicle attacks.  But, hardening all areas would be almost impossible.

PM May did say the unnamed attacker had been known to MI-5, Britain’s internal security service (roughly equivalent to the FBI).  However, being known and being stopped are clearly two different things.  So far, all indications suggest this attacker was inspired, but probably not directed, by foreign jihadists.

What we found interesting about the attack was the market reaction, which was quite mild.  Financial markets tend to follow a pattern where the first time an event occurs, it’s a huge deal, while each successive event becomes less significant.  Although one could argue that the scale wasn’t all that big in this attack (relative to 9/11, for example), the act was still designed to terrorize.  That part probably worked.  But, financial markets are viewing these events in the proper context—they are something that one hopes shouldn’t happen but the single event doesn’t threaten the stability of the Western world.

There are reports that the American Health Care Act (AHCA) has been changed enough for the majority of the Freedom Caucus to vote for the bill.  According to reports, senior members of this caucus will meet with the president at 11:00 EDT today.  We believe that these changes make it almost certain to have no hope of getting through the Senate.  If the bill fails in the House, we will likely see a knee-jerk decline in equities on fears that this loss will scotch tax reform.  We tend to disagree with this assessment; instead, the president and Congress can simply move on to taxes.  Health care is a quagmire; it would have made more sense to focus on tax reform first.  We realize that there were hopes that some of the savings from health care reform could have been used to fund tax cuts, but that was always a long shot.  If Ryan and Trump pivot to taxes after the AHCA passes the House but dies in the Senate, or simply dies, the drop in equities will probably be more of a welcome correction.[1]

U.S. crude oil inventories rose 5.0 mb compared to market expectations of a 3.0 mb build.

This chart shows current crude oil inventories, both over the long term and the last decade.  We have added the estimated level of lease stocks to maintain the consistency of the data.  As the chart shows, inventories remain elevated.

As the seasonal chart below shows, inventories usually increase into April before rising refinery operations for the summer driving season lower stockpiles.  We did see refinery activity rise this week, which is a welcome sign.  This week’s rise puts us just below normal.  We saw a sharp rebound in crude oil imports that boosted inventories, reversing last week’s import weakness.  So far, the numbers continue to indicate that we have about another month of inventory accumulation before oil inventories start their seasonal decline.

(Source: DOE, CIM)

Based on inventories alone, oil prices are overvalued with the fair value price of $27.59.  Meanwhile, the EUR/WTI model generates a fair value of $39.81.  Together (which is a more sound methodology), fair value is $34.96, meaning that current prices are well above fair value.  The data does show that the bullish case for oil mostly rests on a weaker dollar.  If the dollar continues to soften, oil may be able to overcome the inventory overhang which should be approaching its seasonal peak.

View the complete PDF

_____________________________________

[1] Or, to use the parlance of a former colleague, a “pause to refresh.”

Daily Comment (March 16, 2017)

by Bill O’Grady, Kaisa Stucke, and Thomas Wash

[Posted: 9:30 AM EDT] The Dutch elections reflected recent polling that showed declining support for Geert Wilders.  However, despite media commentary suggesting that populism has been halted on the continent, a second look suggests that it’s not quite that simple.  To recap, Wilders’s PVV party gained five seats, winning 20 out of the 150 seats in the lower house.  Mark Rutte’s VVD is the largest party, at 33 seats; however, he lost eight seats compared to the last election.  The right-wing CDA party, a traditional Christian-Democratic party, gained six seats and now has 19 seats.  The D66 party also won 19 seats, gaining seven.  It is mostly a centrist party that has one primary goal, a more direct democracy.  The Greens also did well, gaining 10 seats for a total of 14.  The Socialists, a hard-left party, lost one seat, holding 14 in the new parliament.  The big loser was Labor, which lost 29 seats for a total of nine.

Essentially, as we have seen in the U.S. and U.K., the center-left is struggling.  On the left side of the political spectrum, there is more support for harder left policies and so there was more support for the Greens and other fringe leftist parties.  The more traditional rightist parties won, to some extent, by moving to the populist right to stunt the appeal of the PVV.  This is the usual pattern; the established parties have a tendency to co-opt the ideas of emerging parties to blunt their influence.  Thus, what we see from this election is that the populist movement is being slowed as the established parties learn to incorporate the goals of the populists into the mainstream.  This may mean moderate immigration controls in the case of the Netherlands.  The likely PM Mark Rutte noted after his win that Dutch voters said “no to the wrong sort of populism,” but it’s worth noting that he didn’t see his victory as a defeat of populism.  It is quite likely that the row the Netherlands had with Turkey ended up making Rutte appear more populist as it may have helped him seem more anti-Muslim.

To have a majority government, Rutte will need to cobble together a coalition of 76 seats.  Since the PVV won’t be part of any government, the more right-wing parties, the CDA and D66, will only get him to 71 seats.  He may add the CU party, a Calvinist, socially conservative party which has five seats, but currently this party is in the official opposition.  We expect it to take several months before a government is formed.

Overall, this election likely tells us that populism is still a force in Europe but is being managed by the established parties.  That may mean some retreat on open borders and globalization but may preclude a wholesale rejection of these factors.

Although the BOJ and SNB made no changes to policy, as expected, we did get a surprise of sorts from the BOE.  Policy was left unchanged, but there was one dissent on interest rates.  One of the members called for a rate hike of 25 bps due to continued strength in the economy.  After Brexit, there was a general consensus that the economy would weaken and the British central bank would need to lower rates.  However, at least so far, it appears that Brexit hasn’t been all that negative for the U.K. and that the GBP’s decline was probably more stimulative than expected.  If the BOE is moving to raise rates, the bearish forecasts for the GBP are probably wrong and the currency could recover.

The FOMC, as expected, raised rates 25 bps.  Despite the rate hike, the wording of the statement was not materially different than the February statement.  Minneapolis FRB President Kashkari dissented, calling for no change in rates.  Finally, the worry that we may see four rate hikes this year was put to rest—the dots chart signals that the central bank is only projecting two more hikes for the year.

(Source: Bloomberg)

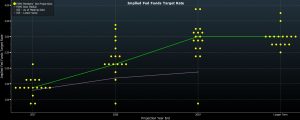
This is Bloomberg’s dots chart along with the median of the dots (the green line) and the Eurodollar’s expectation for fed funds.  Although the FOMC is clearly looking for more rate increases than the market in 2018 and beyond, they are quite close for this year.  The median is looking for 1.375% by year’s end, which would be the midpoint between 1.25% and 1.50%, a clear signal that only two more hikes are expected for this year.

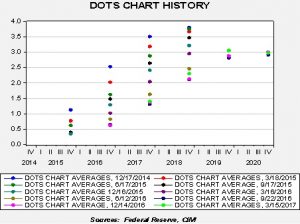
To get a flavor for the Fed’s projections, here is the average dots projected by meeting.

The lime green dot reflects yesterday’s data.  For this year, there is clear agreement on two more hikes.  This meeting suggests a modest increase in expectations but nothing significant.  Both this chart and the Bloomberg chart above are clearly suggesting that the terminal rate for the fed funds target is 3.00%.

If that is the terminal rate and core inflation holds around 2.00%, a case can be made that the expansion will continue.

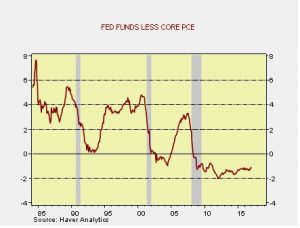
This chart shows the effective fed funds rate less core PCE.  The data is for January since the PCE hasn’t been released, but assuming core inflation remains around 1.75%, even with the 25 bps increase, the real rate is only -0.83%.  The last three business cycles ended with positive real fed funds.  Granted, we are seeing a steady cascade lower with each business cycle but, even assuming a modest decline in the “danger” rate, let’s say 2.00%, if the Fed has a core PCE of 2.00% a recession would be triggered with a fed funds target of 4.00%.  According to the dots chart, that simply may not occur.  Of course, figuring out the level of tolerance for real rates and the economy isn’t an exact science, but the U.S. economy is in deep structural trouble if a mere 1.00% real fed funds rate ends this expansion.

Clearly, the financial and commodity markets liked the news; a rally in both bonds and stocks suggests the markets feared a more hawkish central bank.  In addition to the strength in equity and debt, gold rose and the dollar dipped.  Fears that the FOMC was preparing to raise rates rapidly have been mostly quelled.  A terminal rate of 3.00% means roughly three hikes each year for 2018 and 2019.  As the dots chart suggests, the financial markets really don’t expect that to occur but the remaining two hikes for this year are fully expected.

View the complete PDF

Daily Comment (February 9, 2017)

by Bill O’Grady, Kaisa Stucke, and Thomas Wash

[Posted: 9:30 AM EST] One of the political factors we watch with a new president is the management of political capital.  Political capital is essentially the goodwill, the mandate, which comes from winning an election.  Although not a hard and fast figure, it does appear to exist, can be depleted and has a “sell-by date.”  In general, by the 18th month of the first term, the capital is exhausted even if it isn’t spent.  By that time, Congress is gearing up for the midterm elections and the president’s goals and aspirations become secondary to the desire for reelection.

Essentially, it’s all about first understanding the strength of the mandate and “spending” it wisely.  In my recollection, no president is perfect in this area.  In the sweep of the moment, it’s easy for a president to think he can do more than he is actually able and to get distracted by side issues that consume more time, effort and political capital than the issues warrant.  It’s also critically important for a president to understand the environment.  All Democratic Party presidents pine for the expansion of health care; Republicans for entitlement changes.  Attempting to achieve these changes tends to consume a lot of political capital and it’s hard to get much else accomplished.

President Trump is something of an enigma.  It is difficult to measure how much political capital he has given the size of his popular vote.  At the same time, he is so unconventional that he may have more than normal.  However, history would suggest his capital isn’t infinite and it probably remains perishable.  This means that we have to closely watch the allocation of political capital to policy and personnel.

After the November election, both the right-wing populists and the center-right establishment had their wish lists and both seemed to believe most of their goals would be fulfilled.  Financial markets clearly believed that tax reform and rate reductions were coming and regulatory rollbacks were likely.  Equity markets rallied, interest rates rose and the dollar jumped.  At the same time, the right-wing populists were expecting immigration reform, infrastructure spending and trade restrictions.  Trump is clearly trying to satisfy both constituencies while also trying to fill positions to build an administration.  Our concern is that he is experiencing a significant “capital burn.”  At some point, he is going to have to start choosing his battles more carefully to conserve his political capital and accomplish his goals.  We suspect this is going to require some degree of discipline that, at this juncture, seems to be lacking.  Without discipline, he stands to disappoint both wings of his constituency due to ineffective management and opposition from Democrats.

Here is an indicator that may offer some insight into the concept of political capital.

(Source: Bloomberg)

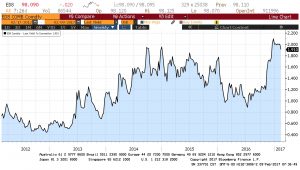
This chart shows the implied yield from the Eurodollar futures contract, two years advanced.  Essentially, it’s the market’s estimate of what three-month LIBOR will be in two years.  Note that the yield soared after the election, jumping nearly 90 bps in the first few weeks after November 9.  We believe the rate jumped on expectations that Trump’s fiscal stimulus would boost the economy and lead to tighter monetary policy.  However, we are starting to see the implied rate pull back, suggesting the financial markets are reassessing just how much he will be able to accomplish.

If our analysis is correct, the implied rate should rise if Trump’s policy goals begin to accelerate.  This is especially true if tax cuts and fiscal spending are implemented.  That would also lift long-duration Treasury yields and the dollar.  However, if the implied yield continues to fall, it would suggest the financial markets are discounting less stimulus and slower policy tightening.  This could lead to lower long-duration Treasury yields and dollar weakness.

View the complete PDF

Daily Comment (February 2, 2017)

by Bill O’Grady, Kaisa Stucke, and Thomas Wash

[Posted: 9:30 AM EST] There’s a lot going on this Groundhog Day,[1] so let’s get started:

The Fed: The FOMC meeting was a clear non-event.  Almost none of the language changed and the new committee didn’t give us any hints that it is prepared to raise rates any faster than what the market currently expects.  This suggests that, at least officially, the Fed is comfortable with its current views and positions on the economy and sees no reason to change its policy trajectory.  Informally, it probably means that Chair Yellen isn’t prepared to get the attention of the White House until she is really comfortable with her policy decision.  The lack of tightening signals led the dollar lower which has continued this morning.  Chair Yellen does give her semi-annual testimony to Congress on February 14-15 and that may offer better insights into the Fed’s thinking.

The BOE: The BOE also left policy unchanged even though inflation and growth have been improving in the U.K.  The bank appears worried about a drag on growth from Brexit and thus is keeping policy easy.  However, inflationary pressures coming from the weaker GBP may eventually lead the BOE to begin raising rates or reducing QE.

An Iranian “red line”?  National Security Advisor Flynn spoke to the press yesterday indicating that the administration is “officially putting Iran on notice” over its recent missile test.  According to reports, the administration is considering “a large number of options”; there was no indication whether military action is being considered or ruled out.  The test does not violate the nuclear deal which, by itself, does not include provisions on missile tests.  However, the test likely defies the U.N. Security Council Resolution 2231, which does not allow Iran to test any missile capable of transporting a nuclear warhead.  This recent test is at least the second; the last one was thought to have occurred in July.  The Trump administration is signaling it won’t be as tolerant as the Obama administration on these issues and the diplomatic agreements.  The key unknown is whether this issue will escalate.  If fears of a shooting war rise, gold, oil and Treasuries are the most likely beneficiaries.  Given the strong tone of the objection coming from the Trump administration, some sort of response is required.  Otherwise, it could fall into the same trap the previous administration found itself in with Syria when a “red line” was violated but the Obama government failed to respond.  This lack of response arguably reduced U.S. influence not only in the Middle East but in other areas as well.

Who is leaking these transcripts?  The comments from two seemingly contentious phone calls by President Trump, one to Australian PM Turnbull and the other to Mexican President Nieto, have turned up in the press.  In the former, the two leaders argued about a refugee agreement made between the Obama administration and Turnbull which would allow 1,250 refugees who are stuck on the islands of Nauru and Manus.  Many of these souls are from the seven nations subject to restrictions by the recent executive order.  President Trump was apparently upset by the deal and is indicating that these refugees will, at a minimum, be facing “extreme vetting.”  Second, a transcript from a call with Presidents Trump and Nieto seemed to imply that the former is considering sending U.S. troops into Mexico to attack “tough hombres.”  We wonder how these transcripts are being leaked.  Is this being done deliberately by the White House to signal potential policy actions?  Or does the administration have a “mole” trying to expose the new government?  This is an issue we will continue to monitor.

The French elections:  Wikileaks has dumped 3,630 documents from the conservative (center-right) candidate François Fillon.  So far, nothing too salacious has been uncovered but there are fears that the group, led by Julian Assange, is trying to affect the outcome of the French election.  As we noted earlier, Fillon could be facing an investigation over allegations that he paid his wife to work as an administrator when in fact she did nothing.  Nepotism is not illegal in France but paying people not to work apparently does violate the law.  There are growing calls for Fillon to step down and allow another conservative to run in his place.  His polling numbers are falling and, if the election were held today, there is a chance that the two largest vote winners would be the National Front’s Le Pen and Emmanuel Macron, who is running as an independent.  There are worries that such an outcome would favor Le Pen, since Macron would not have a party apparatus supporting his bid for the presidency.  The fear in France is that the Kremlin, through Assange, is trying to put another Russian-friendly leader in a major Western government.  Le Pen has been a supporter of Russia, suggesting the Russian annexation of the Crimea was “legal.”  Le Pen has indicated she would likely favor “Frexit” and would almost certainly try to leave the Eurozone.

View the complete PDF

__________________________________

[1] Test your Groundhog Day movie skills with this quiz!  http://www.stltoday.com/news/multimedia/groundhog-day-movie-quiz/html_b728cd22-4db4-11e1-8e5c-001a4bcf6878.html