

Asset Allocation Weekly (March 31, 2017)
by Asset Allocation Committee
Historically, recessions tend to come from three sources—overly tight monetary policy, geopolitical events and inventory overhangs. The latter has mostly become irrelevant due to improved inventory management, leaving overly tight monetary policy and geopolitical events as the typical causes of downturns. As our regular readers know, we monitor both quite closely.
One of the problems with monetary policy is determining “tightness.” Although we have a plethora of models that attempt to calculate the “neutral rate” for fed funds, in reality, the correct neutral rate changes over time due to economic conditions. Again, we usually focus on inflation and the most visible data, such as the employment report and GDP, to gauge the health of the economy. However, we also monitor more obscure numbers which may offer insights into the economy that are not being picked up by the bigger and more common reports.
One of these lesser watched metrics tracks vehicle miles driven. The Federal Highway Administration measures how many miles are being driven by all vehicles, including commercial vehicles and passenger cars and trucks. We have found that miles driven are sensitive to economic activity and oil prices.
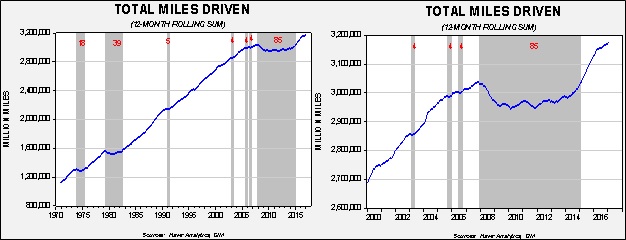
These charts show the same data on different time scales. The left chart shows the rolling 12-month data on vehicle miles driven since the early 1970s. The gray bars indicate periods when the monthly total is not a new peak. Once a new peak is reached, the gray bar ends. Although there have been short-term declines from the peak, there were three significant events seen in 1973-75, 1979-82 and 2007-2014. All three of these events occurred during deep recessions that coincided with high oil prices. The chart on the right shows the data since 2000. Note that we finally reached a new peak in early 2015, just over seven years after the previous high in late 2007.
As the chart on the right shows, in 2014, miles driven began to accelerate, suggesting the economy was improving. However, since Q2 2016, the growth rate in miles driven has started to stall. Although it is still making new highs, the slowdown does raise concerns.
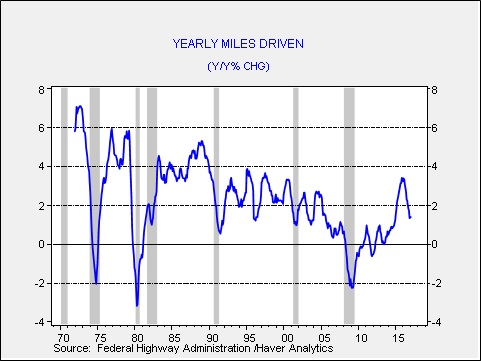
This chart shows the annual change in the 12-month rolling total for vehicle miles driven. Until 2012, negative readings coincided with recessions but only severe ones that also suffered from high oil prices. However, even the 1990-91 downturn, which was part of the oil spike caused by the Iraqi invasion of Kuwait, did not bring a negative reading to this number.
There is a structural trend in the data as well. Note that the level of driving seems to grow at a slower pace during each expansion. The expansion after the 1973-75 recession was 3.8%; the expansion after the 1980-82 recession was 4.1%. However, the subsequent growth rate after the 1990-91 recession was 2.5% and after the 2001 recession was 1.3%. In this expansion, the average growth rate in miles driven is a mere 0.8%. Why are fewer miles being driven? We suspect a number of factors are at work. To some extent, the law of large numbers is having an effect. There are simply constraints to driving that are probably leading to slower growth, namely, road infrastructure and the amount of the population that can afford to own a car. The aging baby boom population is being replaced by Americans who seem to drive less.[1] The advent of social media may reduce the need to drive; baby boomers used to “cruise” to meet friends. The internet allows gatherings to occur without leaving home.
Still, the jump in the data from 2014 into early 2016 and the subsequent slowdown do concern us. This drop could be an early warning that consumers are retrenching; the lack of wage growth may be weighing on household spending. We note that consumption trends are showing slowing growth.
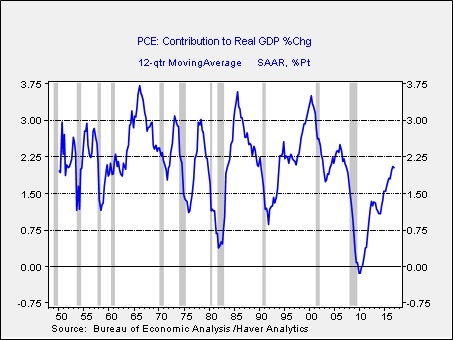
This chart shows the three-year moving average of the contribution to GDP coming from household consumption. The sharp decline in the last recession shows how damaging the last recession was to the household sector. Although the recovery has been robust, the level of growth remains well below previous cycles. In addition, for the past three quarters, the trend contribution level has been stuck at 2%. If this reading fails to accelerate, it would suggest growth will remain slow.
Thus, the miles driven number does suggest some softening in the economy. The slowdown isn’t serious enough to signal an imminent recession, but it should give policymakers pause on moving aggressively on interest rates. If monetary policy remains accommodative, the bullish environment for equities should remain in place.
________________________________
[1] https://www.washingtonpost.com/news/wonk/wp/2014/10/14/the-many-reasons-millennials-are-shunning-cars/?utm_term=.3061591ca7d9