by Bill O’Grady, Thomas Wash, and Patrick Fearon-Hernandez, CFA | PDF
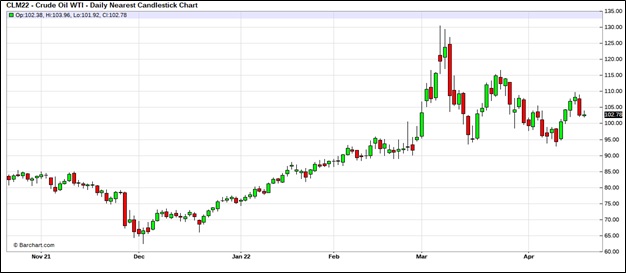
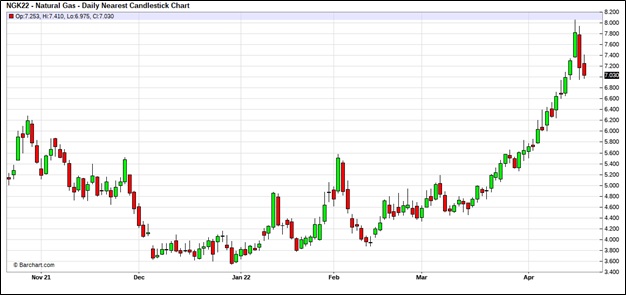
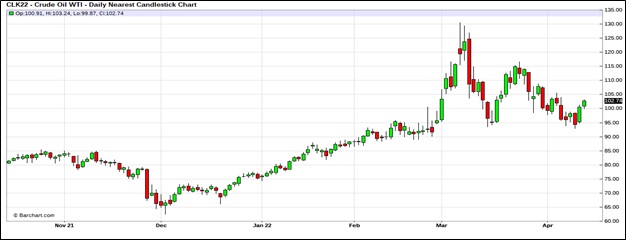
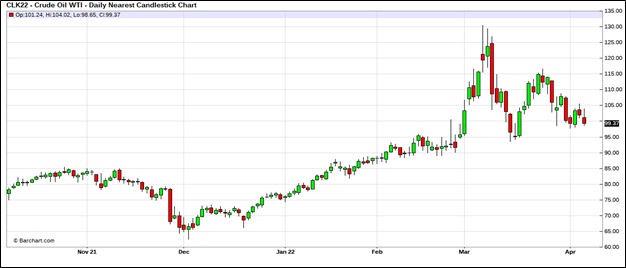
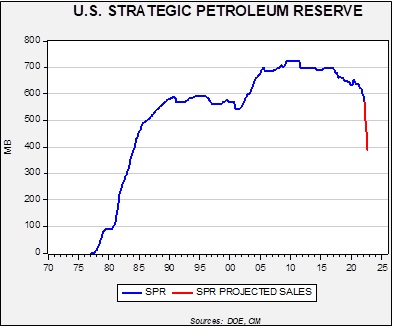
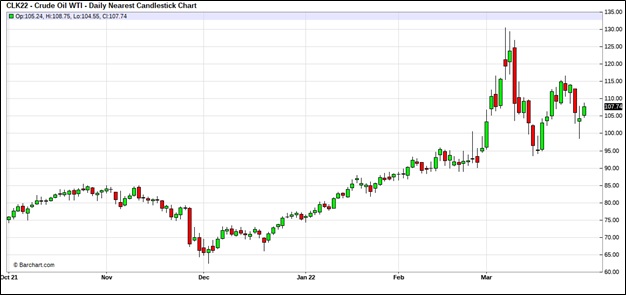
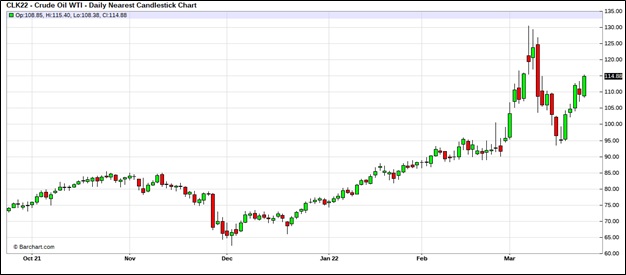
It appears oil prices are attempting to create a trading range between $105 to $95 per barrel. That may hold until the SPR release is complete.
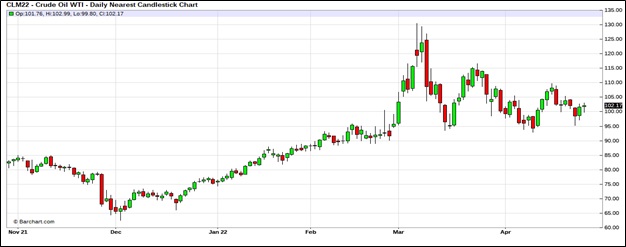
(Source: Barchart.com)
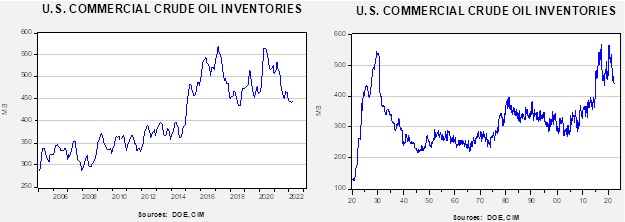
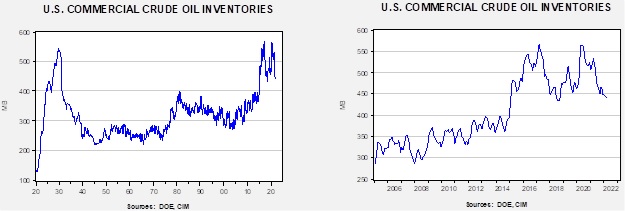
Crude oil inventories unexpectedly rose 0.7 mb compared to a 0.3 mb draw forecast. The SPR declined 2.9 mb, meaning the net draw was 2.2 mb.
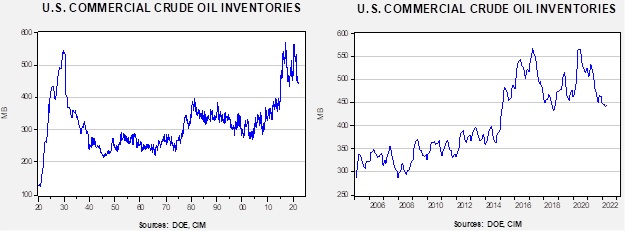
In the details, U.S. crude oil production rose 0.1 mbpd to 11.9 mbpd. Exports rose 2.1 mbpd, while imports declined 0.2 mbpd. Refining activity increased 1.0% and is now 91.0% of capacity. This week’s large and unexpected draw was mostly due to rising exports, although the increase in refinery operations contributed to the draw.

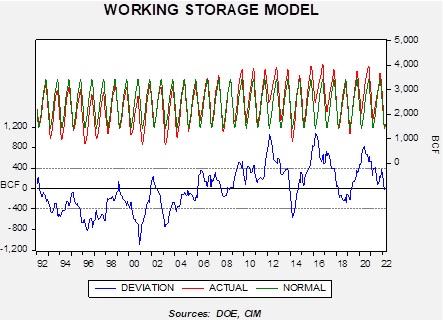
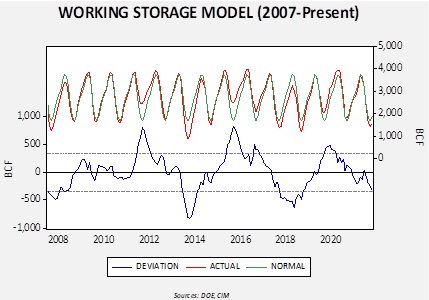
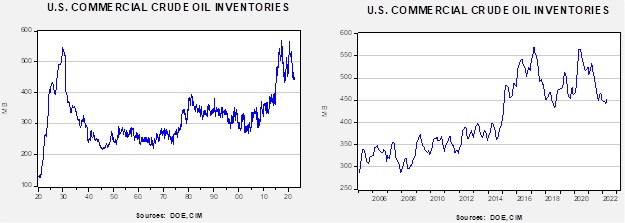
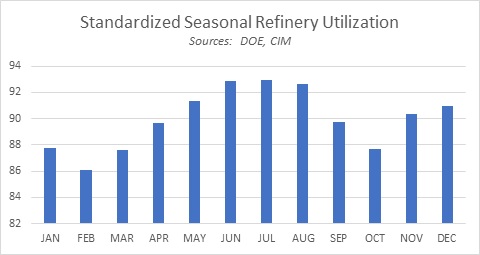
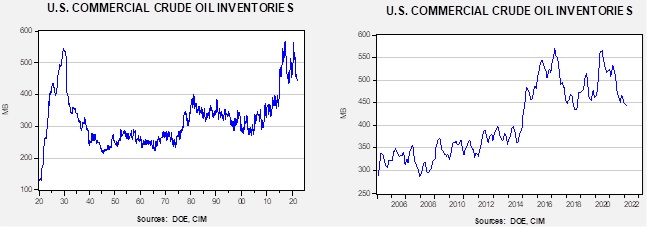
(Sources: DOE, CIM)
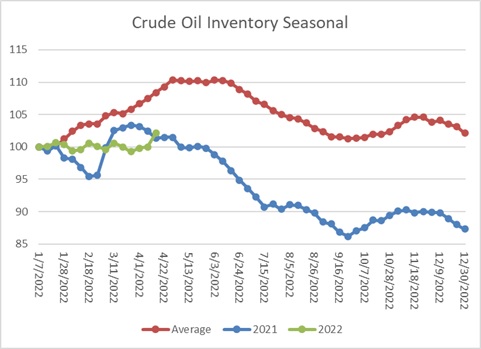
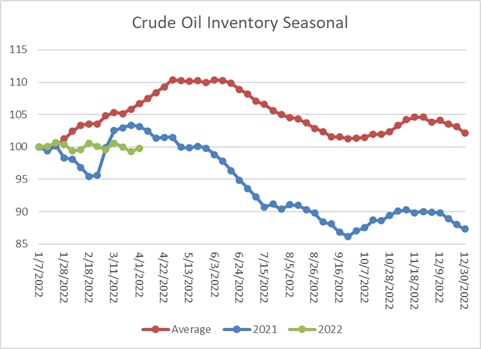
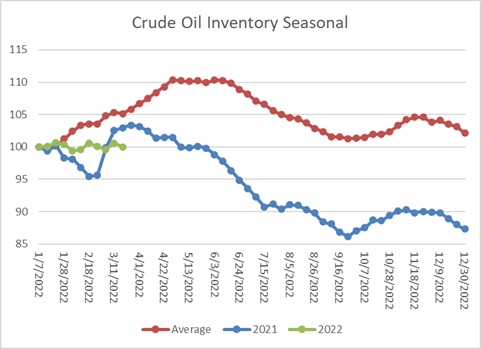
This chart shows the seasonal pattern for crude oil inventories. This week’s report is consistent with last year; also, note that in the average data, we are at the point where the seasonal build period has ended. Over the next few weeks, we will see if we follow the average path or track last year.
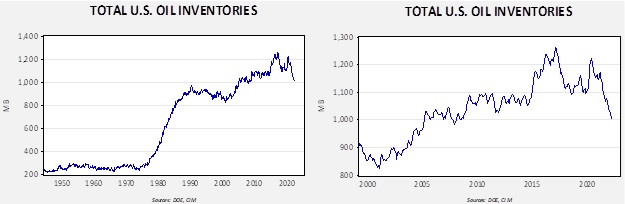
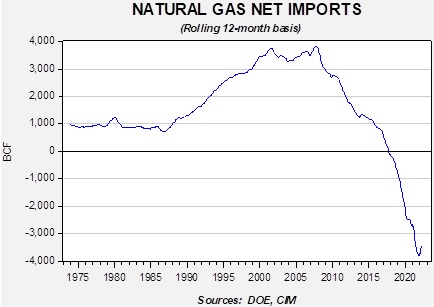
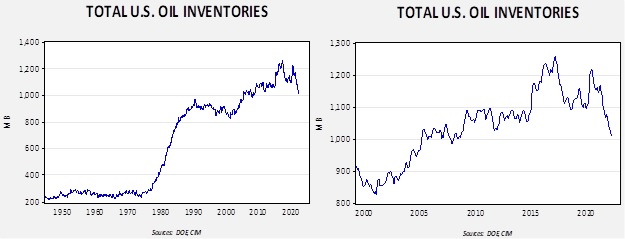
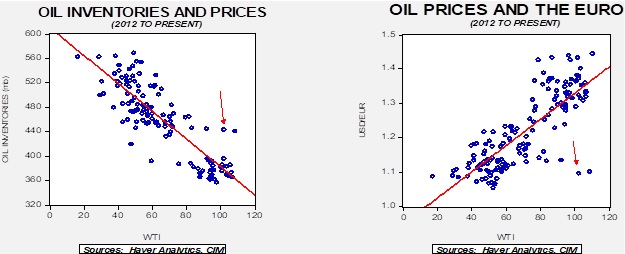
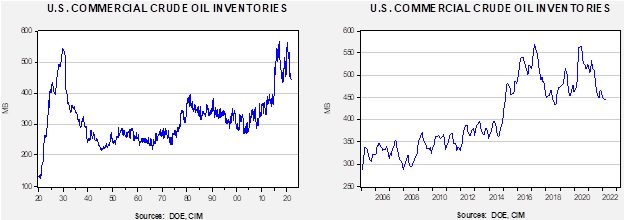
Since the SPR is being used, to some extent, as a buffer stock, we have constructed oil inventory charts incorporating both the SPR and commercial inventories.
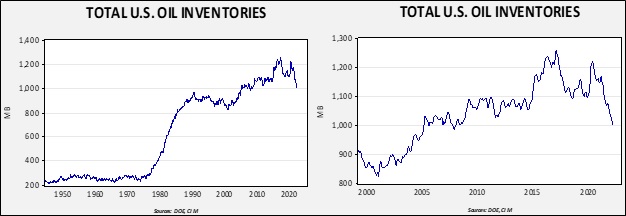
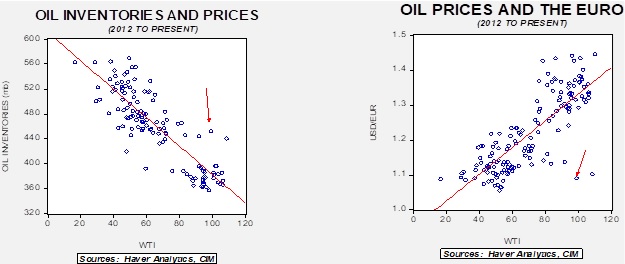
Total stockpiles peaked in 2017 and are now at levels seen in late 2008. Using total stocks since 2015, fair value is $85.50.
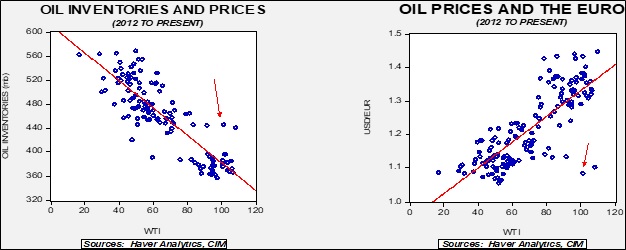
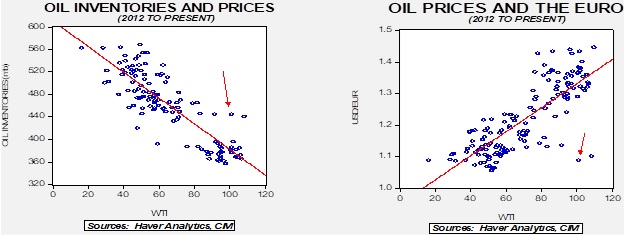
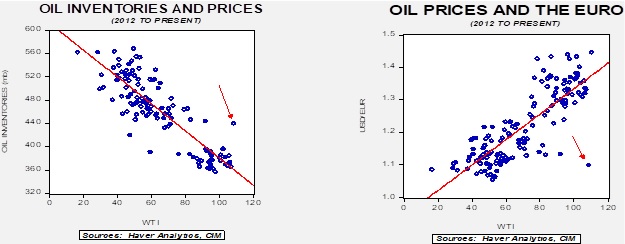
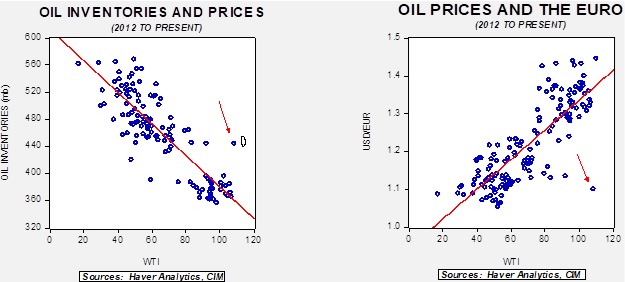
With so many crosscurrents in the oil markets, we see some degree of normalization. The inventory/EUR model suggests oil prices should be around $60 per barrel, so we are seeing about $40 of risk premium in the market.
Market news:
- The two most important market events continue to be the China COVID-19 lockdowns and the Ukraine War; we cover the latter in the Geopolitical section below. China’s lockdowns in major cities, including Shanghai, have adversely affected economic growth and thus oil demand. Fears of weaker demand have weighed on oil prices in particular and commodity prices in general.
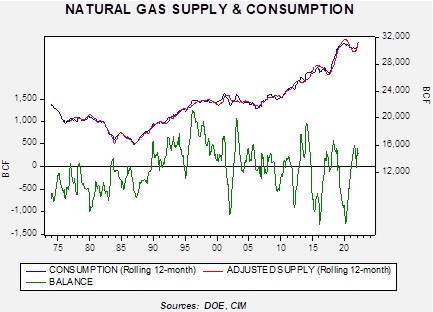
- China’s natural gas production has also risen, but LNG demand remains strong.
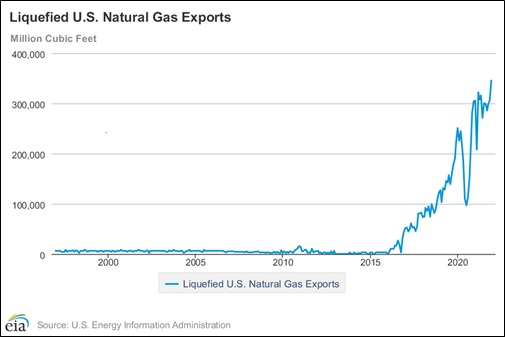
- This summer will be the second with La Niña conditions, often coinciding with hot, dry summers. Warmer-than-normal temps will tend to boost natural gas demand for electricity production. If the forecasts prove correct, there is limited ability to substitute for natural gas, which bodes for higher prices. As we noted last week, U.S. LNG exports are also rising, further boosting prices.
- India and Pakistan are seeing a dangerous heat wave develop.
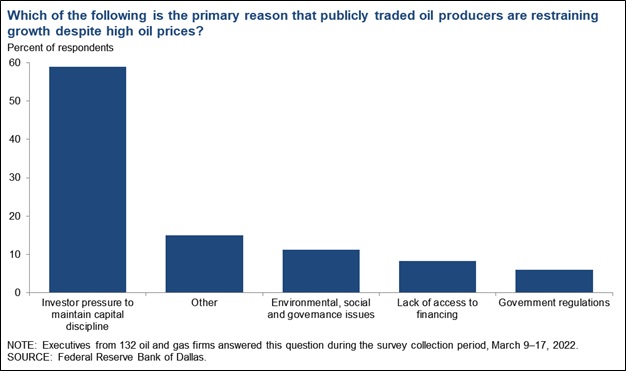
- One factor constraining U.S. oil production is rising drilling costs. Another worry is that prices won’t remain strong, leading to the all too familiar “bust” cycle. A recent World Bank report suggests this worry is misplaced.
- Coal’s future looks bleak, but there is a lot of capacity in the emerging world, and thus demand may be stronger than expected.
- We continue to watch the oil product markets closely, especially diesel. EU imports from Russia have declined but remain elevated.
Geopolitical news:
- The big news this week is that Russia announced it halted Polish gas flows yesterday. Warsaw has refused to pay for the gas in RUB. By shutting off Polish gas, it is possible that some flows to Germany will also be restricted; that hasn’t occurred quite yet. Bulgaria will also have its gas shut off. Natural gas prices jumped on the news.
- Although there is strong pressure for Germany to stop accepting oil and natural gas from Russia, the impact on Germany’s economy is severe enough that U.S. Treasury Secretary Yellen advised “caution.” As this graphic shows, the EU will conceivably struggle to end its dependence on Russian energy. The EU is considering a cap on imports of Russian oil, which has greater substitutability.
- One element of reducing the EU’s reliance on Russian natural gas is to increase the supply of LNG. To that effect, the U.S. and EU announced a plan to do just that. However, that goal remains aspirational. The U.S. is reaching capacity on LNG exports. To build more capacity, the industry would like to guarantee demand through long-term contracts. But, the EU wants to reduce overall demand, making them reluctant to enter into such contracts. Interestingly enough, despite difficult trade relations with China, there have been notable deals between China and U.S. firms that employ long-term contracts.
- As one would expect, Russian oil is finding its way into the world as “black markets” develop to hide its origins. Tankers without destinations are thought to be carrying Russian oil, which is sometimes mixed offshore with other oils to mask the Russian oil characteristics. Such activities have been deployed by other sanctioned nations, e.g., Venezuela and Iran. If the experience of these two nations offers any guide, black markets will not be a full-substitute for normal trade.
- As relations between the EU and Russia sour increasingly, European nations are expropriating Russian energy assets located in Europe. There is growing speculation that these assets may be used as funding to pay for the rebuilding of Ukraine.
- Testimony to that includes reports that Russian oil production has already fallen 10%. As Russian oil inventory capacity is exhausted, wells will be shut in, and the loss of output will essentially be permanent.
- It may not be obvious whether the events are related, but there has been a rise in “murder/suicides” among Russian energy oligarchs.
Alternative energy/policy news:
- President Biden entered office with an aggressive climate agenda. As energy prices have soared, he has been steadily retreating from the position. The withdrawal makes political sense, but it is not without costs. Polls suggest he is rapidly losing support among younger voters, which may adversely affect his party in November’s midterms.
- We have reported that financial firms have been restricting lending activity to fossil fuel companies. That resistance may be starting to wane.
- Until batteries become reliable (and cheap) enough to store wind and solar power during generation periods when the winds are calm and the sun isn’t out, backup capacity tends to undermine the business case for alternative energy. Even though the administration is trying to streamline the process for making batteries, much of the mineral processing remains in China and is a potential block to expanding battery capacity. The EU faces similar capacity shortages.
- We are seeing steady announcements of funding for battery projects.
- Modular nuclear reactors are a potential solution to filling the electricity gap as EVs expand.
- While Germany’s decision to end the use of nuclear power is considered a major mistake, there is little evidence the country is considering changing its stance.
- Geothermal energy is clean and abundant, but the initial investment can be daunting. There is a movement to use abandoned oil wells already drilled to get a “head start” on tapping this source.
- Although Mexico’s President Andrés Manuel López Obrador remains friendly to traditional oil, he has recently nationalized the lithium industry. It’s hard to see how the move will support Mexico’s ability to expand this resource.
- The U.S. solar panel industry is seeking protection from Chinese imports. The installers are opposing these efforts.
- Canada has set up an exchange for carbon credits. Activity is expanding rapidly.