

Tag: Fed
Asset Allocation Bi-Weekly – The FOMC Speaks (May 16, 2022)
by the Asset Allocation Committee | PDF
On May 4th, the FOMC announced its policy changes. The Fed moved its fed funds target by 50 bps, the fastest increase in 22 years; the last hike of this amount was in May 2000. In the press conference, Chair Powell scotched the notion of a greater than 50 bps rate hike. He did, however, suggest that similar 50 bps rate hikes will be likely for at least the next couple of meetings.
One way to look at the future path of policy is to compare the level of inflation to unemployment. This is the classic Phillips Curve idea; although the FOMC has seemingly jettisoned this concept, history suggests that policy has been aligned with this relationship.
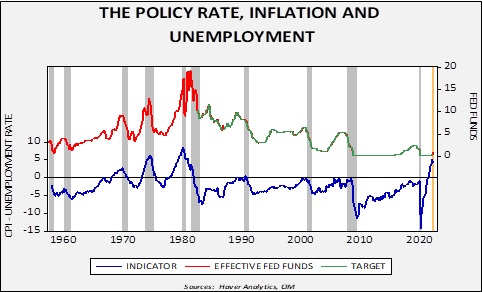
The upper line on the chart shows the level of fed funds along with the target; Haver Analytics has estimated the policy rate target beginning in 1982. The lower line shows the spread of yearly change in overall CPI and the unemployment rate. From the late 1960s into the early 1980s, inflation regularly exceeded the unemployment rate, forcing policymakers to lift the policy rate aggressively to contain inflation. These tightening cycles led to four recessions over 12 years. After that experience, the FOMC took steps to move rates high once the spread between inflation and unemployment approached zero. This policy stance could be called “preemptive”.
However, in the current expansion, the Fed has allowed inflation to exceed the unemployment rate by a wide margin. On the above chart, we have made forecasts for data unavailable for April and May (the yellow shaded area on the chart). We expect inflation to begin slowly falling, but the unemployment rate to remain low. To normalize rates, the unemployment rate will need to rise above CPI. The tone of Powell’s press conference suggests the FOMC is moving in the direction of achieving this target at a deliberate pace; it is likely the Fed hopes inflation will fall as supply constraints ease and thus wants to give the economy more time to adjust to tighter monetary policy.
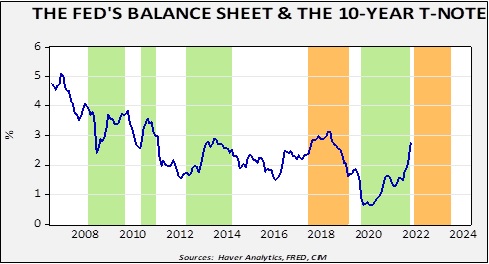
The other major announcement was that the Fed will begin to reduce the size of the balance sheet. Quantitative tightening (QT) will start in earnest in June. The impact of changes to the balance sheet remains controversial; the expected outcome from quantitative easing (QE) was to lower long-term interest rates. Interestingly enough, QT and QE have tended to lift long-term rates, whereas a stable balance sheet led to lower interest rates.
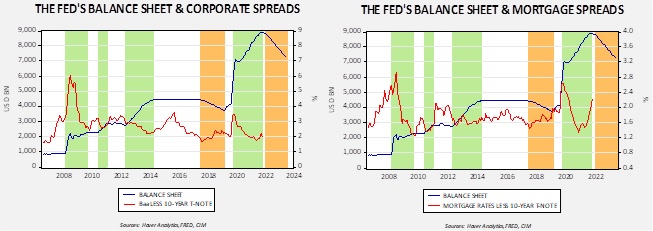
On the other hand, periods of QT tended to narrow credit and mortgage spreads. On the chart below, periods of QE are in green, and QT in tan.
Finally, the relationship of the Fed’s balance sheet to equities is also controversial.
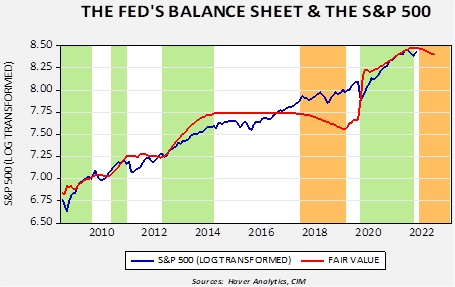
The S&P 500 often tracks higher during periods of QE and stalls when the balance sheet stabilized…until late 2016. Equities forged higher even with QT, but the positive relationship between the balance sheet and equities returned during the most recent QE period. The model would suggest that QT will have a modestly adverse effect on equities. The biggest risk to equities is likely the business cycle. Recessions tend to bring bear markets in stocks. But, QT on its own is probably not a bearish event.
So, to recap, tighter monetary policy, which includes higher policy rates and balance sheet reduction, increases recession risk. Recessions are inclined to affect risk assets adversely. We expect credit spreads to widen and equities to weaken if recession odds rise. Longer duration yields generally decline, although in periods of elevated inflation, the declines are often simultaneous with the onset of the downturn. Although we do not expect a recession in 2022, the likelihood in 2023 is rising.
Asset Allocation Bi-Weekly – #70 “Believe It or Not, Fiscal Policy Is Tightening” (Posted 3/7/22)
Asset Allocation Bi-Weekly – Believe It or Not, Fiscal Policy Is Tightening (March 7, 2022)
by the Asset Allocation Committee | PDF
The U.S. economy and government economic policies have many moving parts, but investors often latch onto just one or two indicators or policy initiatives to gauge where asset prices are heading. These days, their focus has been on consumer price inflation and the Federal Reserve’s plan to hike its benchmark short-term interest rate to combat it. Tighter monetary policy should help cut demand, leading to lower inflation, but it will also have a direct negative impact on asset prices. In this report, we argue investors aren’t paying enough attention to another aspect of economic policy. Investors might not realize it, but federal fiscal policy is also tightening, which will further weigh on economic growth. It will be an additional challenge for asset prices.
Investors are often incensed at the enormous numbers that get bandied about when talking about government spending, but it’s important to keep in mind that the overall economy is also enormous. U.S. gross domestic product (GDP) totaled about $23 trillion in 2021. In the decade leading up to the coronavirus pandemic, total federal receipts averaged 16.3% of GDP, while federal spending averaged 21.6% of GDP. The budget deficit averaged 5.3% of GDP. However, to cushion the blow of the pandemic starting in early 2020, the government passed trillions of dollars of emergency spending, ranging from forgivable loans for affected businesses to enhanced unemployment benefits and cash grants for individuals. As shown in the chart, total federal outlays in the year ended March 2021 were up a massive 65.7% from the prior year, even as federal receipts were essentially flat.
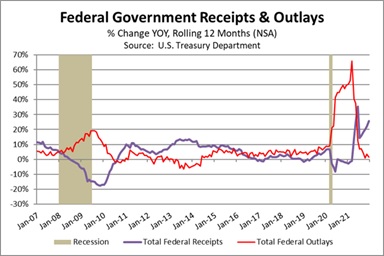
The added spending during the pandemic undoubtedly helped preserve economic activity. It also blew out the budget deficit and, against a backdrop of pandemic supply disruptions, has contributed to today’s high inflation as well. However, the chart above shows that this fiscal stimulus has already gone into reverse. In the year ended December 2021, spending was essentially unchanged from the previous year. Because of the rapid economic recovery, government receipts (mostly income taxes) were up 25.7%. Flat spending against a huge jump in tax income helped cut the budget deficit to “just” $2.577 trillion in 2021, or $771.4 billion narrower than in 2020. The deficit in 2021 was only about 11.4% of GDP, roughly half what it was in 2020.
The $771.4 billion in deficit reduction during 2021 was a drag on the economy, but it wasn’t very noticeable because companies and individuals had so much pent-up demand. In addition, companies and individuals still had a lot of excess cash and savings left over from the stimulus programs earlier in the pandemic. The experience in 2022 could be very different. For one thing, forecasts from authorities such as the White House Office of Management and Budget and the Congressional Budget Office suggest the deficit will fall dramatically again this year. In dollar terms, the deficit is expected to narrow by some $1.3 trillion, mostly because of higher income tax receipts and reduced transfer payments to states, local governments, and individuals. That’s exactly like taking $1.3 trillion out of the economy, just as many firms and individuals start to deplete their savings and face much higher price inflation.
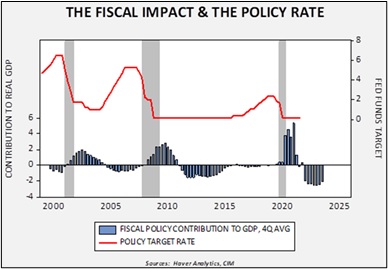
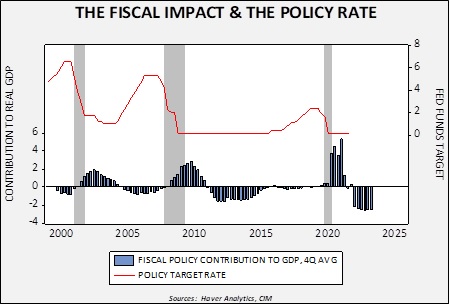
As shown in this chart, the fiscal tightening that began in 2021 has been shaving more than two percentage points off the annualized U.S. growth rate for the last several quarters. Taking another $1.3 trillion in net federal spending out of the economy in 2022 will cut several additional percentage points out of the growth rate, on top of the other headwinds to demand. This fiscal drag will be offset partially by factors such as the Biden administration’s new infrastructure spending and reduced demand for imports. Nevertheless, we still expect it to have a major impact in slowing demand, just as the Fed looks set to impose multiple interest-rate hikes. The chart shows that the Fed’s recent rate-hiking campaigns have all occurred during periods of negative fiscal impacts, but none of those periods had fiscal tightening on the scale we’re about to see. This simultaneous tightening of fiscal and monetary policy may help ease inflation pressures. It also means real economic growth in 2022 may be a little better than the anemic rates seen in the decade before the pandemic. That will likely limit the upside for equities and commodities this year. At the same time, it should also limit the downside for bond prices and keep yields from rising as much as some investors now fear.
Asset Allocation Bi-Weekly – #66 “The Path of Monetary Policy” (Posted 1/10/22)
Asset Allocation Bi-Weekly – The Path of Monetary Policy (January 10, 2022)
by the Asset Allocation Committee | PDF
Our expectation of no policy rate hikes this year is an out-of-consensus call in our 2022 Outlook: The Year of Fat Tails. There are a couple of factors that suggest rate hikes this year. First, financial markets have factored in rate hikes. Fed funds futures suggest a greater than 50% likelihood of a rate hike beginning with the March 2022 meeting and have discounted the same likelihood for four 25 bps rate hikes by December. Second, the Mankiw Rule, a derivation of the Taylor Rule, indicates the FOMC is hopelessly behind the curve in terms of rate hikes.
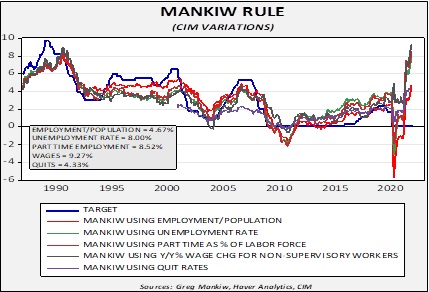
We have created five variations of the Mankiw rule, which calculates a fair value policy rate from core CPI and various measures of the labor market. The most conservative measure puts the recommended fed funds rate at 4.33%; the most radical is 9.27%.
So, given this strong evidence, what is the argument for steady policy? Part of the reason the Mankiw variations are so high is due to elevated inflation. Base effects alone should lead to lower readings on inflation by mid-year, which should cool the impetus for policy tightening. Although the labor markets show signs of being tight, the labor force remains well below pre-pandemic levels. It may give FOMC members pause, worried that tightening could be premature.
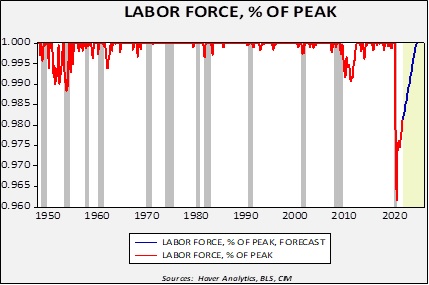
This chart compares the three-month average of the labor force relative to its most recent peak. The drop in the labor force seen during the pandemic was unprecedented in the post-war era. It is uncertain whether the labor market has been permanently impaired by the pandemic. It may never return to pre-pandemic levels. It is also possible that as the pandemic steadily shifts to endemic, workers will return. Thus, tightening could prematurely put this return at risk.
Another characteristic of the FOMC since Greenspan has been the attention paid to financial markets. The concept of the “Greenspan put,” which has been attributed to every Fed chair since Greenspan, suggests a pattern where monetary policy is eased to quell turmoil in financial markets.
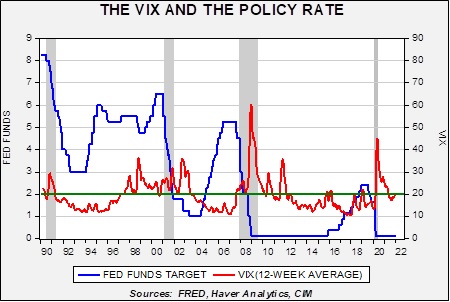
One clear measure of financial stress is the VIX, which measures the implied volatility of the S&P 500. In general, the FOMC tends to avoid tightening when the 12-week average of the VIX is above 20. For example, after the Fed raised rates in late 2015, policy remained on hold until the VIX fell decidedly. With the VIX currently holding around 20, we expect the FOMC to delay any moves to raise rates until market volatility eases.
Finally, we suspect financial markets are underappreciating the degree of fiscal tightening that will occur this year.
Fiscal spending during the pandemic was extraordinary. However, as that support winds down, it will act as a drag on economic growth. If the FOMC tightens into this austerity, economic growth could weaken more than expected. The consensus real GDP growth for 2022 is 3.9%. That could be at risk if the Fed tightens into falling fiscal support.
Obviously, we could be wrong on our monetary policy call, and if we are, we will adjust. For now, we think there is a case that the market is overestimating the degree of monetary policy tightening that will occur. If we are correct, it’s likely supportive for equities, short-duration fixed income, commodities, and bearish for the dollar.