

Tag: recession risk
Asset Allocation Bi-Weekly – The FOMC Speaks (May 16, 2022)
by the Asset Allocation Committee | PDF
On May 4th, the FOMC announced its policy changes. The Fed moved its fed funds target by 50 bps, the fastest increase in 22 years; the last hike of this amount was in May 2000. In the press conference, Chair Powell scotched the notion of a greater than 50 bps rate hike. He did, however, suggest that similar 50 bps rate hikes will be likely for at least the next couple of meetings.
One way to look at the future path of policy is to compare the level of inflation to unemployment. This is the classic Phillips Curve idea; although the FOMC has seemingly jettisoned this concept, history suggests that policy has been aligned with this relationship.
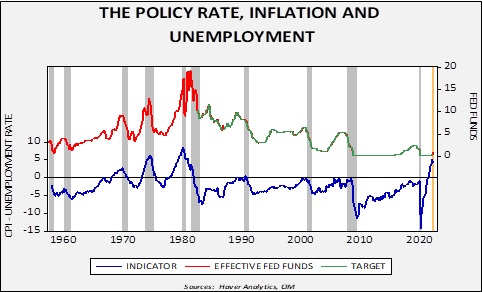
The upper line on the chart shows the level of fed funds along with the target; Haver Analytics has estimated the policy rate target beginning in 1982. The lower line shows the spread of yearly change in overall CPI and the unemployment rate. From the late 1960s into the early 1980s, inflation regularly exceeded the unemployment rate, forcing policymakers to lift the policy rate aggressively to contain inflation. These tightening cycles led to four recessions over 12 years. After that experience, the FOMC took steps to move rates high once the spread between inflation and unemployment approached zero. This policy stance could be called “preemptive”.
However, in the current expansion, the Fed has allowed inflation to exceed the unemployment rate by a wide margin. On the above chart, we have made forecasts for data unavailable for April and May (the yellow shaded area on the chart). We expect inflation to begin slowly falling, but the unemployment rate to remain low. To normalize rates, the unemployment rate will need to rise above CPI. The tone of Powell’s press conference suggests the FOMC is moving in the direction of achieving this target at a deliberate pace; it is likely the Fed hopes inflation will fall as supply constraints ease and thus wants to give the economy more time to adjust to tighter monetary policy.
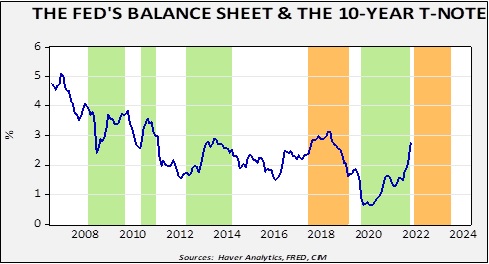
The other major announcement was that the Fed will begin to reduce the size of the balance sheet. Quantitative tightening (QT) will start in earnest in June. The impact of changes to the balance sheet remains controversial; the expected outcome from quantitative easing (QE) was to lower long-term interest rates. Interestingly enough, QT and QE have tended to lift long-term rates, whereas a stable balance sheet led to lower interest rates.
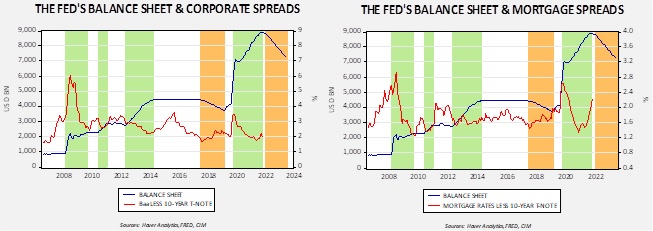
On the other hand, periods of QT tended to narrow credit and mortgage spreads. On the chart below, periods of QE are in green, and QT in tan.
Finally, the relationship of the Fed’s balance sheet to equities is also controversial.
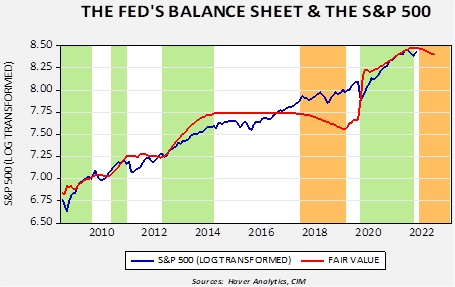
The S&P 500 often tracks higher during periods of QE and stalls when the balance sheet stabilized…until late 2016. Equities forged higher even with QT, but the positive relationship between the balance sheet and equities returned during the most recent QE period. The model would suggest that QT will have a modestly adverse effect on equities. The biggest risk to equities is likely the business cycle. Recessions tend to bring bear markets in stocks. But, QT on its own is probably not a bearish event.
So, to recap, tighter monetary policy, which includes higher policy rates and balance sheet reduction, increases recession risk. Recessions are inclined to affect risk assets adversely. We expect credit spreads to widen and equities to weaken if recession odds rise. Longer duration yields generally decline, although in periods of elevated inflation, the declines are often simultaneous with the onset of the downturn. Although we do not expect a recession in 2022, the likelihood in 2023 is rising.