Asset Allocation Weekly (September 22, 2017)

by Asset Allocation Committee

In a recent speech,[1] New York FRB President Bill Dudley made the case that the FOMC should continue to reduce monetary stimulus even though inflation remains below target.  His contention is that benign financial conditions in the face of tighter policy are creating distortions in financial markets, resulting in the need for additional policy tightening.

Congress has given the Federal Reserve dual mandates—full employment and low inflation.  The Phillips Curve would suggest that meeting both is often impossible.  The curve postulates that there is a tradeoff between inflation and unemployment, and so meeting one objective probably means missing the other.  Since the 1970s, the Phillips Curve has become increasingly less reliable; globalization and deregulation have led to persistently falling price pressures.  In other words, inflation is falling on its own, and thus monetary policy can mostly focus on full employment.  Based on the current unemployment rate, it is likely that full employment has probably been achieved, although the persistence of weak wage growth would suggest that the Fed should be in no hurry to raise rates.

Although the FOMC has dual mandates, every central bank has the goal of financial stability.  After all, the primary reason for creating a central bank is to build a system for a lender of last resort who will lend to financial institutions during liquidity crises.  The Federal Reserve was created in 1913 in response to the Panic of 1907, which was single-handedly stopped by John Pierpont Morgan (yes, that J.P. Morgan).  President Roosevelt, while relieved that private bankers were able to end the panic, was also worried that relying on this solution in the future was tempting fate.  Thus, he started the debate on creating a U.S. central bank that resulted in the founding of the Federal Reserve six years later.

During financial crises, commercial banks face liquidity problems.  Banks operate by maturity transformation.  They take short-term loans (also known as deposits), repayable on demand, and transform them into less liquid but higher yielding loans.  As long as depositors don’t demand their money en masse, the system works well; cash becomes investable and helps build the economy by providing funds for investment.  However, in a panic, banks may be forced to liquidate good loans to meet the demands from depositors.  This selling can damage the financial system needlessly.  The central bank is designed to lend against these loans so that banks can meet depositor demand and quell the panic.[2]

Essentially, one of the key roles of a central bank is crisis management.  Thus, most central banks have regulatory power to prevent commercial banks from taking excessive risk.  Reserve requirements, capital requirements, bank inspections, stress tests and the general level of interest rates are all used to reduce the likelihood of a panic.  Creating an environment of healthy fear can curb bankers’ “animal instincts” and prevent them from becoming overly optimistic and making aggressive loans.  Unfortunately, if the Federal Reserve is successful in its Congressional mandates, it can prolong the business cycle.  As Hyman Minsky noted,[3] the longer economic conditions appear calm, the greater the likelihood that investors, borrowers and lenders will be inclined to take more risk.  The Minsky Instability Theory postulates that economic actors are more likely to create instability the longer conditions remain stable.

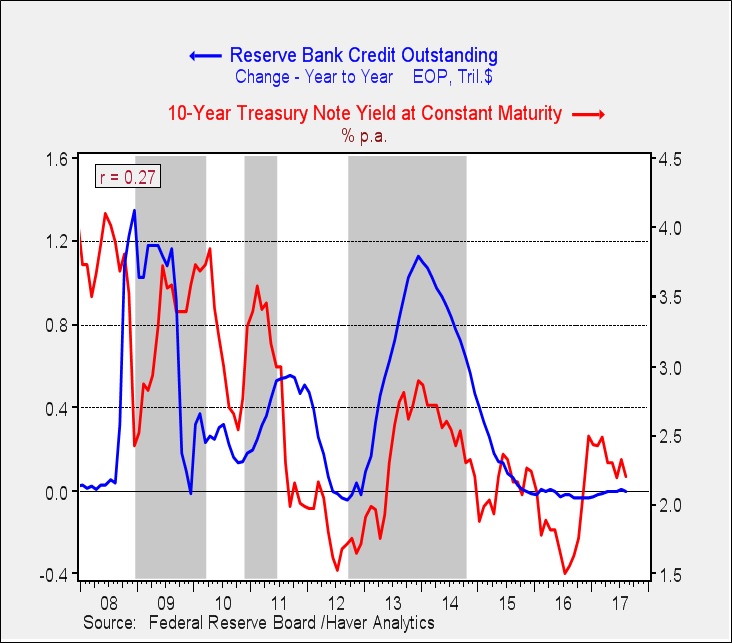
Dudley’s comment about financial stability is worth examining.  On the chart below, we overlay the Chicago FRB National Financial Conditions Index along with the fed funds rate.

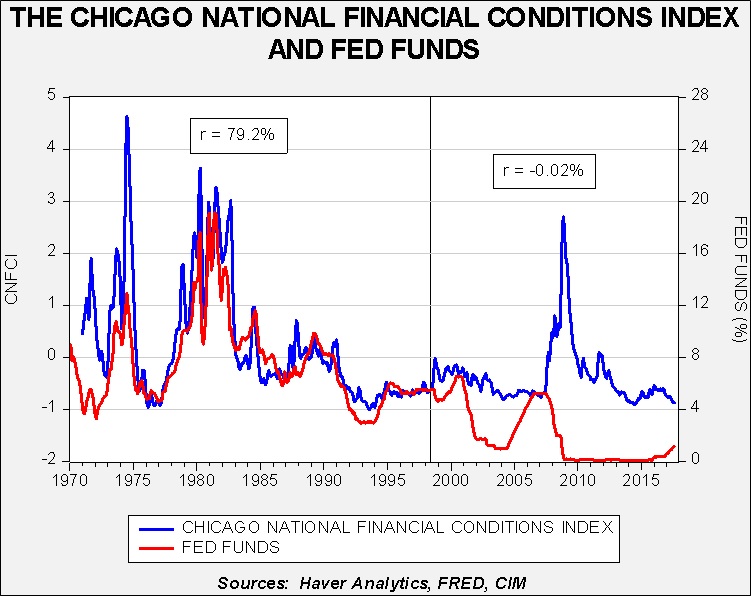
The blue line on the chart shows the aforementioned Financial Conditions Index, which measures the level of stress in the financial system.  It is constructed of 105 variables, including the level of interest rates, credit spreads, equity and debt market volatility, delinquencies, borrower and lender surveys, debt and equity issuance, debt levels, equity levels and various commodity prices (including gold).  A rising line indicates increasing financial stress or deteriorating financial conditions.  The red line is the effective fed funds rate.  Until mid-1998, the two series were positively and closely correlated.  When the Fed raised rates, financial stress rose; when the Fed lowered rates, stress declined.  After 1998, the two series became virtually uncorrelated.

We believe there are two factors that changed this relationship.  The first is policy transparency.  Starting in the late 1980s, the Fed became increasingly transparent.  For example, before 1988 the FOMC would meet but issue no statement about what it had decided to do.  Investors and the financial system had to guess whether policy had been changed.  Starting in 1988, the central bank began publishing its target rate.  In the 1990s, it began issuing a statement when rates changed.  Eventually, a statement followed all meetings.  As the FOMC has become more transparent, the correlation between stress and the level of fed funds has changed.  Essentially, the markets now know with a high degree of certainty when rate changes are likely.  This is especially true of tightening.  The FOMC appears to avoid making rate hikes that surprise the market.

The second factor is financial system stability.  From the Great Depression into the 1980s, policymakers put a high premium on system stability at the expense of efficiency.  Bank failures were rare and there were a large number of rather small institutions.  In addition, commercial banks were separated from investment banks.  The drive to improve efficiency in the financial system led to consolidation among commercial banks and a breakdown of the barriers between commercial and investment banks.  Although this made the system more efficient, it also undermined stability.  Thus, when raising rates, the Fed must pay close attention to system stability to prevent crises, which has tended to lead to gradual and measured policies.  This behavior maintains stability…until it doesn’t!

It appears that Dudley would like to return to the pre-1998 period.  We tend to agree with that sentiment.  Monetary policy would be much more effective if financial stress moved directly with changes in policy rates.  However, if our thesis that transparency and industry concentration led to the change in the relationship, it seems highly unlikely that policymakers would reverse those conditions.  Instead, we now live with markets where policymakers have virtually no control over financial conditions; the longer conditions are quiet, the more emboldened investors, lenders and borrowers are likely to become.  And, when financial conditions deteriorate, it seems to require extraordinary measures by central bankers to restore calm.  This means that investors live in a world where financial conditions appear benign most of the time until they are not and then they become quite adverse.  Monetary transparency has probably created distorted financial conditions where risks are hidden and thus encourage risky behavior, suggesting investors should exercise more caution than financial conditions currently signal.

View the PDF


[1] https://www.newyorkfed.org/newsevents/speeches/2017/dud170907

[2] The problem for the central bank is determining if a commercial bank faces a solvency or a liquidity crisis.  If the assets of the bank, its loans, are dodgy, the lending against them is probably a mistake and the bank should be liquidated.  On the other hand, if the loans are of good quality, then lending against these loans is a sound way to contain a banking panic.

[3] Minsky, H. (2008). Stabilizing an Unstable Economy (2nd ed.). New York, NY: McGraw-Hill (originally published 1986).

Weekly Geopolitical Report – North Korea: An Update (September 18, 2017)

by Bill O’Grady

The Kim regime has become increasingly belligerent, launching a number of ballistic missiles and testing what appears to be a hydrogen device.  It is also claiming it has miniaturized a warhead, meaning, if true, North Korea is a nuclear power.

The U.S. has indicated this development is unacceptable.  Although the Trump administration still says that “all options are on the table,” a full-scale war would be catastrophic and may be impossible to contain.  The U.S. wants China to bring North Korea to heel; so far, the Xi government has been reluctant to push hard against Pyongyang.  Meanwhile, Japan and South Korea are becoming increasingly worried about North Korea’s behavior.

Although the Hermit Kingdom has been the topic of reports on numerous occasions, an update on the basic geopolitical issue of North Korea is warranted given the volume of recent news.  In this report, we will examine the motivations of North Korea and surrounding powers, including South Korea, Russia, China, Japan and the U.S.  As always, we will conclude with potential market ramifications.

View the full report

Asset Allocation Weekly (September 15, 2017)

by Asset Allocation Committee

In our most recent asset allocation rebalancing, we added foreign allocations to our portfolios.  Over the past few years, we had generally avoided allocations to non-U.S. markets in asset allocation portfolios due to two primary concerns.  First, the dollar had been appreciating as a result of an improving U.S. economy and policy divergences between the U.S. and the rest of the world.  The Federal Reserve was raising rates and tapering its balance sheet while the majority of other nations were still adding monetary stimulus.  Second, we have had secular concerns about the stability and attractiveness of foreign investing in a world where the U.S. is seemingly reducing its hegemonic role.

We previously noted that the dollar was deeply undervalued on a purchasing power parity basis and vulnerable to depreciation.  The catalysts for dollar weakness appear to be coming from two sources.  First, the FOMC is moving very slowly to tighten policy while the rest of the world’s central banks are finally withdrawing policy stimulus.  Second, uncertainty surrounding American governance appears to be undermining investor confidence and leading to dollar selling.  In this week’s report, we wanted to update the valuation levels for the dollar against the yen, euro, Canadian dollar and British pound.

This chart shows four purchasing power parity models for the aforementioned currencies.  In all four cases, the dollar was trading “rich” by more than one standard error, and nearly two standard errors from parity in two cases.  Over the past two months, three of the four currencies have begun to appreciate and are indicating some modest improvement in valuation.  However, these models all suggest that the dollar is still overvalued and thus, even with the recent depreciation, the greenback is still overvalued.   Hence, the narrative that a weaker dollar should support further gains in overseas assets remains viable.  If history is any guide, we are still in the early stages of a dollar reversal that should remain in place for the foreseeable future.

At the same time, the secular concerns about the impact of the withdrawal of U.S. hegemony will likely be a bearish factor for overseas investments.  For now, we expect the dollar’s weakness to overshadow concerns over global stability.  But, as some point, possibly in the next couple of years, the dollar will be closer to fair value and the case for foreign investment will be more difficult to justify.

View the PDF

Weekly Geopolitical Report – Reflections on Nationalism: Part III (September 11, 2017)

by Bill O’Grady

Three weeks ago, we began our series on nationalism.  In Part I, we discussed social contract theory before and after the Enlightenment.  We examined three social contract theorists, Thomas Hobbes, John Locke and Jean-Jacques Rousseau.  In Part II, we recounted Western history from the American and French Revolutions into WWII.  From there, we examined America’s exercise of hegemony and the key lessons learned from the interwar period.  This week, we will begin with an historical analysis of the end of the Cold War and the difficulties that have developed in terms of the post-WWII consensus and current problems.  We will discuss the tensions between the U.S. superpower role and the domestic problems we face.  Next, we will analyze populism, including its rise and the dangers inherent in it.  As always, we will conclude with market ramifications.

View the full report

Asset Allocation Weekly (September 8, 2017)

by Asset Allocation Committee

As the FOMC prepares to reduce its balance sheet, it’s a good time to update our views on long-term interest rates.  The chart below shows our current estimate of fair value for the 10-year Treasury.

The model uses fed funds, the 15-year moving average of CPI (an inflation expectations proxy), the yen/dollar exchange rate, oil prices and German bond yields.  The current yield is on fair value.  Assuming the other variables remain steady, the current yield on the 10-year T-note is assuming the FOMC is going to hold rates steady for the foreseeable future.

Is this assumption on the policy rate reasonable?  Currently, fed funds futures don’t reach a 50% chance of a rate hike until the June 2018 meeting, and even by next December the odds of a rate increase are only 67%.  We expect the Yellen FOMC to use balance sheet contraction to placate the hawks on the committee and thus avoid increases in fed funds until it becomes abundantly clear that inflation is rising.

One of the reasons for expanding the Fed’s balance sheet was to lower long-term interest rates.  In reality, the evidence of success is mixed.

This chart shows the 10-year T-note yield with the yearly change in the balance sheet.  The gray bars show official periods of QE.  A zero reading indicates no change in the balance sheet compared to the prior year.  Rates fell in QE1, at least initially, although they did rebound as the recession came to an end in mid-2009.  However, rates generally rose in QE2 and QE3.  Although the Fed was buying longer dated Treasuries, which reduced its supply, it appears the demand may have weakened on fears that QE would trigger inflation.  Thus, a case could be made that reducing the balance sheet would have a similar effect and push rates lower.

Our base case is that reducing the balance sheet will have an asymmetric effect on markets; in other words, it won’t have a significant impact on interest rates, unlike the apparent bearish impact that QE2 and QE3 had on long-term interest rates.  This is because the FOMC is framing the reduction in the balance sheet as “normalization,” whereas QE was designed to be stimulative.  Thus, our analysis suggests that the most important impact of QE was psychological.  However, it is possible that QE did more than just boost sentiment; if so, balance sheet normalization could be bullish for long-duration bonds.

View the PDF

Asset Allocation Weekly (September 1, 2017)

by Asset Allocation Committee

We have previously documented the difference between S&P 500 operating earnings reported by Thomson/Reuters and Standard and Poor’s.  Although both series purport to measure the same thing, there can be rather wide divergences.  These exist due to differences in how unusual events are accounted for; we do often see long periods where the two series are identical but, in this bull market, the Thomson/Reuters data has tended to consistently exceed the S&P numbers.

This chart shows the two series from 1994, with the lower line showing their ratio.  The reason we monitor these divergences is that an elevated ratio has led to bear markets and recessions in two previous instances.  Fortunately, the ratio is narrowing, although the difference in terms of the past four quarters is still notable, with Thomson/Reuters at $125.07 while the S&P is at $116.14.

One reason for the recent change in the ratio could be oil prices.

The drop in oil prices coincided with a widening of the ratio.  Thus, it is possible that S&P treats the impact of falling oil prices on earnings differently than Thomson/Reuters.  If oil prices remain elevated from recent lows, the spread between the two series should also narrow.

This year’s earnings story continues to be the expansion of margins.  Looking at S&P operating earnings compared to GDP, we have seen a solid recovery in margins.  Our margin model has been projecting a recovery and stabilization around the level of 5.5% of GDP.  If that is the case, the growth rate in earnings should slow to the pace of nominal GDP over the next few quarters.

Based on our analysis, we are on pace for a year-end operating earnings number, basis Standard and Poor’s, of $121.50, a 14.3% rise over this series report from last year.  A similar growth number for Thomson/Reuters would put this year’s earnings at $136.10 compared to the current expectation of $131.10.  However, since the gap between the two earnings series is narrowing, current expectations are probably about right as that would be consistent with the current ratio.  If the two narrow further, current expectations may be too high.  Still, in any case, margins remain strong and should offer support for equities.

View the PDF

Weekly Geopolitical Report – Reflections on Nationalism: Part II (August 28, 2017)

by Bill O’Grady

(Due to the Labor Day holiday, the next report will be published on September 11.)

Last week, we began our series on nationalism.  In Part I of this report, we discussed social contract theory before and after the Enlightenment.  We examined three social contract theorists, Thomas Hobbes, John Locke and Jean-Jacques Rousseau.  This week, in Part II, we will recount Western history from the American and French Revolutions into WWII.  From there, we will analyze America’s exercise of hegemony and the key lessons learned from the interwar period.

In two weeks, in Part III, we will begin with an historical analysis of the end of the Cold War and the difficulties that have developed in terms of the post-WWII consensus and current problems.  We will discuss the tensions between the U.S. superpower role and the domestic problems we face.  From there, an analysis of populism will follow, including its rise and the dangers inherent in it.  As always, we will conclude with market ramifications.

View the full report

Asset Allocation Weekly (August 25, 2017)

by Asset Allocation Committee

When President Trump was elected, there were expectations that fiscal policy would become more stimulative, which would lead to faster growth, tighter monetary policy and dollar strength.  There were also promises of regulatory relief.  In November, soon after the election, financial markets, exercising their usual pattern of discounting the future, immediately began to react to these expectations.  This week, we want to look at how these expectations have fared thus far.

We begin by looking at the 12 asset classes that we monitor in our Daily Comment to see how they have performed.  We indexed the data to the close on Election Day.

The best performing asset classes have been emerging market and foreign developed equities, denominated in dollars.  U.S. large caps have generally performed in line with both of these asset classes in local currency terms, but dollar weakness has led to foreign outperformance.  The weakest performing asset classes have been U.S. government bonds and commodities.  Bonds have steadily recovered from the December lows as Trump’s policy agenda continues to stall.

A couple of individual charts are worth noting.  First, small cap stocks, which jumped after the election, have begun to roll over.  The Affordable Care Act weighed heavily on smaller firms and hopes of a repeal likely boosted small cap stocks due to expectations of easing regulatory burdens.

(Source: Bloomberg)

This chart shows the relative performance of the Russell 2000 and the Russell 1000 Indexes, or small cap versus large cap stocks, indexed to Election Day.  After a strong rally following the election, small cap stocks have clearly weakened.  We suspect much of this is due to disappointment with the path of policy.

The other item we want to highlight is the path of the dollar.

(Source: Bloomberg)

This chart shows the G-10 dollar index, again from Election Day to the present.  The dollar rose after the election and peaked about 4% from Election Day.  As the Trump agenda has stalled, the dollar has come under pressure and has fallen about 5% below the level seen at the election. If the full GOP agenda had been legislated, it would have been dollar bullish.  Fiscal stimulus, including tax cuts and infrastructure spending, would have boosted demand and likely prompted monetary policy tightening from the FOMC.  At the same time, the border adjustment tax, which would have acted as a tax on imports and a subsidy on exports, would have also boosted the dollar.  Sluggish economic growth and the Republicans’ inability to pass legislation, along with low inflation, have slowed the pace of monetary policy tightening.  The dollar has weakened, in part due to fiscal policy disappointment and the use of short dollar positions to protect against the erratic behavior of the Trump government.

Perhaps the bigger surprise has been the relatively weak performance of commodities despite dollar depreciation.  There is growing evidence that commodity price performance is becoming more sensitive to China.  This year, the Chinese economy has been a bit choppy due to policy uncertainty surrounding October’s Communist Party meetings, which will select the personnel for Chairman Xi’s second term.  Thus, we will be watching to see what Chairman Xi focuses on for his second term.  Will he try to address China’s debt problem through slower growth and a bias toward the household sector, or will he go for growth?  If he picks the latter, commodities will benefit.  If not, they will likely languish.   Slowing the rise in debt is probably the right choice over the long run; however, it is a risky proposition in the short run.  Thus, the safer bet is that he will continue to keep growth elevated which will lead to higher levels of debt.

View the PDF

Weekly Geopolitical Report – Reflections on Nationalism: Part I (August 21, 2017)

by Bill O’Grady

Over the last decade, the West has seen a series of tumultuous events.  Of course, ten years ago the world was trying to cope with the Great Financial Crisis which raised fears of a repeat of the Great Depression.  Although that outcome was avoided, deep underlying problems remain.  Southern Europe faced a series of debt crises, which were followed by a refugee crisis.  Global economic growth has stagnated.  A steady drumbeat of civil unrest continues in the U.S.  Terrorist acts have been occurring in Europe.

As these problems festered, unrest has been expressed through a series of electoral surprises, including Donald Trump in the U.S., Brexit in Europe, Macron in France and nationalist parties in Hungary and Poland.  Meanwhile, Russia has become more aggressive, using hybrid tactics to expand its influence.

In the face of widespread turmoil, it appears appropriate to offer some reflections on one of the key elements of the modern era—the rise of the nation state and how it has evolved to the present day.  This evolution is part of how humans organize themselves.  Human beings are both social creatures and individuals, and how we manage both sides of our nature is a constant tension expressed throughout history.

In Part I of this report, we will begin with a discussion of social contract theory prior to the Enlightenment period, focusing on Thomas Hobbes.  From there, we will examine the two key thinkers of social contract theory during the Enlightenment, John Locke and Jean-Jacques Rousseau.  Part II will recount Western history from the American and French Revolutions into WWII.  We will analyze America’s exercise of hegemony and the key lessons learned from the interwar period.  Part III will begin with a historical analysis of the end of the Cold War and the difficulties that have developed in terms of the post-WWII consensus and current problems.  We will discuss the tensions between the U.S. superpower role and the domestic problems we face, followed by an analysis of populism, including its rise and the dangers inherent in it.  As always, we will conclude with market ramifications.

View the full report