Asset Allocation Weekly (August 18, 2017)

by Asset Allocation Committee

A number of market commentators have suggested current conditions are similar to 1987.  Complacency, shown by the low level of volatility and an elevated P/E, is rampant.  On the other hand, there is no evidence a recession is looming and, although monetary policy is tightening, the Federal Reserve has been raising rates at a slow pace and financial conditions remain at low stress levels.

This chart can help us examine the potential for a correction.

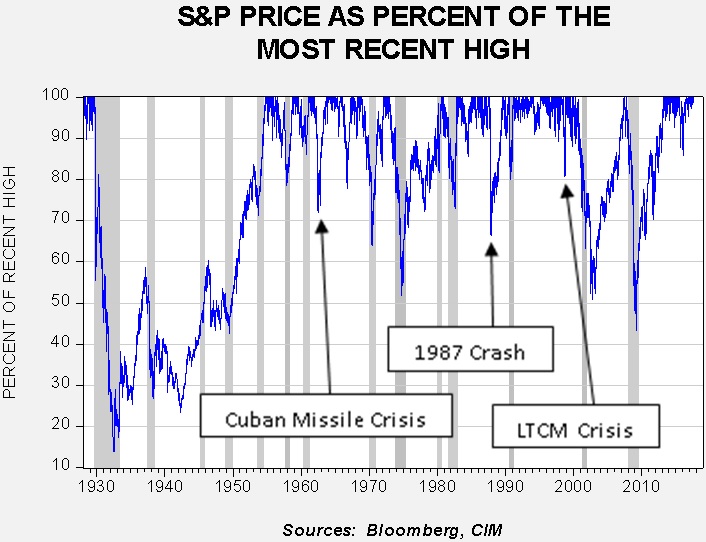
To create this chart, we looked at the daily close for the S&P 500 Index starting on the first trading day of 1928.  Each subsequent close is measured against the most recent closing high.  A reading of 100% means a new high has been attained.  Recessions, shown by the gray bars, tend to have a negative impact on equities; the effect was most obvious during the Great Depression.  We have also noted a few events of interest on the chart.

There are currently two areas of concern.  The first is that the North Korean situation could escalate; clearly, if we have a military event that includes nuclear weapons, then we are in uncharted territory and none of the above history is relevant.  However, we do have the Cuban Missile Crisis as an analogue.  From the S&P 500’s recent closing high of 2490, a repeat of that crisis would trigger a pullback to 1785.  Although that would be sizeable, note that the market recovered quickly.  At present, tensions have cooled and we don’t expect a military event in the near future.

The second area of concern is tied to market complacency.  Market volatility has been very low and investors have been shorting volatility successfully for some time.

(Source: Bloomberg)

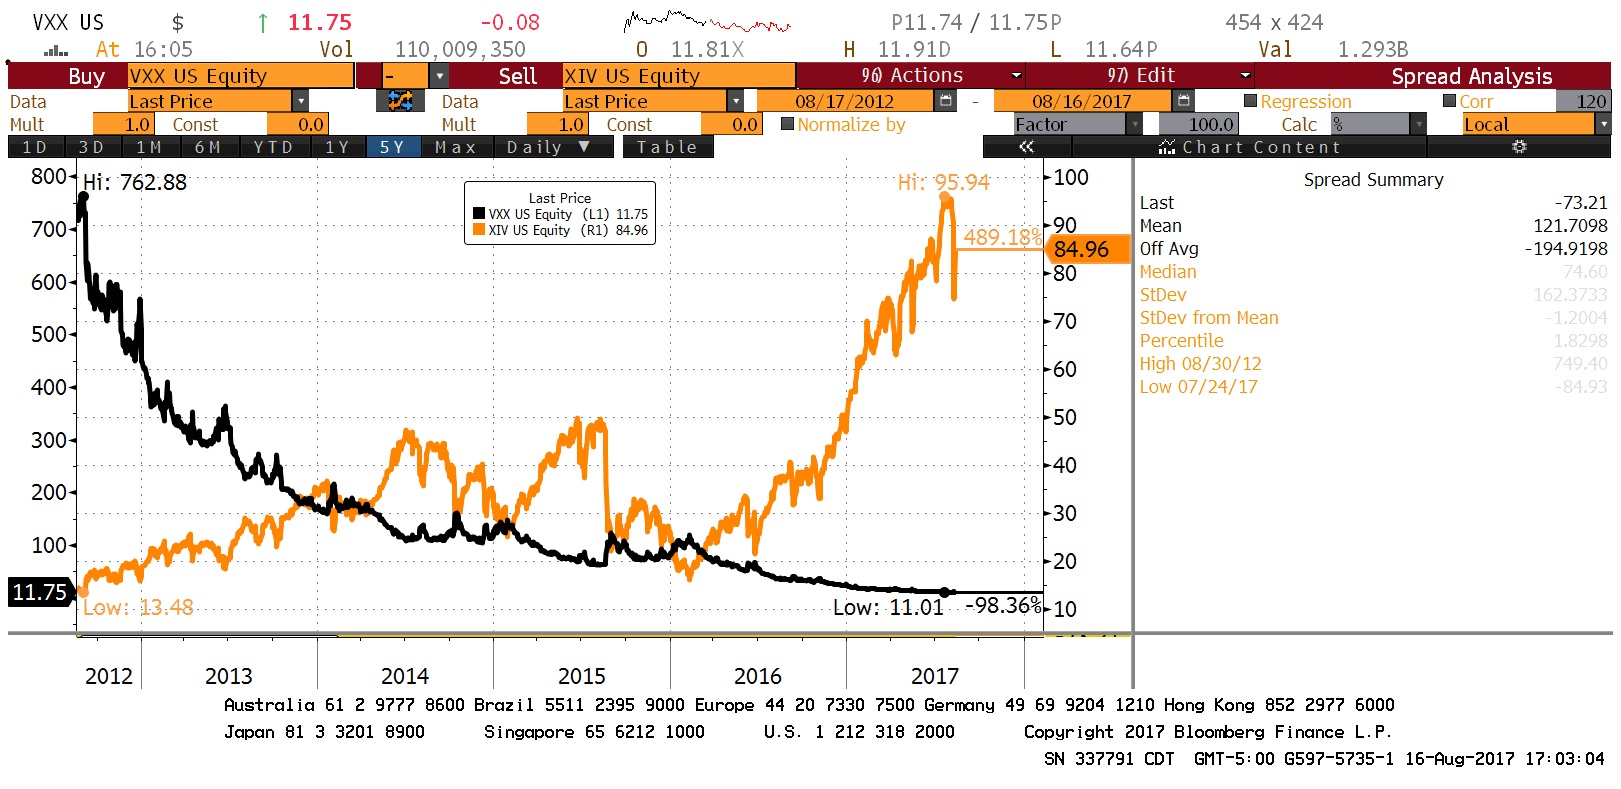
This chart shows the VIX ETF (VXX, 11.75) and the inverse VIX (XIV, 84.96).  This five-year chart shows that those who have been long volatility have suffered steady losses, while those short volatility have generally done well.  However, the gains on being short volatility have accelerated over the past two years.  There have been reports that portfolio managers have been using short volatility in a fashion similar to portfolio insurance in the 1980s.  Portfolio insurance was one of the causal factors of the 1987 Stock Market Crash, shown on the above chart.  Short volatility has become a crowded trade.  If investors reverse these positions quickly, it could create conditions similar to 1987.  A repeat of that outcome yields an S&P of 1636.

It is important to note that in both the 1962 and 1987 events, the economy avoided recession and equities recovered quickly.  Clearly, past performance doesn’t guarantee future outcomes, but as long as a market correction event isn’t driven by a recession then we would expect the decline to be short-term in nature.

Recently, we introduced an economic data/S&P indicator.[1]  It does not suggest a recession-driven market drop is imminent.

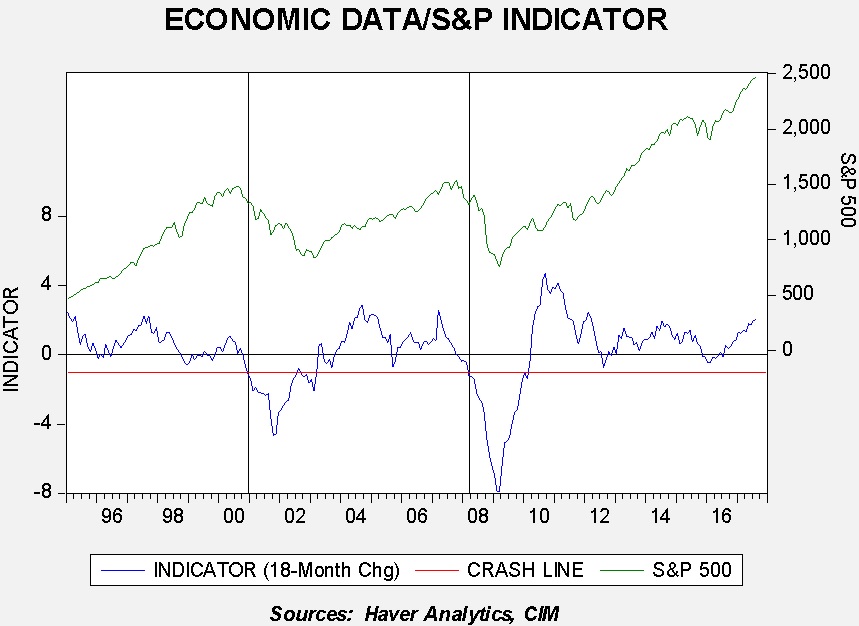
The green line is the monthly average for the S&P 500; the blue line is an indicator built of three economic numbers—initial claims, the CRB commodity index and the Conference Board’s Consumer Confidence data.  We have standardized the economic data and created an indicator, shown on the bottom of the graph.  In general, a positive reading is generally bullish for equities.  We have placed vertical lines on the chart to indicate when the indicator turned negative with persistence.  These are usually periods of falling equities.  This model would tend to suggest that a pullback caused by economic weakness isn’t in the offing, and so an event-driven pullback, though potentially painful, would probably be short-term in nature.

View the PDF


[1] See Asset Allocation Weekly, 6/30/17.

Weekly Geopolitical Report – The Qatar Situation: Part II (August 14, 2017)

by Bill O’Grady

Last week, we discussed a short history of Qatar and its geopolitical imperatives.  This week, we will analyze the events precipitating the blockade, the blockade itself, the GCC’s demands and the impact thus far on Qatar.  We will examine how the situation has reached a stalemate and, as always, we will conclude with market ramifications.

The Precipitating Events
As we discussed last week, a combination of conditions have allowed Qatar to avoid domination by Saudi Arabia, the generally recognized leader of the GCC.  Qatar has powerful allies outside the region, friendly relations with Iran, is demographically unified and has an economy that isn’t dependent on oil, all of which have allowed Qatar to follow independent policies.  This situation has persistently angered Saudi and UAE leaders.  Beneath these national concerns are also long-standing tribal rivalries.

However, these differences have been in place for a long time.  It appears that there were three events that led the GCC, Egypt, Yemen and Sudan to react and initiate the blockade.

View the full report

Asset Allocation Weekly (August 11, 2017)

by Asset Allocation Committee

Although measuring “malaise” is more art than science, overall feelings of wellbeing or the lack thereof affect markets, politics, etc.  One less common way to measure this is the ratio between discretionary spending compared to overall spending.  Discretionary spending is defined as total spending less what is spent on food, clothing, energy and housing.  In other words, if a household is able to spend more on other items besides these goods, one would expect “happier” people.  Spending more on necessities, on the other hand, can make households feel as if they “can’t get ahead.”

This chart shows the ratio of consumer discretionary spending to total personal consumption.  A higher ratio means that households are spending more on discretionary items and less on food, clothing, gas, heat and rent.  Although the ratio has generally increased since the late 1950s, there have been two periods when the pace of improvement slowed, in the 1970s and since 2000.

To better analyze the behavior of this ratio, we regressed the ratio against a time trend.

There have been four periods when this ratio was significantly below trend.  The first was in the early 1960s.  John F. Kennedy’s presidential campaign promised to get America moving again after the somnolent 1950s.  The second occurred during the deep 1973-75 recession, which coincided with the first energy crisis.  The third occurred during the late 1970s into the early 1980s; this period featured a “double dip” recession and another energy crisis.  The 1970s also had major political problems, including the Nixon resignation and the difficult presidency of Jimmy Carter.

The most recent event has been the longest.  The major recession of 2007-09 coupled with a slow recovery and stagnant income growth has led to a period where necessities are taking up a bigger share of spending relative to trend.  It coincides with deep political divisions and a fear among many Americans that stagnation is never-ending.

To some extent, this is an imperfect measure of sentiment.  After all, the trend will eventually reach 100%, which would mean that spending on the four necessities would need to fall to zero (either we stop eating, wearing clothes, driving and living in homes or apartments) or the cost of these goods would approach zero.  Neither scenario is likely.  Still, the fact that spending on necessities is higher than trend relative to other spending has proven, historically, to signal social and political problems.  As one who lived through President Carter’s “malaise” speech, the feeling in the late 1970s was rather bleak.  Ronald Reagan’s optimism was key to lifting the country out of this funk.  The fall in inflation that allowed households to spend less on necessities did the rest.

So far, this period of below-trend spending on discretionary goods has not adversely affected financial markets.  However, it is clearly having an impact on the current political situation and, at some point, it could affect market confidence.  We monitor these conditions closely and are somewhat heartened by the recent improvement in this ratio.  However, this time around, falling prices for energy and food probably won’t be enough to raise this ratio.  Rising wages for the bulk of American households is probably the only way to lift this ratio back to trend.

View the PDF

Weekly Geopolitical Report – The Qatar Situation: Part I (August 7, 2017)

by Bill O’Grady

On June 6th, several members of the Gulf Cooperation Council (GCC)[1] announced a sweeping blockade of Qatar, also a member of the GCC.  The GCC members enforcing the blockade, led by Saudi Arabia, issued a list of 13 demands which Qatar rejected.

Since the blockade was implemented, Qatar has managed to replenish basic foodstuffs that were initially stripped from store shelves as households rushed to hoard necessities.  The emirate state has managed to fly in dairy cows from abroad which are now contentedly supplying milk from air conditioned barns in Qatar.

In the first part of this report, we will offer a short history of Qatar and examine its geopolitical imperatives.  Next week, in Part II, we will analyze the events precipitating the blockade, the blockade itself, the GCC’s demands and the impact thus far on Qatar.  We will examine how the situation has reached a stalemate and, as always, we will conclude with market ramifications.

View the full report


[1] Member states include Saudi Arabia, Kuwait, United Arab Emirates, Qatar, Oman and Bahrain.

Asset Allocation Weekly (August 4, 2017)

by Asset Allocation Committee

Two weeks ago, we detailed our expectations for a weaker dollar.  If we are correct, one of the potential effects could be inflation.  A weaker dollar has two price effects.  First, it directly raises import prices.  Second, it gives pricing power to domestic firms competing with imports as price pressures should dissipate as import prices rise.  The Federal Reserve has struggled with continued low inflation rates as the Phillips Curve models have consistently overestimated inflation.  Perhaps dollar weakness will come to the FOMC’s rescue and lift price levels, allowing the Fed to raise its policy rate.

This chart shows the yearly change in core CPI with the JP Morgan dollar index, which is advanced 18 months.  A cursory view of the chart does suggest that a rising dollar seems to depress inflation, while a falling dollar seems to have the opposite effect.  And, the idea that the dollar’s impact takes place over time is consistent with theory.  This is because foreign firms will initially try to maintain market share by holding prices steady and face margin compression in a weak dollar period and will only move prices higher over time.  The opposite tends to occur during periods of dollar strength as domestic firms attempt to maintain their market share.

However, as much as our eyes see the above pattern, the statistical impact is actually rather weak.  The correlation is only a mere 5%.  There are clearly other factors that are keeping core inflation low; we believe the long-term effects of deregulation and globalization play a much more important role.  Thus, as we discussed two weeks ago, the dollar should have an important impact on foreign equity performance but probably only a modest effect on core inflation.

View the PDF

Weekly Geopolitical Report – A Coup in Riyadh (July 31, 2017)

by Bill O’Grady

On June 20th, King Salman of Saudi Arabia announced that his son, Prince Mohammed bin Salman (MbS, as he is affectionately known), would be the new crown prince, replacing Prince Mohammed bin Nayef.  Although the move was momentous, it was not necessarily unexpected.  MbS’s stature in the kingdom had been rising since he was appointed as deputy crown prince in 2015, while Prince Nayef, who had been appointed as crown prince at the same time, held a lower profile and was generally overshadowed by his younger cousin.

However, over the past two weeks, details of the change emerged in the major U.S. media.[1]  Although the initial reports suggested the change was consensual, recent articles, referenced below, make it clear that Prince Nayef was ousted.

In this report, we will discuss the history of the succession of Saudi kings to highlight how the eventual ascension of MbS will represent a major break with history.  We will then examine the details of the ouster and the potential for opposition to MbS taking power.  We will analyze what the eventual kingship of MbS might mean for the region.  As always, we will conclude with market ramifications.

View the full report


[1] http://www.reuters.com/article/us-saudi-palace-coup-idUSKBN1A41IS

https://www.nytimes.com/2017/07/18/world/middleeast/saudi-arabia-mohammed-bin-nayef-mohammed-bin-salman.html?mcubz=0&_r=0

https://www.wsj.com/articles/how-a-saudi-prince-unseated-his-cousin-to-become-the-kingdoms-heir-apparent-1500473999

Asset Allocation Weekly (July 28, 2017)

by Asset Allocation Committee

As the S&P 500 steadily rises to new highs, concerns about a correction will likely increase.  Since 1987, major market pullbacks have been associated with recessions and there isn’t much evidence to suggest the business cycle is set to turn.  In the absence of a recession, we tend to look for factors that could trigger a market decline.

The first factor we are watching is liquidity.

This chart examines the S&P 500 on a weekly close basis compared to the level of retail money market funds.  Since the Great Financial crisis, equity markets have tended to trend upward until money market fund levels fall to around $900 bn.  These periods are shown in orange on the above chart.  It appears that households are uncomfortable with cash levels much below this level and buying tends to “dry up” once money market assets fall to around $900 bn.  Current cash levels appear ample which will probably support steady gains in equities.

Exogenous events are another factor.  These can be political, social, geopolitical, etc.  There is a myriad of potential events that could undermine investor sentiment, including instability in the Middle East, an escalation of tensions with North Korea, a debt ceiling crisis or disappointment on tax reform, to name a few.  In terms of the usual political cycle, we are rapidly approaching a period where “disenchantment” sets in.

This chart shows the performance of the S&P 500 on a weekly close basis, indexed to the first weekly close of the election year.  Our study begins in 1928.  We have segregated new GOP administrations in the average and compared market action to the current administration.  Although the fit isn’t perfect, the general direction of the market under Trump is reasonably consistent with past incoming Republican presidents.  If the pattern continues, this study would suggest a period of weakness is in the offing.  We use these studies more for signals of trend, not necessarily as pure forecasts.  And, because they are historical studies, their relevance is somewhat questionable in that the issues surrounding each administration are different.  Still, the chart does suggest that a GOP win initially raises investor sentiment but this sentiment appears to deteriorate sometime in late summer of the first year in office, as the difficulties of legislating become more obvious.  With the current turmoil in Washington, not to mention a broad set of geopolitical issues, a period of market turbulence would not be a shock.

Combining the two studies would suggest that there is enough available liquidity to prevent a significant pullback as suggested by the election year chart.  We would not be surprised to see a few weeks of market consolidation, especially if tax reform talks stall or other issues arise.  However, there is nothing in the data that suggests a recession is imminent and thus pullbacks in equities will probably be modest.

View the PDF

Keller Quarterly (July 2017)

Letter to Investors

It’s terribly hot here in the Midwest.  It wouldn’t be a normal Missouri summer if it didn’t touch 100 degrees for a week or two.  As uncomfortable as it is, what makes it tolerable is the knowledge that in a couple of months the brutal heat will have left us and a beautiful autumn will be beginning.  We know this will happen because we think cyclically about the weather.  We know that the weather runs in cycles and that when it reaches extremes, we can rest in the knowledge that it will revert back to the mean again, and then back to the other extreme.  We have learned to think cyclically about the weather because: 1) we have learned by experience that the seasons run in cycles, and 2) the cycles are regular enough that we know to expect a reversal when the temperatures reach 100.

It’s my observation that very few people think that way about the economy or the financial markets.  Most people think about the economy and the stock market in a linear fashion, that is, they believe that the economy moves in a straight line indefinitely, usually upward sloping.  If it goes down substantially, the conventional wisdom is that something very bad has happened, or that something like a financial accident has occurred.  Usually, people look for someone on whom to blame this financial disaster.  Even more amazing, once a downtrend is in place, many people begin to think of that linearly as well.  “The market is going down and it will never get better,” they think.  The possibility that financial ups and downs are cyclical, perhaps not as regular as the seasons, but cyclical nonetheless, rarely enters the mind.

It’s not just average people who think linearly about the economy and the financial markets, many professionals, including economists, think this way as well.  When the next recession comes along, just watch how many economists are introduced to tell us exactly who is at fault for allowing this terrible thing to happen.  Here at Confluence we are big fans of the late economist Hyman Minsky (1919-1996), and not just because he taught at Washington University in St. Louis for 25 years.  At a time when many economists thought that the economy could and should be managed for optimal and long-lasting growth, and that recessions could be avoided, Minsky taught what he called the financial instability hypothesis.  Essentially, he taught that financial instability was inherent in the system, “that the financial system swings between robustness and fragility and these swings are an integral part of the process that generates business cycles.”  In other words, the swings between strength and fragility in the financial system are normal and cyclical.

The idea is really quite simple: the longer times are good, the more people will begin to think the economy will always be good, and the more likely they will make financial decisions that are inherently risky, such as take on additional debt.  Eventually all these risky actions accumulate as a great burden on the economy, people can’t pay their debts and the economy cycles in the other direction for a little while.  Once excessive debt is liquidated, the economy starts back the other way.  Because the economic and market cycles are not as regular as the seasons, people have a hard time recognizing them.  Because policy-makers in Washington (such as the Fed) try to ameliorate the cycles and make the good times last longer, people begin to think that economic cycles have been “outlawed.”

We think that the cyclical nature of people’s behavior and, thus, the economy, is baked into the way the financial world works.  Therefore, we analyze the cyclical nature of the economy, and the effect of those cycles on various asset classes and on the stocks of various companies.  This doesn’t mean we can predict the future, but we believe that approaching the economy and the markets under the correct framework (cyclical versus linear) is essential to mitigating the risk of being wrong.

We appreciate your confidence in us.


Gratefully,

Mark A. Keller, CFA
CEO and Chief Investment Officer

View the PDF

Weekly Geopolitical Report – A Productivity Boom: A Response to Robert Gordon, Part II (July 24, 2017)

by Bill O’Grady

Last week, we began an analysis of Michael Mandel and Bret Swanson’s paper[1] which is a response to Robert Gordon’s argument that the West is doomed to a prolonged period of slow productivity growth.

In Part I of this report, we examined the productivity issue and discussed Mandel and Swanson’s analysis of the situation, focusing on their specific division of industries.  This week, we will look at six sectors of the economy that appear poised to digitize and how that could change the economy.  We will also discuss the conditions necessary for Mandel and Swanson’s position to be correct.  As always, we will conclude with market ramifications.

The Six Sectors
Mandel and Swanson’s six sectors are transportation, energy, education and training, retail and wholesale distribution, manufacturing and health care.  We will discuss them in that order.

View the full report


[1] http://www.techceocouncil.org/clientuploads/reports/TCC%20Productivity%20Boom%20FINAL.pdf