by Bill O’Grady, Thomas Wash, and Patrick Fearon-Hernandez, CFA
[Posted: 9:30 AM EST]
It’s Monday. Global markets remain in risk-off mode after the Senate’s first swing at the third phase of the rescue package fails. BREAKING: FED GIVEN BROADER POWERS TO INTERVENE IN FINANCIAL MARKETS—MORE BELOW—S&P FUTURES RECOVER. We update the COVID-19 virus news. Here are the details:
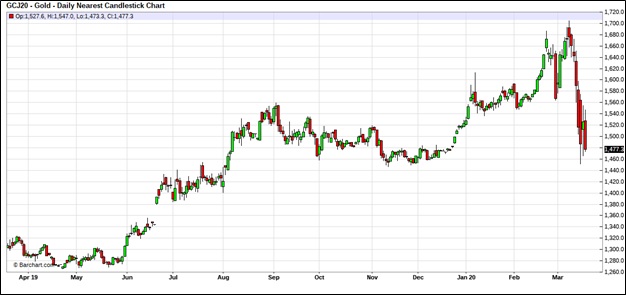
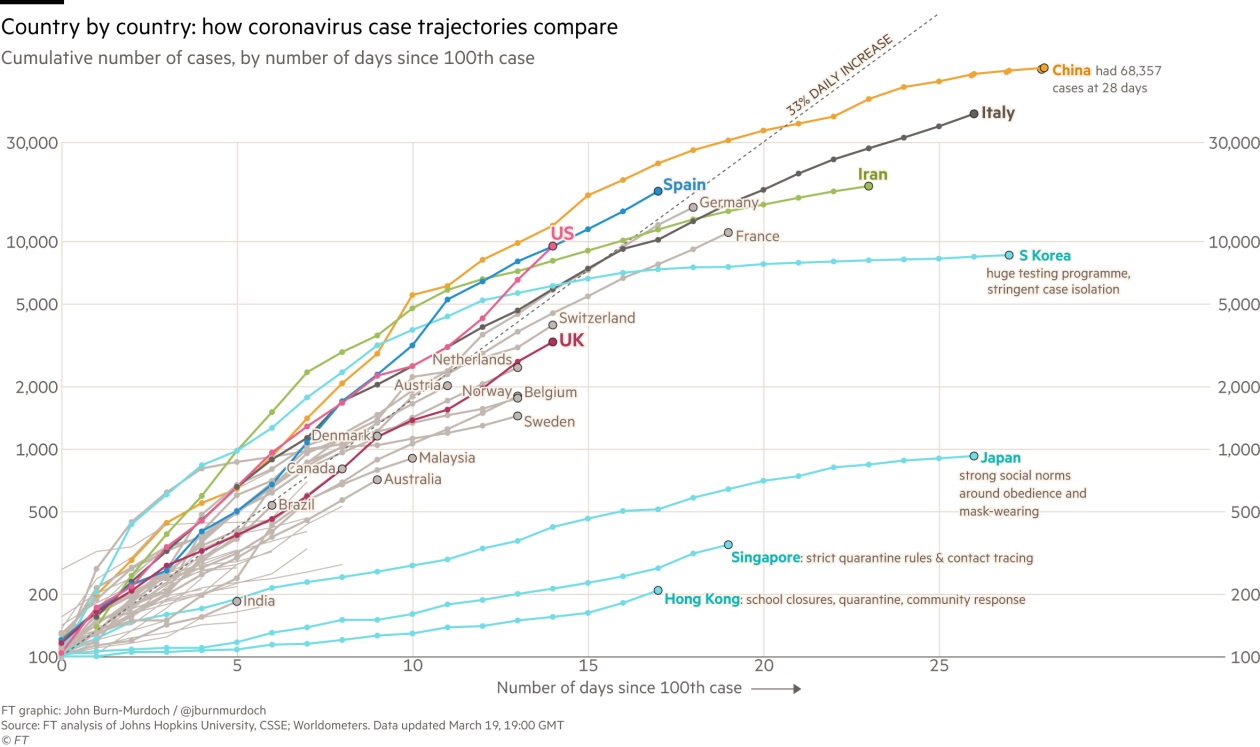
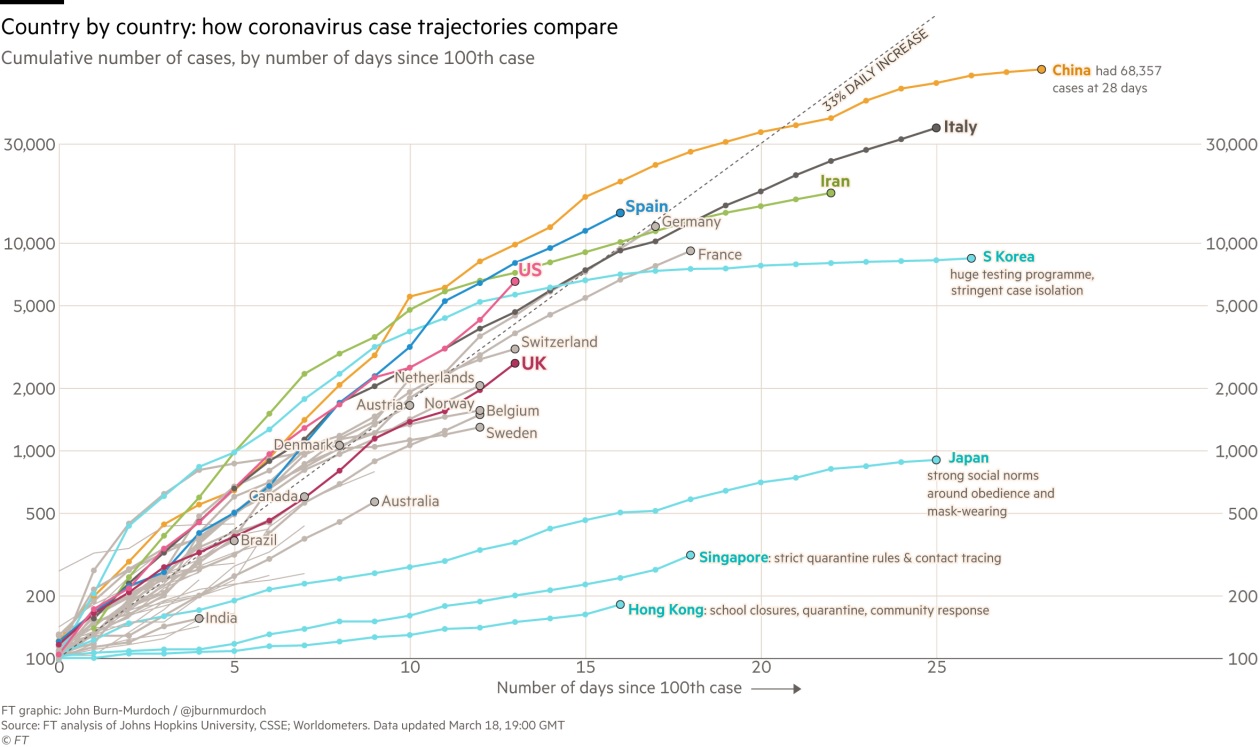
COVID-19: The world now has 349,211 reported cases of COVID-19, with 15,308 fatalities and 100,165 recoveries. Here is another link to a new site we have found on tracking the virus, along with a chart of infections from the FT:

The U.S. pace of infections is rising rapidly; this is probably more about increased testing. Sadly, there is no evidence of the bend we usually see when a country is getting on top of the spread.
The virus news:
- In a disturbing development, there has been a rise of new cases in Asia. It appears the majority of these cases are from travelers. We would expect this development to encourage further steps to restrict travel.
- India has gone into lockdown as the virus begins to spread.
- Chancellor Merkel is in self-quarantine after meeting with a doctor who tested positive for the virus.
- The National Guard has been activated in three states.
- Rand Paul (R-KY) is the first senator to test positive for COVID-19.
- The limited amount of testing for the virus has led to a dearth of information about how it spreads. Only South Korea has engaged in massive testing. An interesting natural experiment has emerged in the NBA. After Utah Jazz center Rudy Gobert fell ill from the virus, eight other teams were tested and 13 players, coaches or staff were found to be infected. Of these 13, seven were asymptomatic. If we had better testing, it would be easier to limit isolation to only those most vulnerable and also allow us to isolate those who are not infected from those who are but are asymptomatic. In the end, the real lesson from the pandemic may be that aggressive testing is the secret to containing the virus with the least economic damage.
- Iran is getting clobbered by the virus. Much of this is because it needed new trading partners after sanctions returned and those partners have been hit by the disease.
- British pubs have been closed. European isolation measures escalate as infections rise. New Zealand and Australia join the rest of the world in restrictions; Greece, too.
- There is great hope that the onset of spring and summer will lead to a decline in the infection rate. Opinion is divided among epidemiologists. However, even if it does, COVID-19 may return in the fall.
The policy news:
- As expected, the first attempt at a fiscal response has failed. Although this is a disappointment, we do expect a package before Friday. McConnell crafted a law for his caucus and calculated that either (a) the opposition would swallow the bill, or (b) he could hang the disappointment on the Democrats. He may have miscalculated. Much has changed since TARP. The narrative that emerged from 2008 was that the bailouts were only for the Establishment and the less affluent were left to bear the burden of adjustment. This time around, the Democrats are pushing for a much broader set of measures that will help lower paid workers. In order to do this, we expect the final bill to create restrictions for business that will make it much more labor friendly.
- Uber (UBER, 21.33) is asking for its drivers to get help in the final package. The current package did not offer any support for “gig” workers.
- More support for small business, including loans, will likely need to be expanded. There is nearly universal support among mainstream conservative and liberal economists on this issue.
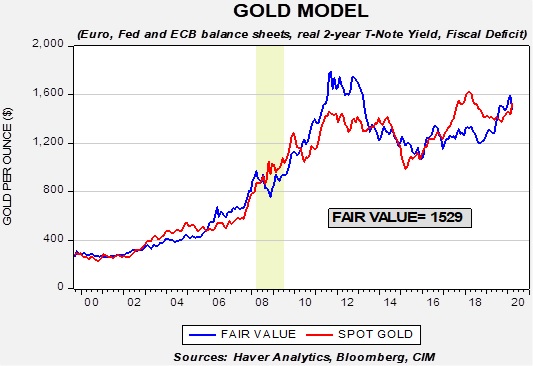
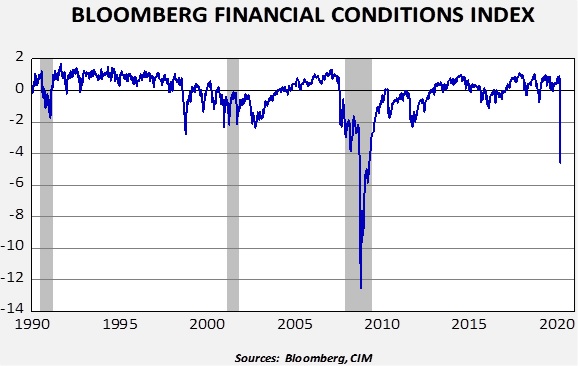
- With apologies for burying the lede, the Fed is wheeling out the nuclear option, getting a mandate to buy debt broadly. This is a clear attempt to narrow credit spreads. Signs of stress in the financial markets have become numerous:
- Reports of stress in money markets have emerged. At least two sponsors have been forced to inject funds into money markets to prevent the “breaking of the buck.” Money market fund shares falling below $1 is a modern-day version of a bank run.
- A subprime mortgage specialist is seeking buyers for assets, a sign of stress.
- Pimco is backing away from corporate bonds.
- Blackrock (BLK, 354.72) and Vanguard (VTI, 115.19) announced higher costs for cash redemptions for some ETFs, an indication of tighter liquidity.
- S&P projects junk bond defaults of 10% over the next year, a three-fold increase.
- Dollar strength is a clear indication of funding strains globally.
- In Britain, regulators are pressing companies to delay releasing earnings.
- Complicated trades designed to offer higher yields in a low rate environment are being exposed to the risks they have taken.
- The recovery in equity futures suggests that much of the worry in the stock market was less about the drop in economic growth and more about the lack of liquidity. The Fed’s decision to expand its mandate to add other bonds to its balance sheet should quell some of these concerns and narrow credit spreads to more manageable levels. This link discusses details of the Fed’s actions; it looks massive, although some of the plans will require additional support from the Treasury. In our recent report updating the 2020 Outlook, we noted three threats—COVID-19, the oil shock and a looming financial crisis. The Fed may now have the tools to prevent the third element. This is good news but it doesn’t eliminate the other two risks.
- One of the problems policymakers face is the tradeoff between managing the spread of COVID-19 and the severe damage the mitigation measures have on the economy. There are signs that the White House may be concluding it is going to lean policy toward the economy at the risk of propagating the spread of the virus. This is a difficult tradeoff; if restrictions are relaxed and infections and deaths surge, it would be catastrophic. But, maintaining these restrictions could lead to economic outcomes that rival the Great Depression.
The economic news:
- Dire forecasts are becoming the norm. St. Louis Fed President Bullard made headlines suggesting that unemployment could hit 30%. Millions of jobs are projected to be lost. Firms are announcing mass layoffs. We have been expecting a 10% drop in annualized real GDP for Q2; our forecast is looking rather conservative compared to others.
- Even if the U.S. government relaxes restrictions, state and local governments may not comply. After all, it is those governments that bear the cost of adjustment. The key to saving the economy is massive fiscal stimulus—probably in the order of $2.0 trillion at least. There are risks to doing this, which we will discuss in the coming weeks. But, the risk of doing too little is very high.
- Despite everything, the Atlanta FRB GDPNow forecast for Q1 is still running at 3.1%. Given the problems seen in March, we expect that to come down but the real falloff won’t emerge until Q2.
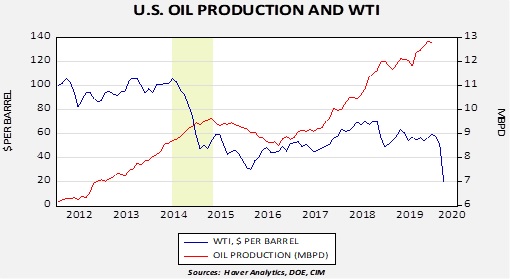
Odds and ends: The Marines are retooling their planning, preparing for war in the Asia-Pacific and reducing training for the Middle East. Saudi Arabia intends to maintain the oil share war through borrowing.