Weekly Geopolitical Report – The Malevolent Hegemon: Part II (December 3, 2018)

by Bill O’Grady

In Part I, we examined the basic role of the hegemon and the unique model the U.S. has created, which we dubbed the “Benevolent Hegemon.”  This week, we discuss why many Americans have become disenchanted with this model, which is pressuring policymakers to either jettison the superpower role or significantly redefine it.  Next week, we will conclude the series by discussing the emergence of a new hegemonic model we call the “Malevolent Hegemon.”

The Costs of Benevolence
The U.S. did not naturally aspire to hegemony.  From a geographic perspective, the U.S. lives in splendid isolation; neither Mexico nor Canada is a major military threat.  As Otto Von Bismarck noted, the U.S. is “surrounded by weak powers and fish.”  Unlike many nations, the U.S. can choose whether or not it wants to be involved in the world.  Paradoxically, this also means the U.S. is an ideal superpower because it faces no local threats and doesn’t need to devote resources to protect against nearby threats.

Americans did view the threat of communism as significant enough to accept the substantial costs of hegemony.  Here are some of the changes entailed in accepting the superpower role:

View the full report

Asset Allocation Weekly (November 30, 2018)

by Asset Allocation Committee

As the FOMC raises rates, there are increasing concerns about the credit markets.  After a long period of low rates, credit spreads are starting to widen, raising fears of financial stress.  In this report, we will look at these concerns.

First, here is what we are seeing with credit spreads:

This chart looks at the spread between 10-year T-notes and similar term Baa corporates.  The average and standard deviation lines are calculated from 1921.  Currently, the spread is about average but it has been widening recently.

Second, here is the impact of monetary policy on credit spreads:

This chart examines credit spreads with periods of policy tightening.  Although policy tightening may bring conditions that trigger a widening of credit spreads, in reality, periods of tightening usually coincide with narrowing credit spreads.  This is because the FOMC usually raises rates in response to positive economic conditions, which, coincidentally, are also consistent with conditions that support firms’ ability to service debt.  Credit spreads tend to widen when the Fed is easing rates.

Third, the key trigger to widening credit spreads is economic conditions.

This chart shows the Chicago Federal Reserve Bank’s National Activity Index along with the T-note/Baa credit spread.  The national activity index uses 85 variables to track the economy; we smooth the raw data with a six-month moving average.  A reading of zero indicates an economy growing at trend.  Thus, a reading below zero suggests a weakening economy.  Note how credit spreads widen when the index dips below zero.  The two series are correlated at -71.9%.  A regression based on this relationship suggests that the recent widening of the T-note/Baa spread is mostly a rise toward fair value.

The regression suggests the spread had become too narrow given the performance of the economy.  The recent widening has mostly moved the spread back to fair value.  Although it is possible the spread could widen further, it would not be justified based on the performance of the economy.  For this reason, we still view credit risk as manageable.

View the PDF

Weekly Geopolitical Report – The Malevolent Hegemon: Part I (November 26, 2018)

by Bill O’Grady

Since the election of Donald Trump, there has been much discussion about the demise of the “Liberal International Order,” or LIO.  Several books on the topic have been published recently[1] and the general tenor is that the U.S. is giving up global leadership and the world is in trouble.  We have been making this argument as well for a rather long time.  However, there is an alternative viewpoint, which is that the U.S. isn’t giving up global leadership but is ending the LIO for something different.

What we may be seeing is not a retreat from the world but a significant change in management style, hence the title of this week’s report.  We have dubbed this new style “The Malevolent Hegemon,” as opposed to “The Benevolent Hegemon” or the LIO, which describe how the U.S. managed the world from 1945 until 2008.  We argue that the LIO began to wane under the Obama administration but a replacement model wasn’t evident.  The Trump administration does appear to be creating a new model of hegemony.

In Part I of this series, we will begin with the basics of hegemony.  From there, we will describe the unique model of U.S. dominance, Pax Americana, with the U.S. as a benevolent hegemon.  Part II will discuss why the U.S. has become jaded with this role, which has spawned the search for another model.  Part III will analyze what appears to be the emergence of a new model, which we describe as the malevolent hegemon.  We will discuss the differences between the two models.  With this analysis in place, we will examine the possible outcomes from this shift.  At the conclusion of the series, we will discuss potential market ramifications.

View the full report


[1] https://www.publicaffairsbooks.com/titles/ivo-h-daalder/the-empty-throne/9781541773875/ and https://www.brookings.edu/books/the-jungle-grows-back-america-and-our-imperiled-world/

Asset Allocation Weekly (November 16, 2018)

by Asset Allocation Committee

(NB: Due to the Thanksgiving holiday, the next report will be published on November 30.)

Last year, we introduced an indicator of the basic health of the economy and added it to the many charts we monitor to gauge market conditions.  The indicator is constructed with commodity prices, initial claims and consumer confidence.  The thesis behind this indicator is that these three components should offer a simple and clear picture of the economy; in other words, rising initial claims coupled with falling commodity prices and consumer confidence is a warning that a downturn may be imminent.  The opposite condition should support further economic recovery.  In this report, we will update the indicator with October data.

This chart shows the results of the indicator and the S&P 500 since 1995.  The updated chart shows that the economy is doing quite well.  We have placed vertical lines at certain points when the indicator falls below zero.  Although it works fairly well as a signal that equities are turning lower, there is a lag.  In other words, by the time this indicator suggests the economy is in trouble, the recession is likely near or underway and the equity markets have already begun their decline.

To make the indicator more sensitive, we took the 18-month change and put the signal threshold at -1.0.  This provides an earlier bearish signal and also eliminates the false positives that the zero threshold generates.  Notwithstanding, we will pay close attention when the 18-month change approaches zero.

What does the indicator say now?  The economy is healthy and currently supportive for equity markets.  Thus, the recent weakness in equities is not due to the economy but other factors, including monetary and trade policy.  The good news is that if there is any reduction in concern over these issues then the economic data would likely support stronger equity prices.  The negative news is that there isn’t much evidence yet to expect a pause in Fed tightening or a systemic easing of trade tensions.  Thus, for the time being, equities will struggle to challenge recent highs.

View the PDF

Weekly Geopolitical Report – Reflections on the Khashoggi Incident: Part II (November 12, 2018)

by Bill O’Grady

(NB: Due to the Thanksgiving holiday, the next report will be published on November 26.)

Last week, we discussed the issue of succession in the Kingdom of Saudi Arabia (KSA).  In Part II, we will begin with a discussion of the regional power rivalry between Turkey and the KSA, then outline Turkish President Erdogan’s actions in the wake of Khashoggi’s homicide.  We will analyze U.S. policy goals in the region followed by our expectations for the resolution of this incident.  As always, we will conclude with market ramifications.

Turkey versus the KSA
The Khashoggi incident and Turkey’s involvement should be understood within the context of a long-running rivalry.  Both nations want to dominate the Sunni-aligned nations of the Middle East.  Turkey sees this role as its natural “birthright” due to the nearly 600-year dominance of the Ottoman Empire.  Saudi Arabia believes the role of leading the Sunnis in the region is part of its position as defender of the Muslim holy sites of Mecca and Medina.  Both nations have sharply differing views of how that dominance should be exercised.

View the full report

Asset Allocation Weekly (November 9, 2018)

by Asset Allocation Committee

In light of rising interest rates, this week we will take a look at credit spreads.  But, before doing that, it makes sense to examine overall Treasury valuation.

This chart is our 10-year T-note model.  It incorporates fed funds, the Japanese yen exchange rate, German sovereign 10-year yields, oil prices, the fiscal deficit as a percentage of GDP and an inflation proxy.[1]

This model does suggest current 10-year yields are elevated, but not at extreme levels.  However, if we assume a terminal fed funds rate of 3.25%, assuming no change in the rest of the variables in the model, fair value for the 10-year rises to 3.27%, which is near current levels.  Thus, we can postulate that current yields have discounted about 100 bps of further tightening.  Another interesting note is that the most significant variables in the model are fed funds and the inflation proxy.  Just using these two variables in the model yields a fair value of 3.60%; if we assume another 100 bps of tightening, the terminal 10-year yield ends up at 4.10%.  Compared to the broader model, it is clear that overseas factors, especially German yields, are keeping U.S. yields from rising faster.  Overall, we don’t expect these foreign factors or oil prices to change in such a way as to support higher yields, so we don’t expect a rise in the 10-year yield to exceed 3.50% unless (a) inflation expectations become unanchored, or (b) the FOMC signals it will raise rates much more than expected.

Thus far, the impact on credit spreads from rising Treasury yields has been minor.  The chart below shows investment grade spreads.  Current investment grade spreads are holding near their long-term average.

High-yield spreads have nudged higher but remain tight, with spreads holding near the bottom of their historical ranges.

The lack of spread widening is consistent with the continued low level of stress in the financial system.

This chart shows fed funds with the Chicago FRB National Financial Conditions Index; the index rises when stress increases (or, put another way, when financial conditions deteriorate).  From 1973 (when the index data begins) until 1997, the two series were tightly correlated; if the FOMC raised rates, stress rose.  Stress was a “force multiplier” for monetary policy.  We believe increasing transparency has removed this “tool” from the Fed; now, financial participants can so easily project the path of policy that they don’t necessarily fear the rising rates.  And so, instead of seeing participants react to stress as policy tightens, we now have a situation where stress remains low only to soar.  Credit spreads are a key component of the aforementioned conditions index.  If spreads begin to widen, they could do so rapidly, leading to significant market disruptions.  For now, all is calm, but we continue to closely watch market conditions because when they begin to deteriorate they tend to so rapidly.  In asset allocation, we have tended to favor investment grade spread products but are less favorable toward high yield.  If conditions start to deteriorate, we will shift allocations toward Treasuries.

View the PDF


[1] For an inflation proxy, we use the 15-year moving average of the yearly change in CPI.  This is based off research by Milton Friedman, who postulated that investors build their inflation expectations over a long time frame.

Weekly Geopolitical Report – Reflections on the Khashoggi Incident: Part I (November 5, 2018)

by Bill O’Grady

Jamal Khashoggi, a well-connected Saudi journalist, entered the Saudi consulate in Istanbul on October 2nd and has not been seen since.  His apparent death (at the time of this writing, no body has been produced) has caused an international incident.

The assumed death of Khashoggi highlights a number of issues for the Middle East that we will explore in this two-part series.  This homicide did not occur in a vacuum and the context of this event could have broader ramifications for the region.  We will not recount the events leading to his death nor dwell on the details of the apparent murder, which have been widely reported in the world media.  However, our decision to not discuss the details of the event does not mean we overlook it on a human level.  What happened to Khashoggi was terrible, but the focus of this report is to give context to this ugly event.

In Part I of this report, we will begin with the particular problem of kingly succession in the Kingdom of Saudi Arabia (KSA).  We will pay particular attention to the generational change in power that Crown Prince Mohammad bin Salman (MbS) represents.  We will note the history of earlier successions and examine the potential for instability if King Salman dies and MbS remains crown prince.  Part II will deal with the regional power rivalry between Turkey and the KSA, along with Turkish President Erdogan’s actions in the wake of this homicide.  We will analyze U.S. policy goals in the region followed by our expectations for the resolution of this incident.  As always, we will conclude with market ramifications.

View the full report

Asset Allocation Weekly (November 2, 2018)

by Asset Allocation Committee

In light of the recent pullback in equities, there has been rising speculation that the FOMC might not increase rates as much as projected.  Although possible, we are not seeing much evidence to support this position.

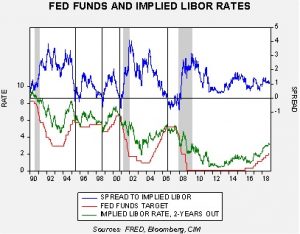
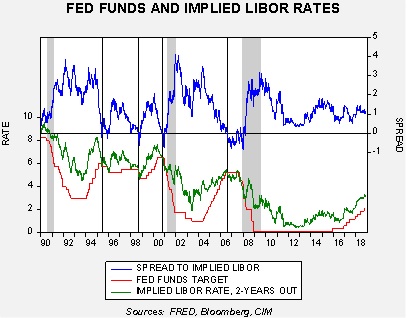
This chart shows the fed funds target along with the implied three-month LIBOR rate, two years deferred, from the Eurodollar futures market.  The upper line shows the spread between the two rates.  We have placed vertical lines where the spread inverts.  The spread inversion has tended to signal the end of the tightening cycle.

Although the implied rate has eased from a peak of 3.30% in early October to 3.15% in the most recent reading, the overall target remains the same.  The Fed, based on this analysis, will raise rates another 100 bps.  The key question is if such a rate hike were implemented, would it lead to recession?

The answer to that question is whether a 3.25% policy rate would be considered “tight”?  And, the answer to the second question is all about the degree of slack in the economy.  If the FOMC is raising rates into an economy without much excess capacity, it is unlikely that it will take rates to a level of restrictive policy.  On the other hand, if there is still slack in the economy then raising rates to the level implied by deferred Eurodollar futures could, indeed, be too tight.

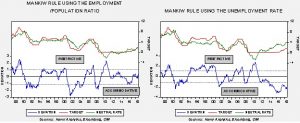
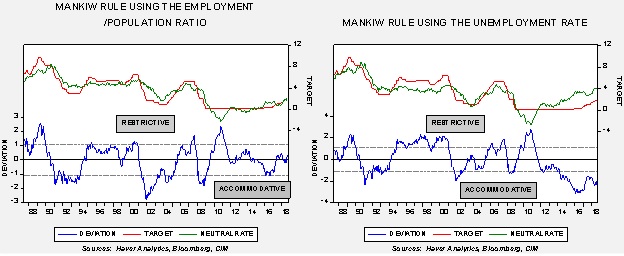
These charts show the results of the Mankiw rule, a simplified version of the Taylor rule.  These charts show two different variations for measuring slack.  Mankiw’s original model used core CPI and the unemployment rate.  That model is shown on the right.  We have created a different variation on the left, which uses the employment/population ratio.  The unemployment model suggests that policymakers are woefully behind the curve; the neutral rate is 4.00% with restrictive policy not achieved until fed funds reach 5.50%.  The employment/population model suggests the Fed has already achieved a neutral policy and should stop raising rates now.  The neutral rate, according to this variation, is 1.75% with restrictive policy achieved at 2.75%.

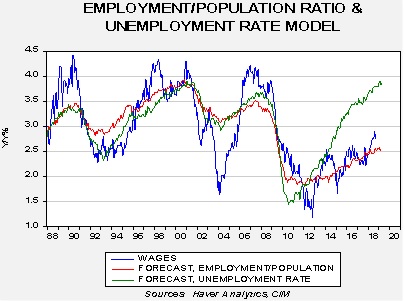
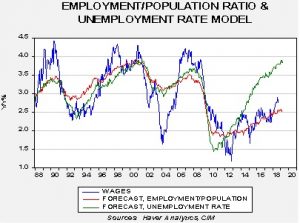
Which model is correct?  We believe the employment/population model is likely the most accurate.  The chart below shows a model that projects the yearly growth in wages for non-supervisory workers based either on the unemployment rate or the employment/population ratio.  Both variations did about the same during the cycles since 1988, but, in the current cycle, the employment/population ratio has done a superior job of estimating wage growth.  Based on the unemployment rate, wage growth should be approaching 4.0%, while the employment/ population ratio estimates a growth rate of 2.5%, a much closer estimate during this recovery and expansion.  We are seeing some upward “creep” in wage growth but that may be tied to recent increases in the minimum wage.  If so, the growth rate should slow because such changes tend to be infrequent.

So, what is the FOMC actually doing?  It appears they are trying to pick a point between the extremes of the Mankiw variations.  However, if the employment/population ratio is the right model, barring a strong improvement in this number, the FOMC is moving into dangerous territory.  Given the caution shown by the Fed, we would expect to see greater concern about moving too quickly and increased talk of a “pause.”

It is important to remember that all FOMC meetings next year will have a press conference, making each meeting a chance to raise rates…or not!  If the Fed begins to show signs that it is approaching neutral, we would expect equities and debt to rally.  We would not expect to see such indications in December but could in early 2019.  Therefore, we will continue to closely monitor the behavior of deferred Eurodollar futures.  If the two-year implied rate begins to decline, we may be close to ending this tightening cycle.

View the PDF

Weekly Geopolitical Report – Return of the Strongman: Part II (October 29, 2018)

by Thomas Wash

The populist wave has officially made its way to Brazil. In a blow to the establishment, Brazilian voters have elected former military officer Jair Bolsonaro as president. As Brazil continues to struggle with its recovery from the country’s worst recession in its history, the public has turned its back on the mainstream political parties. A recent poll showed that 60% of Brazilians wanted a political outsider as president. Growing resentment for the traditional parties is likely due to corruption scandals, a historically high unemployment rate and a rising murder rate which set back-to-back records in 2017 and 2018.

To the chagrin of the establishment, Bolsonaro was able to wield his brash and antagonistic rhetoric as an asset, gaining popularity for his blatant disregard for political correctness. For example, he has been quoted as saying the following: the military’s only mistake was that it did not kill enough people; residents of Quilombo shouldn’t be allowed to procreate; and he would shut down the government the same day he is elected president.[1], [2] Bolsonaro’s victory is seen by some as a threat to Brazil’s democracy. As a result, we would expect anti-Bolsonaro protests throughout Brazil. That being said, while some people found his victory frightening, investors seemed relieved as the markets still preferred Bolsonaro to any member of the Workers’ Party (PT). The chart below shows the Brazilian real strengthening against the dollar.

(Source: Bloomberg)

In Part II of this report, we will discuss Jair Bolsonaro’s background and ideology, along with why markets find him appealing. As usual, we will conclude with potential market ramifications.

View the full report


[1] https://www.bbc.com/news/world-latin-america-45965925

[2]https://www.express.co.uk/news/world/1037819/brazil-election-2018-president-jair-bolsonaro-far-right-full-dictatorship