

Asset Allocation Weekly (March 20, 2020)
by Asset Allocation Committee
During the recent market tumult, gold has performed rather well, until lately.
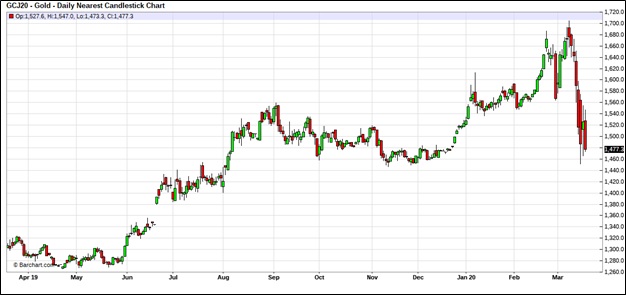
This chart shows the nearest gold futures contract over the past year. From mid-January, when reports of COVID-19 began to circulate, gold prices marched steadily higher, making an intraday high of $1,704.30. Since then, this has declined by over $250 per ounce. This drop is occurring despite a series of measures designed that would normally support gold prices, e.g., the return of zero fed funds, new quantitative easing, plans for massive fiscal spending, etc.
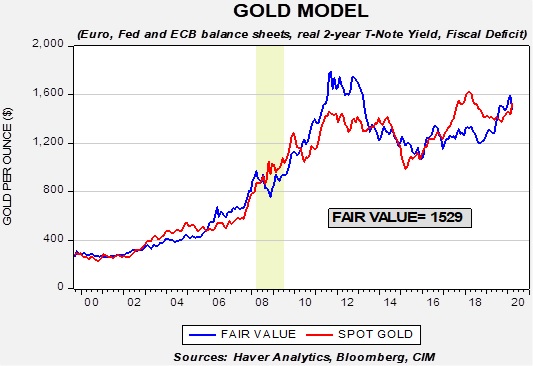
This is a chart of our gold model. Fair value has increased to $1,529 per ounce and prices have dropped below that level. We suspect the recent weakness is related to a rapid tightening of financial conditions.
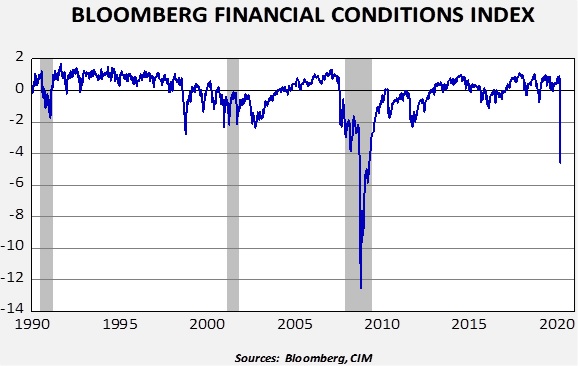
This chart shows the Bloomberg Financial Conditions Index. A negative reading suggests higher levels of financial stress. When financial stress rises to high levels, investors often are scrambling for cash, selling what they can and not necessarily what they should. In other words, the investors may be selling gold to raise funds because it is a liquid asset.
Returning to the gold model chart, we highlighted the area in yellow that represents the 2008 Great Financial Crisis. In the worst of that situation, gold also underperformed fair value. However, once the liquidating stopped, gold began a multi-year bull market. Although we are not necessarily expecting a similar move in prices, we do expect the aggressive expansion of liquidity via fiscal and monetary policy to create favorable conditions for gold in the coming years.