by Bill O’Grady, Thomas Wash, and Patrick Fearon-Hernandez, CFA
[Posted: 9:30 AM EDT]
Good morning! Equities are modestly lower this morning; oil is steady. We update the COVID-19 news. OPEC+ has a deal. Some comments on the Fed. Here are the details:
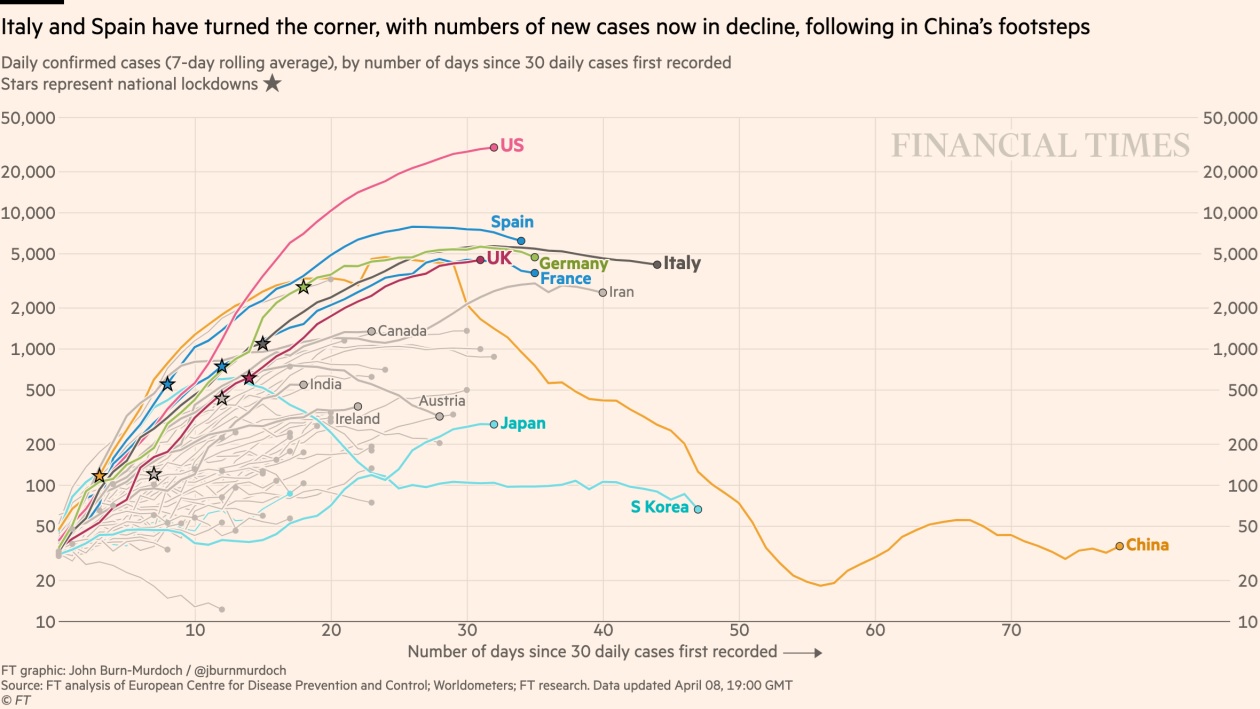
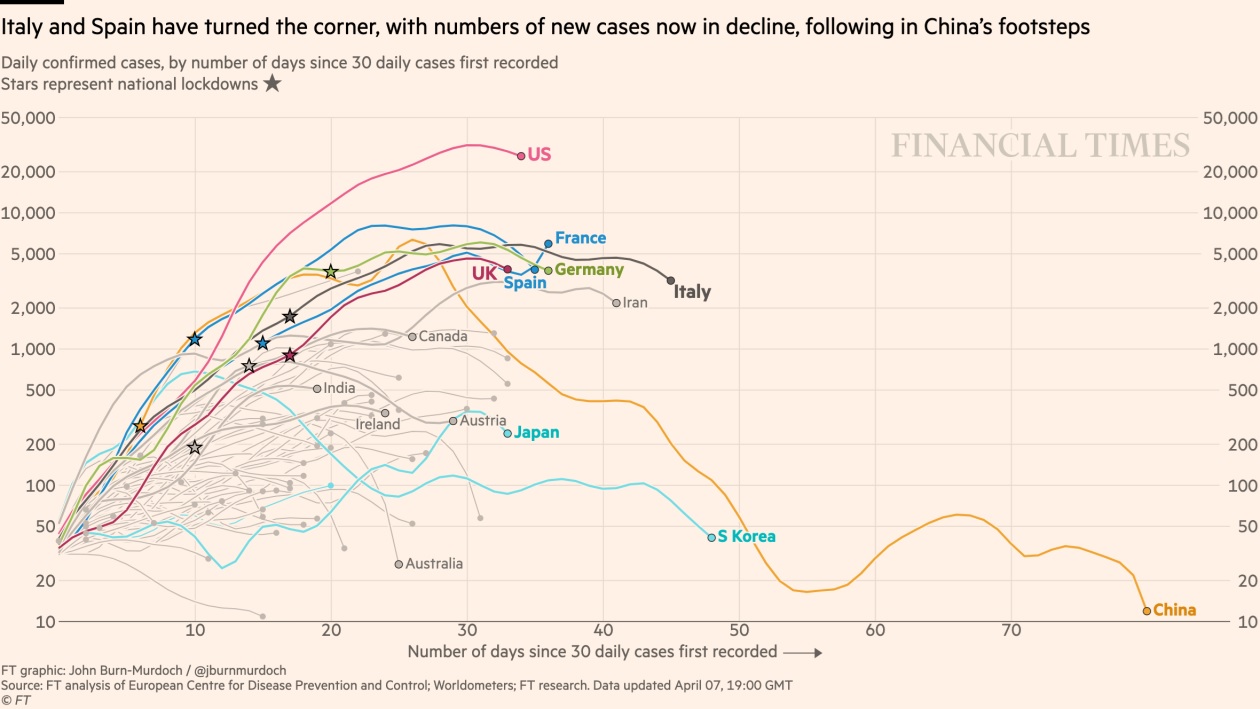
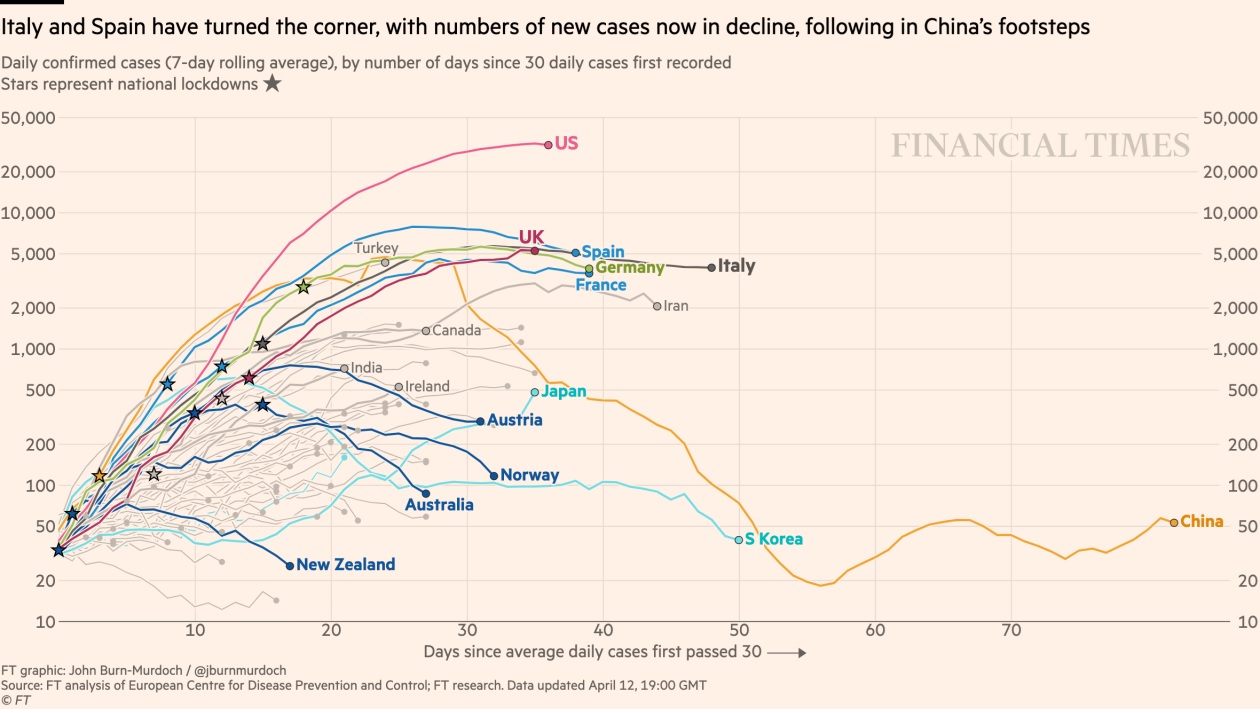
COVID-19: The official number of global cases is 1,860,011 with 114,983 fatalities and 438,516 recoveries. Here is the FT chart:
For those looking for more intensive monitoring, here is the IHME site. You can not only check out the U.S. data but also look at it by state. The good news is that, according to these models, we are at the peak of fatalities now and should see slow improvement. However, a caveat…the confidence bands are extremely wide. The forecasts from these models are important but also carry a remarkable degree of uncertainty.
The virus news:
- PM Johnson has left the hospital. He has not returned to work quite yet.
- The virus has hit the Saudi royal family. The governor of Riyadh is said to be in intensive care and several dozen members have been infected as well.
- Spain is starting to ease restrictions, while India is in the early stages of the pandemic. Nations around the world are in various phases of dealing with the virus.
- Early on, COVID-19 was compared to the seasonal flu; we did that as well. As our experience has developed, important differences have emerged. Those hospitalized with COVID-19 are there much longer and 10x more are hospitalized with it. The fatality rate appears to be much higher. There is also a mystery about why some people are not only asymptomatic but also virus “super-spreaders.”
- New York is struggling with the grim task of burying the indigent dead.
- Morgan Stanley (MS, $41.08) has generated a likely path for the recovery from COVID-19.
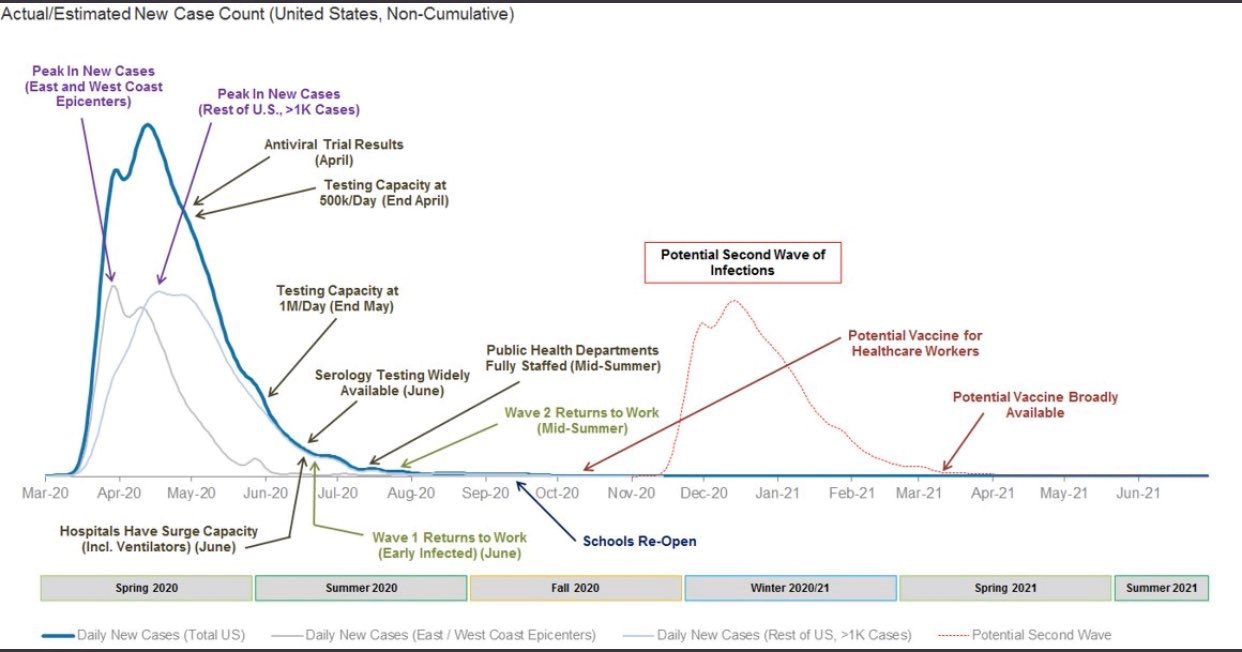
Their analysis, like our work, is an estimate, but it is a reasonable path of the disease. By early summer, they estimate we will be seeing widescale testing, both for the virus and for immunity. Workers will start returning by June with another wave by mid-summer, based on the idea that we will (a) have a much better idea of who has immunity, and (b) testing will allow for rapid isolation of those who catch it later. Schools will reopen in the fall. By Q4, we will be testing a potential vaccine; by late Q1 2021, a vaccine will become broadly available. This schematic suggests that it will take about a year for conditions to return to normal but there will be steady improvement over time. For those with sensitive conditions, returning to work may not occur for a year. But, for those under 50 without complicating conditions, or with immunity, the sheltering-in-place orders will start to ease up.
The policy news:
- The firestorm of Fed programs is making it hard to keep up; Fed independence is clearly at risk. But, one of the nice things about a three-day weekend is that it gives one time to reflect and analyze. The Fed’s decision to expand support for state and local debt is potentially a game changer. One of the key points to Federal debt is that it is issued in a currency that the debt issuer can print. In other words, default can only occur by decision because money can always be provided to service the debt. That doesn’t mean that the Federal government can’t get into trouble by expanding debt, but it isn’t the same trouble that an issuer lacking currency sovereignty can find itself. In other words, inflation is the problem for debt issuers with currency sovereignty; default is the problem for debt issuers that lack currency sovereignty.
- The lack of currency sovereignty is one of the key differences between Federal debt and state and local debt. The latter cannot print the currency in which it issues its debt and thus can default.
- But, the Fed is now backstopping state and local debt which means, in reality, these issuers now have currency sovereignty. Or, put another way, by putting this debt on the Fed’s balance sheet, state and local governments can, in theory, run persistent deficits.
- In the short run, what the Fed is doing is justifiable. One of the problems of the Great Financial Crisis was that state and local governments, facing a collapse in tax revenue, were forced to cut spending. In fact, spending was cut enough to mostly offset what the Federal government was spending.
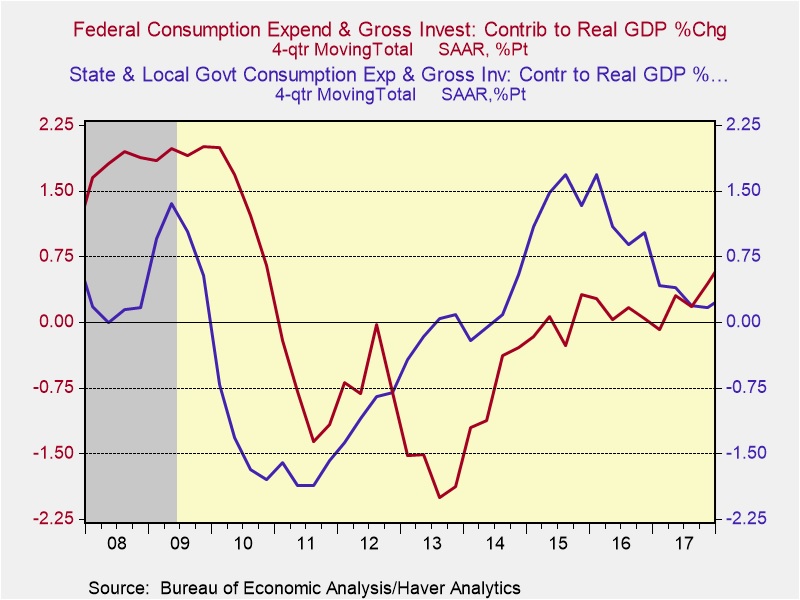
Note that by Q3 2010, the Federal government was adding about 122 bps to GDP; state and local governments were subtracting 168 bps. The government does not want a situation where the stimulus is being offset by falling state and local spending.
-
- The trick is how this program ends. If it continues, state and local governments will have currency sovereignty and deficit spending could explode.
- The airline industry is not happy with the Treasury bailout proposal, objecting to the aid consisting of loans with conditions. Airline unions are warning of bankruptcies.
The economic news:
- The NY Fed has a paper that shows how COVID-19 is affecting the economic data in a pattern similar to a natural disaster, but for most of the nation. In other words, it’s not acting like a cyclical downturn, but a hurricane or earthquake. Thus, our usual models for warning us of a recession didn’t work this time.
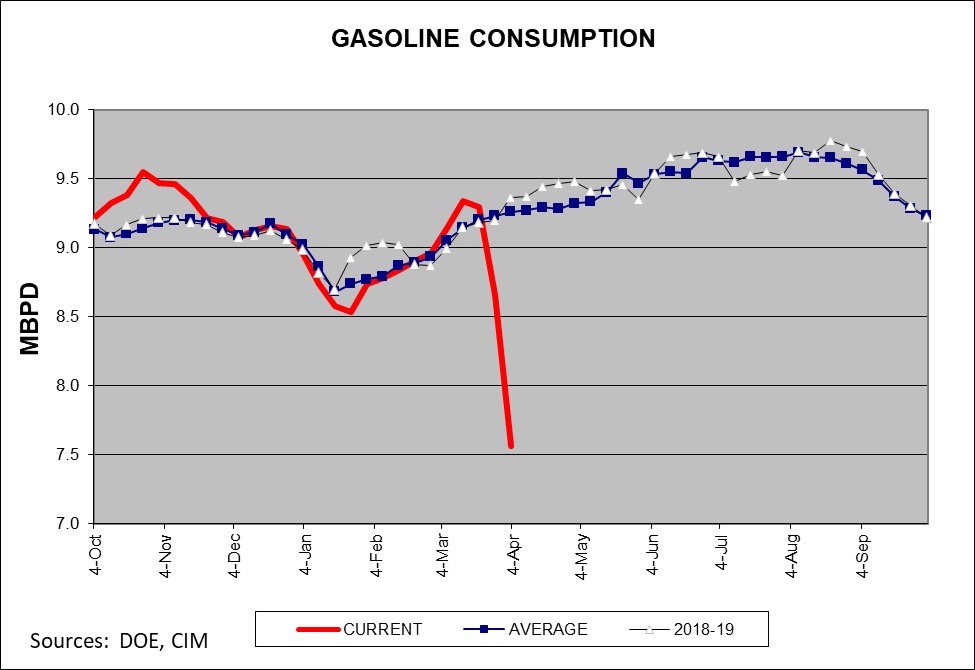
- We are starting to see reports of supply problems caused directly by COVID-19. The pork industry is facing capacity loss due to infections at plants. Grocery workers are contracting the virus and at least 41 have perished. Locally, we are seeing increasing restrictions on in-store shopping. Meanwhile, tariffs are hampering the imports of products used for disinfecting. Food crops are being lost due to the lack of workers for harvest or demand disruptions; even tea has been affected. Other critical industries are struggling to cope with infections. There are increasing concerns that the largest job displacement from COVID-19 will be with low-wage workers.
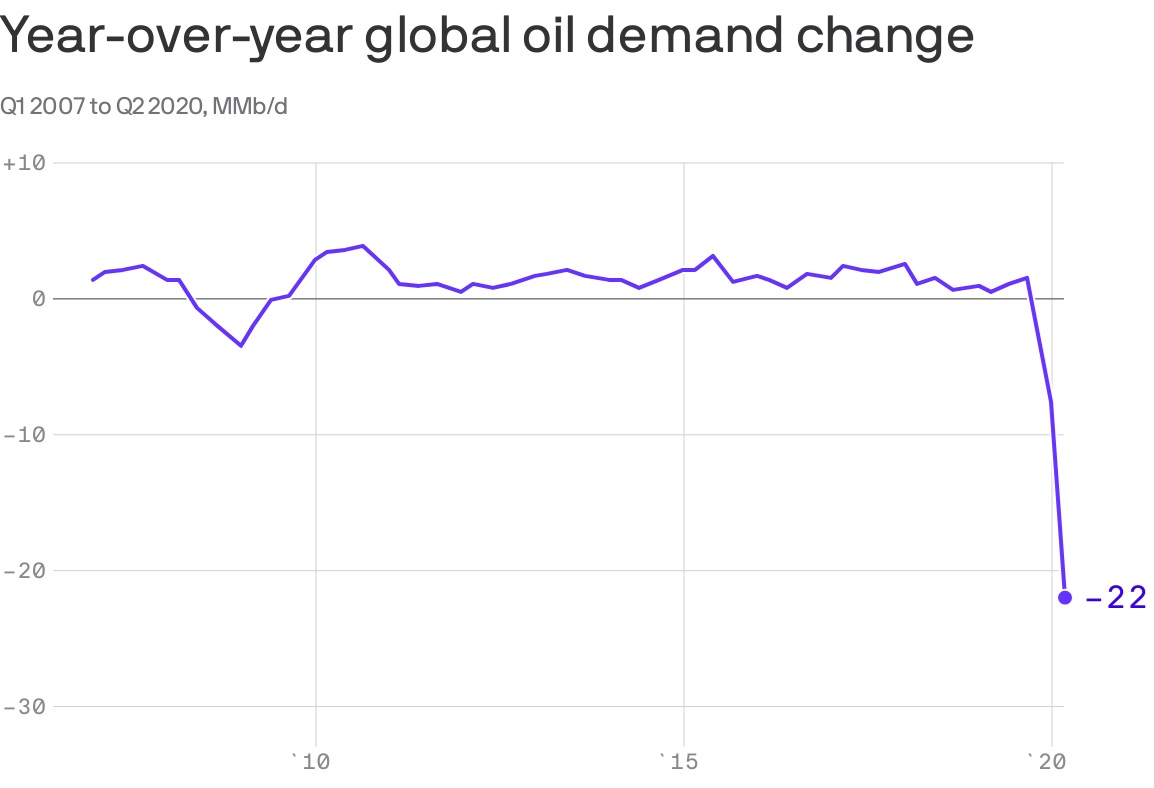
- The world economy is facing historic contraction; nothing in the postwar experience compares.
The market news:
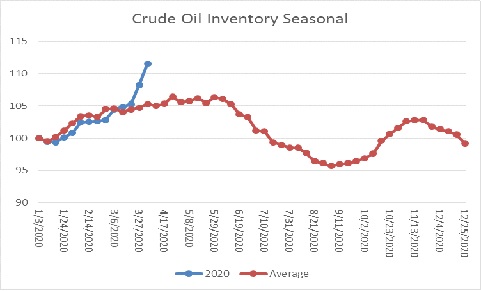
- OPEC+ has a deal, although details are rather scant. Oil prices are mostly steady on the news; given the rally we saw on early reports, an agreement was mostly discounted. The headlines show a nearly 10.0 mbpd reduction agreement. U.S. pressure was instrumental in getting this deal together. Unfortunately, the cut pales in comparison to demand loss.
As we noted last week, history tends to show that the larger the cartel, the harder it is to avoid the free-rider problem. The good news is that the arrangement likely prevents a sudden collapse. However, it doesn’t mean that a bottom is in place either. Meanwhile, we are starting to see well shut-ins; it is highly unlikely that many of these wells will ever restart in the absence of much higher prices. Studies by regional Fed banks, including Dallas and Kansas City, warn of massive bankruptcies if prices remain below $30 per barrel.
- Given the sharp recovery seen in equities, we have been getting questions about whether this pace of improvement will continue. History would suggest it won’t.
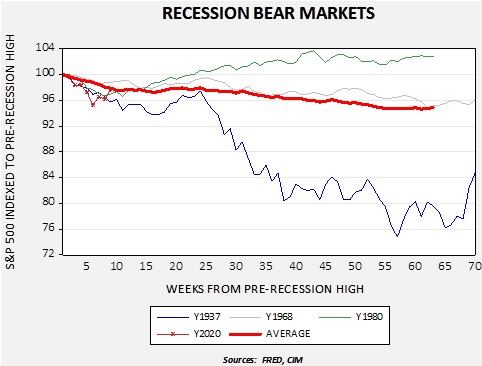
We have weekly data for the S&P 500 Friday closes going back to 1928. We reviewed every recession (except 1945, which had very odd behavior) and indexed each market to the pre-recession high. The red line shows the average of all recessions, along with the three highest correlating periods. We overshot both the average and the other correlating years. We have rallied back to the average, but note that the average and 1968/1980 cycles remained rather flat until after week 15. We are currently on week eight. If history is any guide, we will likely see equities churn for another couple of months, at best. At worst, we will stay sideways for more than a year. Each recession is different and this one we are now experiencing is clearly unusual. However, it would be a bit of a stretch to expect that what we have seen recently will continue.
The foreign policy news:
- Argentina is spiraling to its ninth debt default just as the G-20 is working on a broad set of debt relief measures for poor nations.
- Fires in the forests surrounding the Chernobyl plant are spewing radiation imbedded in the trees; so far, radiation levels have not reached dangerous levels.
- Daniel Ortega, the president of Nicaragua, has been missing for a month. His country has not ordered any sort of social distancing. There is increasing concern that Ortega is (a) incapacitated, perhaps by COVID-19, or (b) is worried about catching it and is engaged in social distancing, while not recommending it for anyone else.