

Weekly Energy Update (April 9, 2020)
by Bill O’Grady, Thomas Wash, and Patrick Fearon-Hernandez, CFA
Crude oil inventories rose 15.2 mb compared to the forecast rise of 9.0 mb.
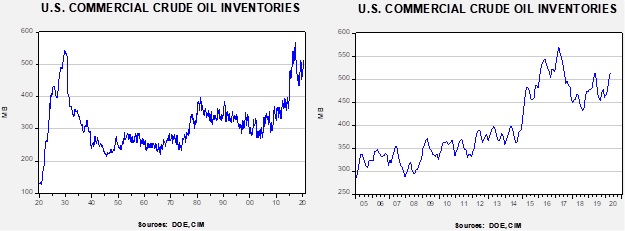
In the details, U.S. crude oil production fell 0.6 mbpd to 12.4 mbpd. Exports fell 0.3 mbpd, while imports declined 0.2 mbpd. Refining activity fell 6.7%, well more than the 1.8% decline forecast. The inventory build was due to a combination of falling exports and a severe decline in refinery operations which offset the decline in production.
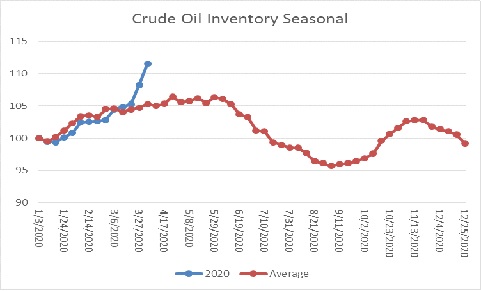
The above chart shows the annual seasonal pattern for crude oil inventories. The last two weeks have pushed stockpiles almost “off the charts.” Although not totally unexpected, this is the first week where the impact of COVID-19 and the oil war has started to affect the weekly data.
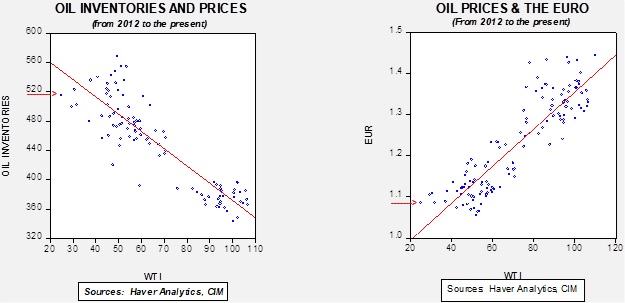
Based on our oil inventory/price model, fair value is $45.11; using the euro/price model, fair value is $44.63. The combined model, a broader analysis of the oil price, generates a fair value of $43.44. Usually, the fair value from the combined model falls within the values generated by the individual models. Recent volatility has led to some model instability, so the combined model is generating the lowest forecast price. As we noted recently, the model output is less relevant unless Russia and the Kingdom of Saudi Arabia (KSA) come to an agreement on supply. At the same time, it does show that prices in the mid-$20s have discounted a good bit of bad news. However, there is a non-linearity tied to the loss of storage capacity that cannot be fully captured with these models. If storage capacity is fully utilized, a catastrophic decline in prices, which we would define as low teens, is possible.
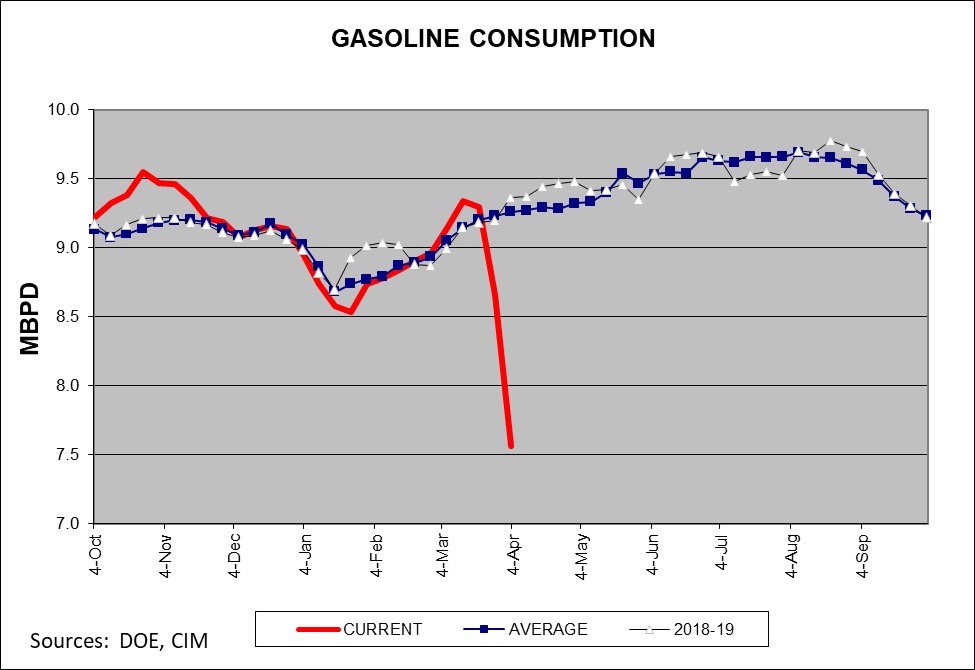
As promised, here are a couple of charts that look at U.S. oil demand. The chart below shows the four-week average of gasoline supplied to the distribution system. As the chart shows, shipments have cratered. Distillate demand is holding up better, reflecting the increases in delivery of goods.
This is a longer-term view of refinery activity.
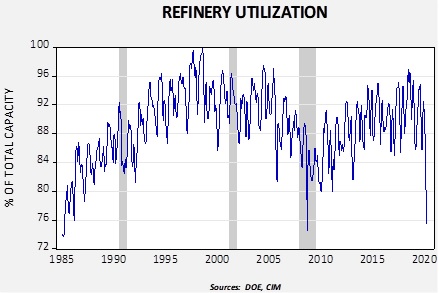
The last time we saw a drop of this magnitude was during the depths of the Great Financial Crisis. Over the past two weeks, refineries have reduced their oil consumption by 2.2 mbpd, far exceeding the drop of 0.4 mbpd in production. The underlying fundamentals for crude oil continue to deteriorate. The DOE reduced its forecast for U.S. production this year to 11.8 mbpd. This means that production can be expected to decline further.
Oil prices have held up rather well because of hope of a broad deal between OPEC+others to reduce production. President Trump is threatening all sorts of actions, including tariffs and anti-dumping legislation. There is a risk to all this—such actions will raise gasoline prices over time. However, that isn’t a problem in the near term. As the above chart shows, people aren’t driving all that much. Still, we think the president doesn’t really want to directly intervene, but merely threaten Russia and the KSA into agreeing to cut output. Russia has reportedly agreed to cut 1.6 mbpd, which is boosting prices this morning.
We remain highly skeptical that a deal can be fashioned among the wide number of participants, but we would be surprised if no deal is announced. But, announcing is one thing, while actually cutting is another matter. Another point to consider—oil futures prices are running well above cash barrels as speculators hoping for a deal are buying in the futures market. At some point, these physical barrel holders are going to rush to sell their actual oil into the futures market to capture the spread. Don’t be surprised to see a “buy rumor, sell fact” trade post-agreement.