Asset Allocation Weekly (May 3, 2019)

by Asset Allocation Committee

Covered interest rate parity is a basic concept that, at its heart, says all interest rates are equal after hedging exchange rate risk.  It is one of the theories in finance that is beyond dispute—it works as long as capital markets are open (free of capital controls) and short-term money markets are liquid.  In general, if foreign interest rates are higher than domestic rates, the forward exchange rate will trade at a premium high enough to absorb the interest rate difference.  Here is a simple example:

In our example, one-year interest rates in the Eurozone are 5.00% compared to U.S. rates at 2.50%.  If the forward rates were equal, a U.S. investor could exchange dollars for euros, invest at the 2.50% spread and hedge the currency risk, earning a risk-free extra 2.50% compared to dollar-based interest rates.  However, in the process of doing so, the forward rate on euros would be bid up to 1.0250, which eliminates any arbitrage opportunities.  A U.S investor should be indifferent to either investing in the U.S. at 2.5% or in the Eurozone at 5%, at 1.025 $/€ one-year forward exchange rate.  In a year, if nothing changes, that euro purchased at 1.025 will be at 1.00, eliminating the entire interest rate spread.

However, this doesn’t necessarily mean that hedging opportunities don’t exist.  An investor could decide to buy into longer duration fixed income abroad and roll the hedge periodically.  Using the above example, an investor could buy a foreign bond and hedge each year, selling the bond if the hedging costs become excessive.

The current spread between U.S. and German 10-year sovereigns clearly favors the U.S.  German yields are around zero and U.S. yields remain significantly higher even though U.S. yields have declined.  Thus, it would seem that German investors would have an incentive to buy longer dated Treasuries.

However, for a German investor to make this investment, he would have to either accept the currency risk or attempt to hedge the risk.  As shown above, the short-term rate spread determines the currency forward discount/premium relationship.

This chart shows the 10-year sovereign spread and the three-month LIBOR spread.  When the bond spread exceeds the LIBOR spread, the bond spread exceeds the cost of hedging.  Even with a very wide sovereign spread, a foreign investor cannot, under current conditions, profitably hedge the currency risk.

This has led foreign bond investors to (a) accept U.S. credit risk by purchasing corporate bonds and hedging the exchange rate risk, or (b) accept the currency risk by leaving the transaction unhedged.  However, that situation is less than ideal and may discourage foreign investors from investing in U.S. fixed income markets.

Although the hedge relationship with regard to the euro isn’t overly strong, there is a modest tendency for the currency to strengthen against the dollar when the hedge spread is negative.  Clearly, there are other factors that affect exchange rates beyond mere interest rate differences.  Although the euro has been weakening recently, it hasn’t declined significantly despite unusually wide sovereign spreads; the likely culprit is the cost of hedging.  If the U.S. yield curve were to steepen, perhaps with policy easing, the window for hedging might reopen and, paradoxically, could lead to a stronger dollar.

View the PDF

Weekly Geopolitical Report – Reflections on Domestic Policy and American Hegemony: Part II (April 29, 2019)

by Bill O’Grady

Two weeks ago, we introduced this report with a review of the basics of the reserve currency and the savings identity.  This week, we will examine two important historical analogs, the Nixon and Reagan administrations.

#1: The Nixon Analog
As President Nixon prepared for the 1972 presidential campaign, he faced a number of serious problems.  First, inflation was increasing.

In 1967, inflation was 2.5%; by mid-1969, it was more than 5.0%.  The Federal Reserve acted to quell inflation by raising the fed funds rate to nearly 9.2% by August 1969.

As the chart below shows, the increase in interest rates led to a recession, ending the long economic expansion that began in March 1961.  The recession, which ran from December 1969 to November 1970, was not an especially harsh one, but Nixon knew that if he didn’t boost the economy in 1971 his reelection chances would be significantly diminished.

View the full report

Asset Allocation Weekly (April 26, 2019)

by Asset Allocation Committee

One of the age-old problems of analysis is the problem of correlation versus causality.  Correlations simply show the degree of relation; the range runs from -1 (perfectly negative) to +1 (perfectly positive).  In any introductory statistics class, the instructor will discuss the difference between relation and causality.  Here is an example:

(Source: http://tylervigen.com/spurious-correlations)

Although it might be possible to concoct a reason why chicken consumption would be related to crude oil imports, in reality, the relationship is spurious.

The advent of cheap computing power has given rise to data mining that allows researchers to scan massive amounts of data and find relations.  In fact, some in the tech industry tend to believe that theory is unnecessary—simply find the relationships and assume they will continue.  However, without theory, if the relationship breaks down then there is no way of knowing why it fell apart.

This chart has started making the rounds in reports:

This chart shows the 10-year Chinese sovereign yield with the yearly change in the S&P 500 and the MSCI World Index.  Casual observation would suggest they are closely related; in fact, the correlation between the Chinese bond yield and the MSCI is 66.7% and 72.1%with the S&P 500.  What’s implied is that developed world stock markets are dependent on Chinese yields.  One would expect Chinese yields to rise with better growth in China, and this would suggest that foreign economies, and thus their markets, depend on Chinese growth.[1]

Perhaps.  But it is also possible that Chinese interest rates are sensitive to world growth; therefore, when the developed world economy does better so does the Chinese economy, and the improvement leads to higher yields in China.  In other words, the direction of causality is difficult to ascertain.

Often, relationships such as this occur because of some other, unnamed variable.  Consequently, in the above case, all three are related to a fourth variable.  Since 2014, for example, Chinese bond yields have been closely correlated to the dollar.

On this chart, the JPM Dollar Index is shown on an inverted scale.  When the dollar strengthens, Chinese yields tend to fall; during periods of dollar weakness, the CNY yields rise.  Since China tends to manage the CNY/USD rate, it’s plausible that when the dollar weakens China enjoys the benefits of that weakness by allowing the CNY to weaken as well.  A weaker currency boosts China’s exports and leads to higher interest rates.  And, a weaker dollar tends to support both the above stock indices.  Therefore, the dollar’s impact probably explains the relationship between Chinese bond yields and developed market equities.

Finally, one last word of caution.  In regression analysis, the dependent variable = intercept + independent variable + error term.  The error term, in theory, contains a myriad of variables that we assume, under the majority of circumstances, balance each other out and thus allow for the model to be stable.  In reality, the variables not specifically delineated in the error term can emerge and affect the dependent variable; sometimes this occurs only for a short time but can make forecasting a challenge.  Given the short history of the above, it is possible that conditions could change and the relationship completely breaks down.  Thus, the moral of the story is that conditions do change and investors need to be cognizant of that fact and try to adjust accordingly.  And, one needs to be careful of seemingly clear charts.

View the PDF


[1] Granger causality testing tends to support the idea that Chinese yields drive equity market performance.  Although statistically sound, Granger causality testing is atheoretical and thus not necessarily causal.

Keller Quarterly (April 2019)

Letter to Investors

The last half-year has demonstrated the day-to-day inscrutability of the financial markets, and with it the impossibility of predicting them. Suppose that last year on September 18 you had the misfortune of bumping your head and, in Rip Van Winkle fashion, fell into an unconscious slumber that lasted exactly seven months. On the day of your injury, the S&P 500 closed at 2904.  On April 18, seven months later, that same broad-based index of U.S. stocks closed at 2905. Upon awakening from that long nap, your portfolio would likely have been the least of your concerns, but after finally getting around to checking your investments you might have exclaimed, “Why, the stock market has been incredibly dull!” Needless to say, you would have been wrong.

The stock market has been anything but dull over the last seven months, even though the net market change was just positive by one point. In between those dates, the S&P 500 fell 19.8% to its low close of 2351 on Christmas Eve, after which it rose 23.6% to its close on April 18 (for a net gain of 0.025%, 1.19% including dividends).

Without perfect clairvoyance, what should an investor have done? Before I answer that question, I can tell you what lots of investors were actually doing, which was selling much more than they were buying during the fourth quarter, reaching a crescendo of panic-selling in the week before Christmas. Why? I was trying to figure that out at the time and, as I indicated in my January letter, many were fearful of a return to the recession and bear market of 2008. As I noted then, a recession not only didn’t seem likely to us anytime soon, but even if one were to appear, it would most likely be much milder than the 2008 version.

Back to late December: after the sellers had exhausted themselves and with prices marked down about 20% (who doesn’t love a sale?), buyers came in and scooped up the bargains. In fact, with ample evidence that no recession was likely in the near term, buyers bid prices back up to where they were just a few months earlier. I should point out that no investor knows what tomorrow will bring. We have lots of knowledge, just nothing about the future. But we do know a lot about the past, and history tells us that sometimes a little bit of negative news can create a great big selling panic, which is what we saw in late 2018.

So, I will ask again, what should an investor have done? A very good answer is nothing at all. A correctly positioned portfolio made up of stakes in outstanding businesses doesn’t need to be disturbed because other people are panicking. If their good management is intact, sound balance sheets are maintained, earnings and cash flows are solid, and dividends are paid on time, then there is no need to do anything.

Another good answer: take advantage of panics by acquiring shares of great companies that others are eager to unload. This is something that we love to do but is hard for most investors because a selling panic spurs its own “herd mentality” that causes people to sell simply because they are afraid of what they don’t know. That’s a bad reason to sell, just like it’s a bad reason to buy because others are doing so. You don’t need to know the future, but you do need to know what you own (or what you want to own), whether it’s a stock, a bond, or a fund.

We don’t know what tomorrow holds, but we plan to bring our knowledge of the past, of human nature, and of the investments we own.

We appreciate your confidence in us.


Gratefully,

Mark A. Keller, CFA
CEO and Chief Investment Officer

View the PDF

Asset Allocation Weekly (April 18, 2019)

by Asset Allocation Committee

Why is inflation so low?  The persistence of low inflation, despite the long expansion and the decline in unemployment, continues to befuddle policymakers.  Standard economic theory suggests there is an inverse relationship between inflation and unemployment.  When the unemployment rate is low, firms should be experiencing reduced excess capacity.  As capacity is constrained, supply bottlenecks would be expected to develop which would eventually result in inflation.

Although the unemployment/inflation theory makes sense, it doesn’t work all that well in real life.

This chart shows the level of unemployment, with an 18-month lag, compared to the yearly change in CPI.  In the 1960s, it did appear there was a tradeoff; when unemployment fell, inflation rose 18 months later.  However, even during this period, the data relationship was merely directional as sub-4% unemployment led to 6% CPI.  In the mid-1970s, 4.5% unemployment led to CPI in excess of 12%.  Since the early 1980s, CPI has rarely moved above 4%, and in the current environment sub-4% unemployment has not yet triggered a notable inflation problem.

It turns out inflation is rather complicated.  Expectations play a major role; if households and businesses expect rising inflation, they take steps to protect themselves that exacerbate the inflation impulse.  Both sectors will build inventory levels, effectively changing their balance sheet allocation from financial instruments to real goods.  This action can lift the demand for goods and can trigger inflation.

There also appears to be at least two long-term factors that affect inflation.  Inequality seems to have an impact.

History shows that lower degrees of inequality are correlated with higher levels of inflation.  We think there are two factors that cause this outcome.  First, policies designed to expand supply, deregulation and globalization, tend to improve the efficiency of the economy at the expense of higher inequality.  Outsourcing and automation make production more efficient but also reduce the demand for domestic labor.  Simply put, one person’s efficiency is another person’s pink slip.  Second, CPI is designed to measure prices based on an average household’s consumption patterns.  With rising inequality, lower decile households may have less income to spend on basic items, making it difficult for firms to pass along price increases on such goods.  On the other hand, under conditions of inequality, prices on luxury items are likely to be priced higher simply because there is more spending power available.[1]

However, it is likely that the most potent reason inflation has stayed low is because of excess capacity in the economy.  Measuring excess capacity is profoundly difficult because it is something of a moving target.  A simple way is to regress long-term GDP against trend; the assumption is that the trend is a reasonable proxy for capacity.

The chart on the left is real GDP, log-transformed with a time trend regressed through it.  The lower line is the deviation from trend.  We are currently in a period where GDP is well below trend.  The only other period that exhibited such a negative deviation from trend was the Great Depression.  The chart on the right shows the GDP deviation line compared to CPI.  Note that inflation tends to be low during periods of below-trend GDP.  For the overall time frame (1921-2018), CPI averages 2.8%.  When GDP is above trend, inflation averages 3.8%; when GDP is below trend, CPI averages 0.4%.

This trend analysis could mean that it may take several years before inflation pressures become notable if policymakers become aggressive with stimulation (i.e., keeping monetary policy accommodative while lifting fiscal policy).  It also means the Federal Reserve can probably avoid raising rates for a considerable period.

View the PDF


[1] https://www.pewtrusts.org/en/research-and-analysis/issue-briefs/2016/03/household-expenditures-and-income

Asset Allocation Quarterly (Second Quarter 2019)

  • The Federal Reserve shifted fully from its hawkish stance at the beginning of the year. We anticipate that the committee will maintain its newly dovish stance with the potential for further monetary accommodation.
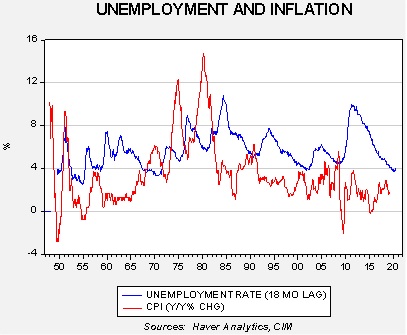
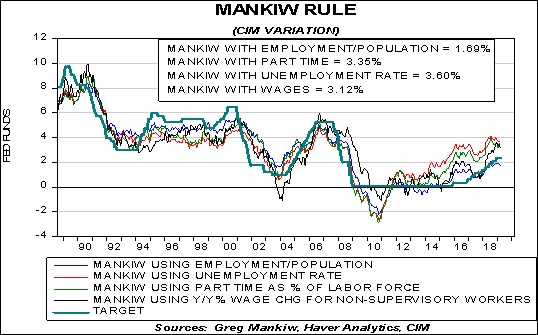
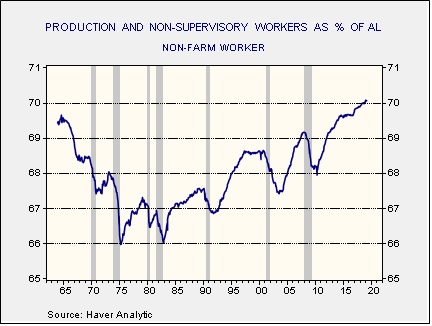
  • Though the employment/population ratio has improved, we find it still indicates slack in the labor force, blunting the full impact of wage growth on inflation.
  • Should trade agreements be reached with China and the European Union, and Congress approves the replacement for NAFTA, U.S. equity markets will respond positively.
  • Despite weakness abroad, we expect the U.S. economy to continue to grow through the balance of this year and into next.
  • The Fed’s accommodation and our expectations for continued U.S. growth over the next two years encourages our continued historically high weighting to U.S. equities in the strategies.

View the complete PDF

ECONOMIC VIEWPOINTS

The Federal Reserve’s pivot at the beginning of the year from a hawkish tone to a dovish posture has greatly influenced sentiment and markets. Though we foresee slowing economic growth over our three-year forecast period, we believe that the Fed’s accommodation will continue to propel the economy and risk-based assets through the end of this year and into next year’s election cycle. We maintain our expectation of 2.7% GDP growth for 2019.

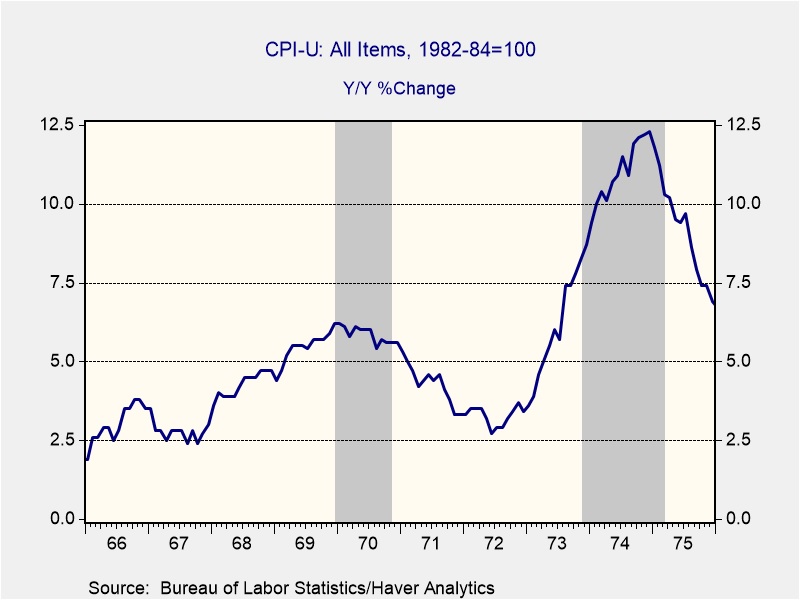
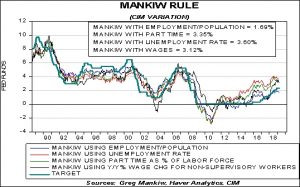
The litmus test for our forecast will be the Fed’s upcoming meeting in Chicago on June 4-5, where the committee will be examining and evaluating its strategies, tools and communications surrounding its formulation of monetary policy. They have been on record regarding their views that labor market conditions are close to maximum employment, yet several members have mentioned the amount of slack that exists in the economy as measured by the employment/population ratio.

We expect the Fed will take a more nuanced approach to inflation targeting, allowing CPI-U to advance above its 2% hurdle until the shortfalls recorded over the past decade are back-filled. If our thesis is confirmed, the potential for a decrease in the fed funds rate later this year becomes a likelihood as indicated by the line on the chart showing the Mankiw Rule model using the employment/population ratio. This will hold short-term advantages for the economy and risk assets, but with long-term ramifications for inflation and, thereby, future bond and stock prices.

The current administration continues to engage in trade negotiations with China and the European Union (EU), and the new NAFTA, now USMCA, is under consideration by Congress. A favorable resolution of any or all of these would be positive for U.S. equities, where the market is still discounting long-term effects of trade barriers. Note that our expectations are not for a return to globalization. Rather, we fully anticipate general de-globalization efforts by the current administration as it seeks bilateral trade agreements favorable to the U.S. in contrast to the multilateral trade deals that were the basis of the globalization trend since the 1980s.

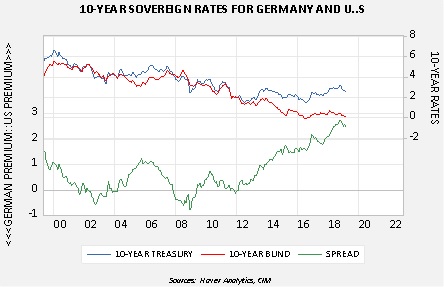
Beyond the U.S., our expectations are for continued softness in global growth and the potential for recession in several jurisdictions, the most notable being Italy and potentially Germany. The European Central Bank (ECB) has indicated that any tightening moves it harbored for this year have been pushed back until next year, at the earliest. Germany will be electing a new chancellor this fall and the ECB will have a new president on November 1, both of whom will exert influence on fiscal and monetary policies. Further influences emanate from China, with its economic stimulus measures and its stated willingness to accept trade measures from the EU. Although our thesis calls for a weakening U.S. dollar over our three-year forecast period, and we can envision an environment where European markets become attractive, there are too many near-term unknowns in Europe that encourage our posture of keeping risk assets in the U.S. for the foreseeable future.

STOCK MARKET OUTLOOK

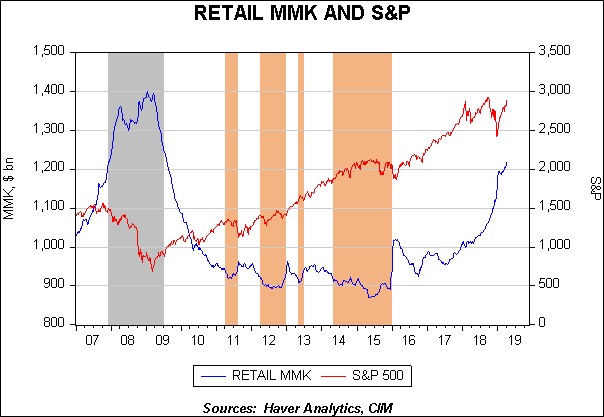
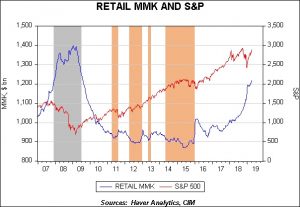
Despite U.S. corporate profitability growth having slowed from last year’s torrid pace, it has been growth nonetheless. Margins remain high and, in an era of continued deregulation, have the potential to expand further. The decrease in earnings estimates for the first and second quarters have created the possibility for positive earnings surprises. Moreover, our expectations that the Fed will become even more dovish, and potentially politicized in advance of next year’s election season, adds more conviction for our historically high U.S. equity allocations in the strategies. A further element that would stoke the equity furnace is the fear of missing out by retail investors.

According to Morningstar, over the last twelve months investors have pulled nearly $425 billion out of U.S. equity separate accounts and mutual funds. Should retail investors replace their fear of the market with the fear of missing out, the U.S. equity market would become turbocharged. Although our consensus over our full three-year forecast period is certainly less rosy, we are encouraged to retain our historically high weighting to equities in the strategies for the time being.

Within investing styles, we maintain our neutral posture between value and growth. Among sectors, Materials continue to be overweight. We removed the overweight to the Energy and Health Care sectors in favor of overweights to Industrials, where earnings and growth metrics are attractive, and Technology, which was reconfigured late last year as part of the Communication Services realignment and offers a favorable position for the latter stages of an economic cycle.

The latter stages of an economic cycle are typically favorable for mid-cap stocks, which are decidedly overweight in each of the strategies. Attractive valuations using traditional measures of P/E and P/B for the S&P 400 Mid-Cap Index relative to the S&P 500 further our decision to overweight this sub-asset class. The Growth and Aggressive Growth strategies are both overweight to small cap stocks owing to the likelihood of continued elevated M&A activity over the course of the year.

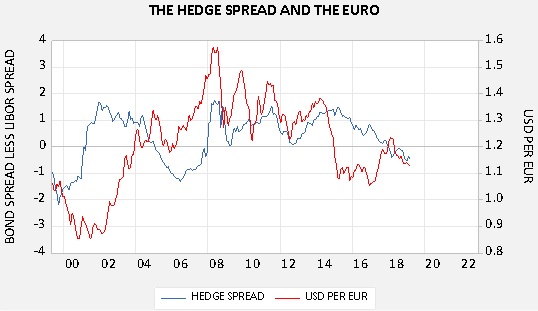
Outside the U.S., we are cautious over the near term. Relative valuations are attractive overseas and our view is for a decline in the value of the U.S. dollar versus major currencies, which would provide a tailwind for returns. However, the cauldron of factors influencing Europe over the course of this year encourages us to remain on the sidelines in the near term. Therefore, we hold all risk assets in the U.S. with no allocation to foreign equities in any of the strategies.

BOND MARKET OUTLOOK

The dovish and potentially politicized Fed going into the election season guides our view that the yield curve will return to its traditional slope over the course of the year, principally through a reduction in short-term rates. Through our full three-year forecast period, we are positive on longer term rates as long Treasuries have significantly attractive yields relative to those from other developed countries. While we harbor concerns regarding the nearly $5 trillion in corporate debt maturing between 2019 and 2023, compounded by the change in interest expense deductibility in 2022 from 30% of EBITDA to 30% EBIT, these concerns are offset by overall corporate health and the recognition that bonds can be refinanced at a competitive price. We extend the duration of bond holdings in the strategies with income objectives, and retain the laddered structure as a nucleus beyond the short-term segment. We eliminated our former position in speculative grade bonds due to concerns about embedded risks in certain sectors as well as our expectations for spread widening over the full forecast period from their current low levels.

OTHER MARKETS

While REITs experienced tremendous total returns in the first quarter, our consensus forecast is for them to only deliver returns commensurate with dividends over the next three years. Accordingly, we reduced the allocation by half in the only strategy where REITs are deployed. We retain the remaining small allocation for the diversified income stream they provide.

We maintain a modest allocation in gold given its ability to offer a hedge against geopolitical risk and the safe haven it can afford during an uncertain climate for the U.S. dollar.

View the complete PDF

Weekly Geopolitical Report – Reflections on Domestic Policy and American Hegemony: Part I (April 15, 2019)

by Bill O’Grady

(Due to the Easter holiday, our next report will be published April 29.)

The dollar is the world’s reserve currency.  As such, there is a constant demand for dollars from foreign countries to provide liquidity for global transactions.  Because of the reserve currency status, U.S. monetary and fiscal policy affects the world economy in ways that other nations’ policies do not.  The Federal Reserve is the U.S. central bank; in its mandate, it only concerns itself with the U.S. economy unless overseas events directly affect America.  In general, the Federal Reserve would not be allowed to cut U.S. interest rates to boost the Canadian economy.  Fiscal policymakers almost never worry about the impact of spending or taxes on foreign economies.  However, U.S. monetary and fiscal policy can affect foreign economies through access to the reserve currency and trade.

Previous reports have discussed the reserve currency role.  Recent policy decisions and potential Federal Reserve governor appointments could have a dramatic impact on monetary and fiscal policy.  At the same time, because of America’s superpower status and its role in providing the reserve currency, these policy actions will also impact foreign economies.  The key issue is the degree to which the U.S. can use hegemony to force domestic economic adjustments on foreigners.

In Part I of this report we will review the basis of the reserve currency role and the impact of the savings identity.  In Part II, we will examine the power of hegemony by historical comparison, using the Nixon and Reagan administrations as analogs.  In Part III, we will examine how the Trump administration is using American power to force foreign economies to absorb at least part of the economic adjustment.  Our normal analysis of potential market ramifications will conclude the third installment.

View the full report

Asset Allocation Weekly (April 12, 2019)

by Asset Allocation Committee

The employment data is closely watched by financial markets; although the data isn’t necessarily a leading indicator for the economy, it is probably the most important from a political and social perspective.  Weak employment data is a worry for political incumbents and concerning to policymakers.  However, beyond the headline data, there are usually interesting trends worth noting.  In this week’s report, we will examine two trends that have longer term implications.

Career paths were part of corporate culture three decades ago.  Large companies often had junior executive programs, where promising young talent was brought to the firm and would follow a rotation of positions in numerous departments before finding a permanent home.  In other situations, college graduates would join a company and follow a path of positions of increasing responsibility.  However, over the years, outsourcing jobs overseas and increasing industry concentration[1] have probably reduced the number of entry level professional positions in the U.S.  This chart shows the percentage of production and non-supervisory workers compared to total non-farm employment.

In the 1970s, this percentage declined to a low of 66%.  However, since the early 1980s, the percentage has steadily increased in each business cycle.  This data suggests that an increasing number of jobs are non-management positions.  We suspect that college graduates are being forced to accept non-management positions as fewer of them are available for an increasing number of graduates.  Such disappointment has the potential to cause social unrest.  At the same time, reversing industry concentration would tend to boost the number of management jobs in the economy (every firm needs HR, finance, etc.).  Thus, support for anti-trust actions could become more popular.

Second, initial claims, on a weekly basis, fell to 40-year lows recently.  However, the weekly data is “noisy” and can be affected by floating holidays and weather.  Another way of looking at claims is to scale to the civilian non-institutional population.  This data is at historic lows.

This low level of claims is likely due, in part, to firms holding on to workers because of tight labor conditions.  A rising number of retirees will lift the non-working civilian non-institutional population but fewer workers will tend to depress claims.  In any case, this level of claims compared to the population is remarkably low and would argue that wages should rise.

Overall, these two charts offer insights into longer term issues in the labor market.  They won’t have an immediate effect on financial markets, but both signal potential for further disruption.

View the PDF


[1] https://finance.eller.arizona.edu/sites/finance/files/grullon_11.4.16.pdf

Weekly Geopolitical Report – When Hegemons Fade (April 8, 2019)

by Bill O’Grady

In our Daily Comment report, a section on Brexit has become something of a regular feature.  As part of keeping up with developments, we have commented on nearly every twist and turn (or lack thereof) in the Brexit process.  In a recent WGR series, we discussed the Irish problem[1] and how it relates to Brexit.

As we watch Brexit unfold, one persistent theme has emerged—much of Brexit is about unresolved issues surrounding the end of the British Empire.  Britain was the global hegemon from 1815 to around 1920 (although the nation still thought it was in charge until the end of WWII).  Historians tend to view the shift from one hegemon to another as a clear, abrupt break.  But, in reality, faded hegemons tend to cling to elements of former glory.  Although global influence may have waned, the vestiges of power still affect policy and national self-image.  For example, Spain’s era as global hegemon ended around 1640 after wars with the Dutch exhausted Spain’s power.  Still, Spain held possessions in the Western Hemisphere until the Spanish-American War in 1896-98.  That war finally ended the Spanish Empire.

There is an element of Brexit that is trying to recapture former glory.  Sadly, Brexit may make it clear that Britain is no longer a major global power.

In this report, we will discuss the geopolitics of Europe and Britain.  Using this geopolitical analysis, we will examine the British Empire and how it devolved.  These two analyses will be used to examine the path of Brexit.  As always, we will conclude with market ramifications.

View the full report


[1] See WGRs, The Irish Question: Part I (2/25/2019) and Part II (3/4/2019).