

Asset Allocation Weekly (April 17, 2020)
by Asset Allocation Committee
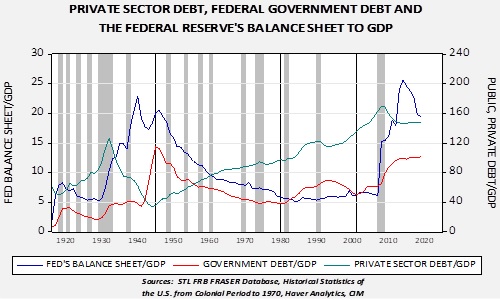
The Federal Reserve’s aggressive expansion of its balance sheet has been in response to fears of systemic risk. The experience of the 2008 Great Financial Crisis has made it clear that systemic risk can occur from a myriad of different parts of the financial system, so the Fed has broadened its support to include a significant expansion of credit risk, including corporate credit, both investment-grade and below-investment-grade, municipal debt, commercial paper along with mortgage and Treasuries. Although the Fed did similar actions in the depths of the 2008 Great Financial Crisis, the current policy actions are far more aggressive than what was seen in the last decade, both in the level of the balance sheet expansion and the breadth of assets being purchased. The Fed’s balance sheet is currently $6.083 trillion, a new record high.
Although the FOMC’s actions have been in response to concerns over systemic risk, there is a structural backdrop as well. Private sector debt in the U.S. is elevated and is probably unsustainable at current levels. The sustainability of debt levels is more art than science. Although there are obvious ways to measure debt service costs and one can compare historical levels, there is a psychological element to the lending and borrowing process. If confidence is high, lenders are anxious to “put money to work” and borrowers have high hopes that their borrowing will be beneficial. For example, Americans believed that home prices would continue to rise from 1995 to 2005 and lending that now looks reckless seemed reasonable at the time. But, once confidence in home prices waned, there was a scramble to reduce exposure to the sector that culminated in the 2008 Great Financial Crisis.
We have seen a decline in private sector debt[1] since 2007; however, the slow growth seen during this expansion likely reflects the fact that we haven’t seen enough debt liquidation. We saw a similar situation in the 1930s.
When private sector debt becomes excessive, there are two paths of resolution. The first is to allow the debt to be liquidated through bankruptcy. At a microlevel, this path is perfectly reasonable. After all, if a borrower and a lender took risks, they should bear the burden of their mistakes. However, at a macrolevel, this path of resolution tends to create systemic risk.[2] One party’s debt is another party’s asset. If the debt is resolved at a loss, the asset falls in value too. The process can lead to deep and widespread collateral damage. For example, in 1928 there were 26,401 commercial banks in the U.S.; by 1934, this number had declined to 15,913. The decline in asset values and the loss of bank deposits tend to lead to bank failures and the hoarding of cash that can cause a deflationary spiral. Politically, allowing a debt restructuring to occur “naturally” has become a non-starter.
Therefore, if the private sector debt overhang isn’t resolved by liquidation and asset price declines, the other option is to socialize the debt. The debt is shifted to the public sector balance sheet and resolved over time. Referring to the above chart, the Fed’s balance sheet began to rise aggressively after 1932, with only a modest increase in the government’s debt. Although the expansion of the Fed’s balance sheet helped end the initial phase of the Great Depression, private sector debt continued to decline, which we would argue shows a continued lack of confidence by borrowers and lenders.
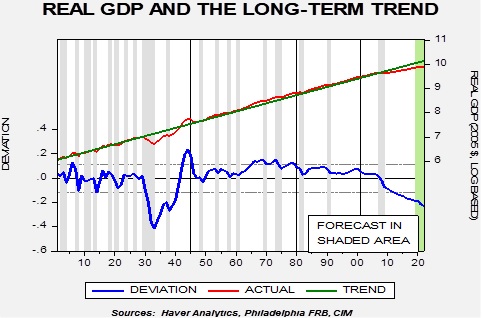
This chart shows real annual log-transformed GDP starting in 1901. We regress a time trend through the data. Despite the Fed’s efforts, GDP remained below trend, suggesting the full impact of the debt liquidation tied to the Great Depression had not been resolved. The full resolution wasn’t accomplished until the rise of government spending for WWII, along with the further expansion of the Fed’s balance sheet. The combination led to a decline in private sector debt to below 40% of GDP. The decline in private sector debt laid the groundwork for the postwar recovery. It took nearly 15 years, a massive expansion of the Fed’s balance sheet and WWII spending to fully resolve the private sector debt overhang that developed prior to the 1930s.
However, the private sector debt didn’t disappear—it was transformed into public sector debt and that debt overhang needed to be resolved. That resolution was executed by financial repression and regulation. It is important to note that government debt issued in the currency that government controls is different that private sector debt. The former doesn’t actually need to be paid off; it merely needs to be serviced. Servicing government debt is a function of the relative size of that debt to the economy. The formal process is called the Net Fiscal Effect. This process is a formula:
Net Fiscal Effect = (y/y% nominal GDP – government interest rate) + primary balance as % of GDP
If nominal GDP rises faster than the rate of interest the government pays on the debt plus primary balance,[3] then the overall government debt/GDP ratio will fall. Here is a chart:
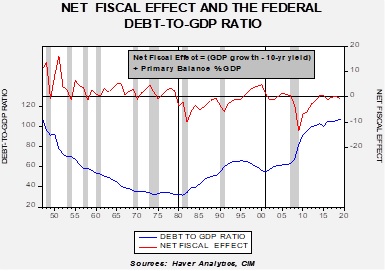
This chart shows the net fiscal effect on the upper line (we use the 10-year T-note yield as a proxy for borrowing costs). From the end of WWII into the early 1980s, the net fiscal effect was positive, and the government debt/GDP ratio steadily declined.
If policymakers follow the Great Depression/WWII path, we would expect a gradual rise in long-term interest rates.
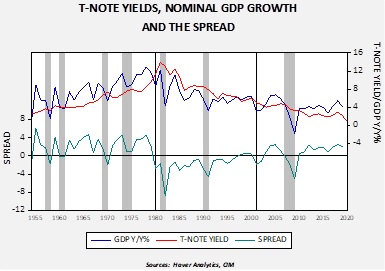
This chart shows the 10-year T-note yield, the yearly change in nominal GDP and the difference between the two series. The postwar period to the early 1980s was a secular bear market for bonds. That may not happen this time around, or it may be slower to evolve. The Fed may engage in yield curve control, preventing Treasury rates from rising. The aging population could reduce inflation fears; it is important to note that the Millennial generation may be scarred by the last two decades and may behave like the Depression/War generation. That would mean less spending and risk taking. But it would be reasonable to expect that a gradual reflation is likely; after all, it supports the net fiscal effect.
What should investors do in this environment? We will discuss this issue at much greater length in an upcoming WGR series but here is how we are dealing with this development in our Asset Allocation strategies:
- We have deployed bond ladders using ETFs. Bond laddering is an effective way to deal with gradually rising interest rates. We use a mix of corporate and Treasuries in the ladders.
- We have added allocations to precious metals across all portfolios.
- Historically, equities have been a good inflation hedge; however, we may see a period of adjustment in the next decade as investors deal with rising inflation. This may entail multiple contraction. Although it is too early to reduce equity exposure for this event, we are cognizant of future development.
Addressing the private sector debt overhang through socializing it to the public balance sheet is a rare event. This one will be a challenge for investors, but it can be managed. However, what has worked for the past 40 years (equity investing via blind indexing, holding long duration bonds, etc.) probably won’t work for the next four decades.
[1] We define private sector debt as household debt plus non-financial corporate debt; the financial system debt is excluded because much of that debt is to the non-financial components and thus including it would be double counting.
[2] This process was described by Irving Fisher in 1933.
[3] The primary balance = government revenue/GDP – (government spending – interest paid)/GDP. In other words, it’s net government spending less interest payments.