

Author: Rebekah Stovall
Asset Allocation Weekly (July 24, 2020)
by Asset Allocation Committee | PDF
In the Federal Reserve’s 107-year history, it has used a number of different methods to manage monetary policy. In its early years, it relied on the discount rate and reserve requirement adjustments as policy tools. During WWII, it managed the yield curve to a specific interest rate to support Treasury borrowing to fund the war effort. In the early 1950s, monetary policy became independent of government borrowing. From this period into the late 1970s, the Fed managed monetary policy by setting a target rate for fed funds. Chair Volcker moved to target the money supply in a bid to bring down inflation; monetary targeting ended by 1987. From 1987 until 2008, the primary tool of monetary policy was the fed funds policy rate. If the banking system was oversupplied with reserves, the fed funds rate would decline below target. The Fed would engage in open market operations to reduce the level of reserves to lift the effective fed funds rate. Under conditions of an undersupplied market, banks would be bidding up rates to acquire reserves; the Fed would inject money into the banking system to prevent the effective fed funds rate from overshooting the target rate. During the Great Financial Crisis, the U.S. central bank flooded the banking system with reserves to ensure ample liquidity; this action led to a massive level of bank reserves rendering the traditional fed funds rate management impossible. The level of reserves would have anchored the fed funds rate at zero. To allow for rate flexibility, the Fed began paying interest on reserves.
In March, when the pandemic triggered financial stress, the FOMC responded quickly. Not only were rates cut but the Fed announced a series of actions designed to provide liquidity to various parts of the financial system. In an unprecedented step, the central bank bought corporate bonds, including some that were below investment grade. It purchased municipal bonds. It also offered broad support for money markets and commercial paper. And, it increased and broadened swap lines with foreign central banks to provide global dollar liquidity. All these actions led to a massive rise in the Fed’s balance sheet.
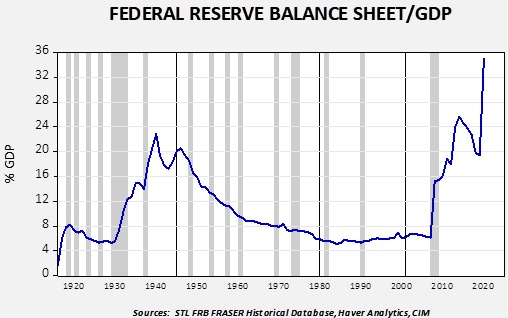
This chart shows the Federal Reserve’s balance sheet relative to nominal GDP. Note that the current level of the balance sheet is at all-time highs.
Recently, the Fed’s balance sheet has contracted; this change has raised concerns that the central bank may be withdrawing stimulus which would be bearish for the economy and financial markets.
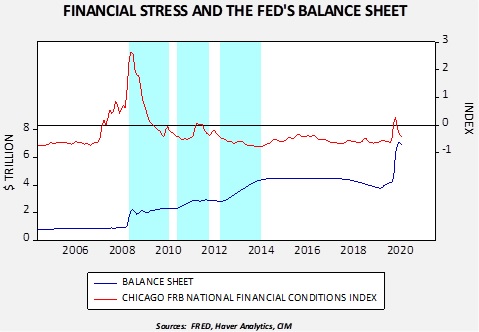
This fear is misplaced, but understandable. This chart shows the balance sheet along with the Chicago FRB’s National Financial Conditions Index. A rising index number indicates increasing financial system stress. We have shaded three periods of quantitative easing. It is notable that the first two cycles had specific levels of asset purchases. In other words, a given level of buying and a definitive end date was established. The third cycle was more open ended in time but initially fixed in terms of purchases.
The recent rise in the balance sheet is less about supporting the economy and more about suppressing financial stress. And so, as the level of stress has declined, the demand for Fed support has as well, leading to a decline in the balance sheet. This isn’t due to the Fed withdrawing support; it is, in fact, evidence of the Fed’s success. It should be noted, however, that the facilities remain in place. If stress rises, the Fed has policies in place to suppress it.
The central bank’s next step will likely be to add accommodation. In other words, additional actions will likely be necessary to encourage economic recovery. Potential policies might entail yield curve control, “QE for people,” or direct payment from the Fed to households. The important point is that one should not mistake the recent decline in the balance sheet as a sign of tightening.
Business Cycle Report (July 23, 2020)
by Thomas Wash | PDF
The business cycle has a major impact on financial markets; recessions usually accompany bear markets in equities. The intention of this report is to keep our readers apprised of the potential for recession, updated on a monthly basis. Although it isn’t the final word on our views about recession, it is part of our process in signaling the potential for a downturn.
In June, the diffusion index stayed in recession territory as improvements in several indicators could not outweigh the negative impact of the previous three months. That being said, it does appear that the worst is now behind us. Financial markets continued to show signs of improvement as Fed Chair Jerome Powell testified before Congress that the Fed will not remove stimulus prematurely. Additionally, fiscal stimulus and monetary easing led to a sharp rise in equities. Meanwhile, the labor market showed signs of improvement as an increase in consumption, following the reduction in lockdown restrictions, allowed firms to hire workers in record numbers. However, economic uncertainty has weighed on consumer and investor confidence as a rise in virus cases toward the end of the month has hindered efforts to further ease restrictions. As a result, six out of the 11 indicators are in contraction territory. The reading for June remains unchanged from the previous month, at -0.1515, well below the recession signal of +0.250.
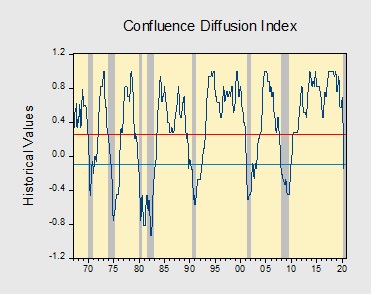
The chart above shows the Confluence Diffusion Index. It uses a three-month moving average of 11 leading indicators to track the state of the business cycle. The red line signals when the business cycle is headed toward a contraction, while the blue line signals when the business cycle is headed toward a recovery. On average, the diffusion index is currently providing about six months of lead time for a contraction and five months of lead time for a recovery. Continue reading for a more in-depth understanding of how the indicators are performing and refer to our Glossary of Charts at the back of this report for a description of each chart and what it measures. A chart title listed in red indicates that indicator is signaling recession.
Keller Quarterly (July 2020)
Letter to Investors | PDF
Thus far, the year 2020 has not been one most of us would like to repeat. A pandemic, a sharp and deep recession, social distancing, civil unrest, and political uncertainty have left most people, much less investors, with severe anxieties. I’ve mentioned before that a professional investor is, or should be, a professional worrier. In that regard, this year has filled the plate of most investors. On the other hand, we have long subscribed to Mr. Buffett’s maxim that, in order to successfully invest, “one must be cautious when the majority are bold and bold when the majority are cautious.” This year, likewise, has supplied large portions of caution and, recently, even a little boldness.
So, where are we now? We believe it is obvious that the economy hit bottom in April and has begun to recover. It was a quick, but devastating, two-month recession that saw the economy come to a virtual standstill, the result of governmental and social efforts to mitigate the impact of COVID-19. Since May, the economy has been battling to reopen, although a resurgence of infections in many regions and lasting damage done to many service industries is producing a slower-moving recovery than anyone would like. Our economists have been telling us, however, that virtually all recoveries from recessions disappoint as to speed, and the peculiarities of the current situation will not change that.
We are indeed in recovery, but all recoveries are also uneven. In other words, we shouldn’t be surprised if “a few steps forward” are followed by “one step back” every now and then. This rhythm disappoints many who want a quick, straight-line recovery, but that’s even contrary to human nature. I’m reminded of one of C.S. Lewis’ most memorable characters, the old demon, Screwtape, who wrote to his young apprentice, Wormwood, “Has no one ever told you about the law of Undulation? … [Humans’] nearest approach to constancy … is undulation – the repeated return to a level from which they repeatedly fall back, a series of troughs and peaks. If you had watched your patient carefully, you would have seen this undulation in every department of his life – his interest in his work, his affection for his friends, his physical appetites, all go up and down.” And, we might add, his mood about the economic and investment future.
It’s the stock market that has surprised most occasional observers. “How can the market be going up when there is so much trouble around?” I refer to the above-noted Law of Undulation. Did the value of American businesses really drop by 35% during four weeks in February-March? No, in my estimation, but market prices did so drop, affected as they are by undulating emotions. Market prices have risen sharply since then. A little good news triggers that classically American emotion: optimism. Will pessimism return, at least for a little while? Of course, this is how economies and stock markets always work: they undulate as they make forward progress. A pandemic merely adds a new factor to the undulation.
Last night I had the pleasure of watching my oldest grandchild graduate from high school, employing virus-safe practices, on a video broadcast via the internet. As I saw my grandson and his friends, one after the other, take off their masks momentarily to pick up their diplomas off the table and smile for the camera, I was thrilled. These hard-working young people are sustaining extraordinary difficulties and yet are enduring them with aplomb, full of the optimism of youth. We need that. It’s what keeps us, and the nation, going.
Our country has been through many troubles in the past, and we are going through more now. But through all these undulations we’ve managed to make quite a bit of forward progress along the way. I fully expect more of the same. We are investing that way.
We appreciate your confidence in us.
Gratefully,
Mark A. Keller, CFA
CEO and Chief Investment Officer
Weekly Energy Update (July 23, 2020)
by Bill O’Grady, Thomas Wash, and Patrick Fearon-Hernandez, CFA | PDF
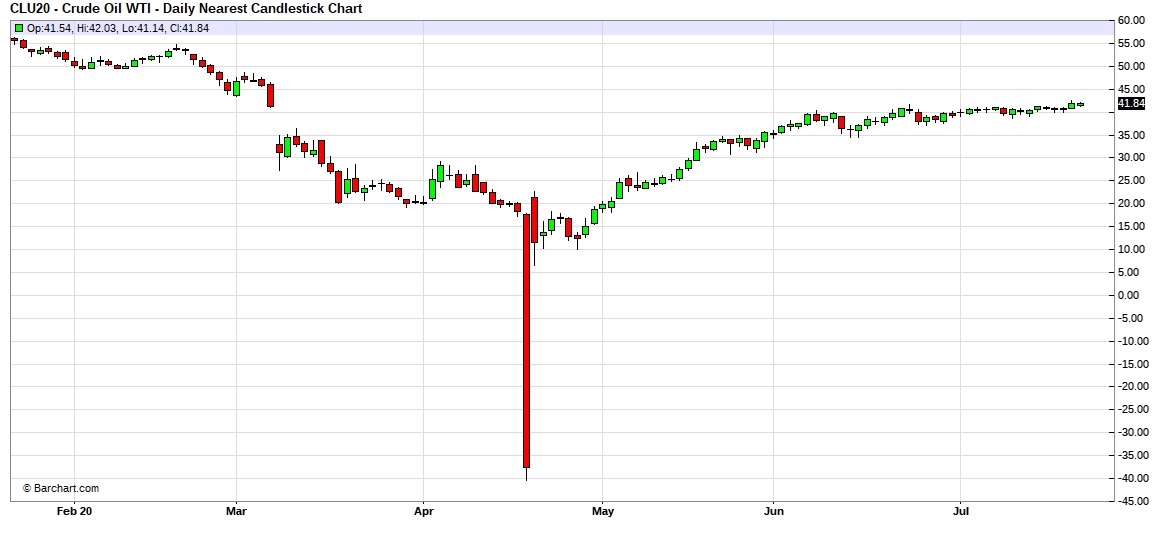
Here is an updated crude oil price chart. The oil market has stabilized at higher levels after April’s historic collapse.
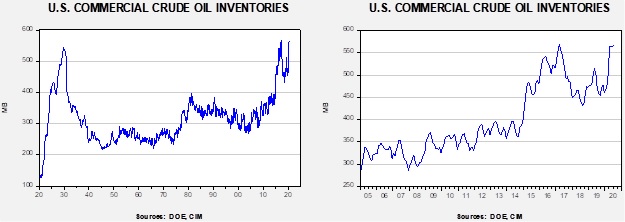
Crude oil inventories reversed part of last week’s unexpected draw, with stockpiles rising 4.9 mb compared to forecasts of a 0.8 mb draw. The SPR was unchanged this week.
In the details, U.S. crude oil production rose 0.1 mbpd to 11.1 mbpd. Exports rose 0.5 mbpd, while imports rose 0.4 mbpd. Refining activity fell 0.2%, near expectations.
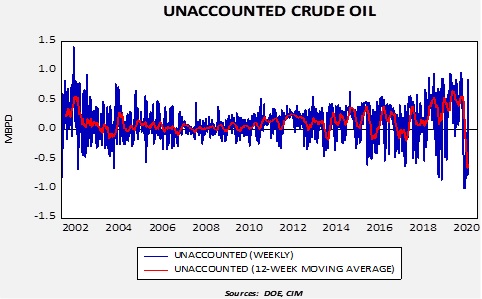
Unaccounted-for crude oil is a balancing item in the weekly energy balance sheet. To make the data balance, this line item is a plug figure, but that doesn’t mean it doesn’t matter. This week’s number is +857 kbpd. This is a large number and suggests the DOE is still struggling to figure out what is going on in the domestic crude oil market. The rise may be signaling that production is returning faster than the official figures indicate, but we will need to see more data to confirm that notion.
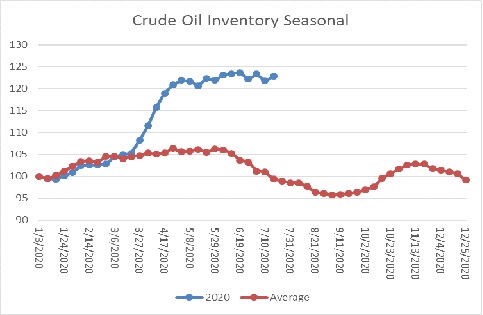
The above chart shows the annual seasonal pattern for crude oil inventories. This week’s data showed a rise in crude oil stockpiles. We are well into the seasonal draw for crude oil. By this time of the summer, we have usually seen a 5% decline in commercial storage. The fact that inventories are mostly steady is a bearish factor.
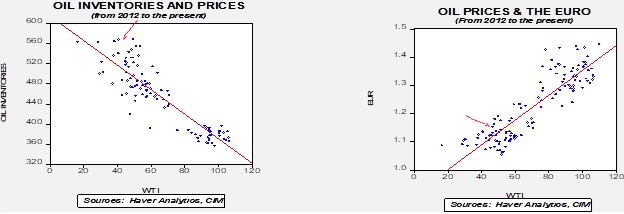
Based on our oil inventory/price model, fair value is $28.63; using the euro/price model, fair value is $54.37. The combined model, a broader analysis of the oil price, generates a fair value of $41.68. We are starting to see a wide divergence between the EUR and oil inventory models. The weakness we are seeing in the dollar, which we believe may have “legs,” is bullish for crude oil and may overcome the bearish oil inventory overhang.
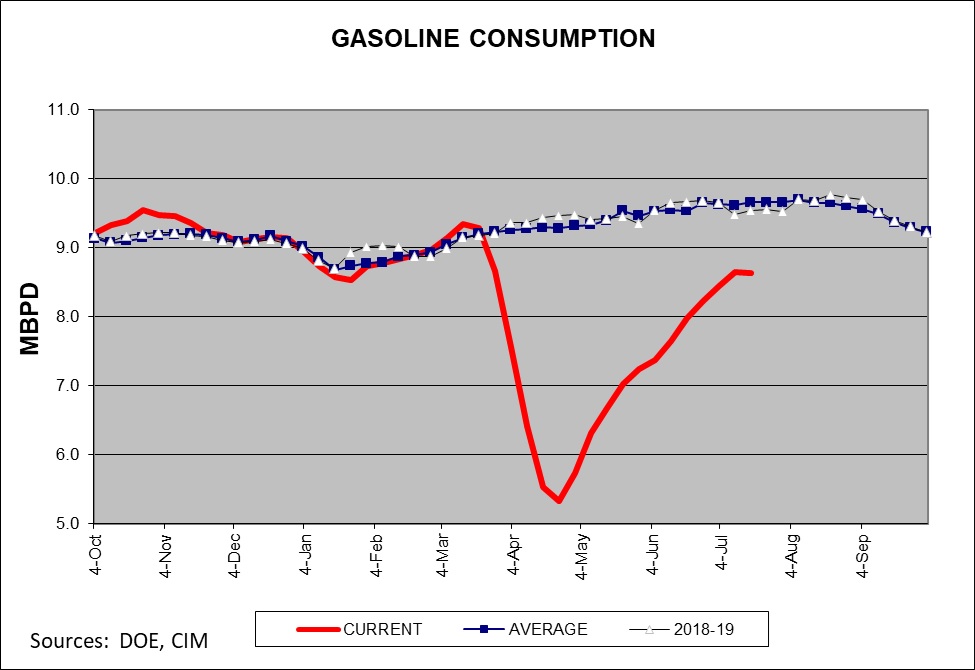
After a steady recovery since the trough in late April, gasoline consumption stalled this week. We suspect this is related to the surge in COVID-19 infections; if it continues, it is a bearish factor for crude oil prices.
In geopolitics, we are seeing growing tensions in the Eastern Mediterranean between Turkey and Greece over natural gas deposits around Cyprus. This dispute could involve multiple countries, including Egypt and Israel. Complicating matters further is the current proxy war in Libya.
View PDF
Asset Allocation Quarterly (Third Quarter 2020)
by the Asset Allocation Committee | PDF
- We expect the current U.S. recession to be deep, yet brief, with a long period of recovery and the potential for expansion toward the latter portion of our forecast period.
- The Federal Reserve has stabilized the financial markets and ensured the continued functioning of the corporate debt market.
- Long-term Treasuries served the strategies well, especially through the first half of this year, but appear to have run their course and are now absent from all strategies.
- We retain a favorable outlook for equities. Therefore, elevated exposures are maintained and the former overweight to growth has been brought to an even weight with value.
- Valuations are favorable for lower capitalization stocks, which are represented in each of the strategies.
- Precious metals occupy an increased weight in each strategy with gold supplemented by a modest exposure to silver.
ECONOMIC VIEWPOINTS
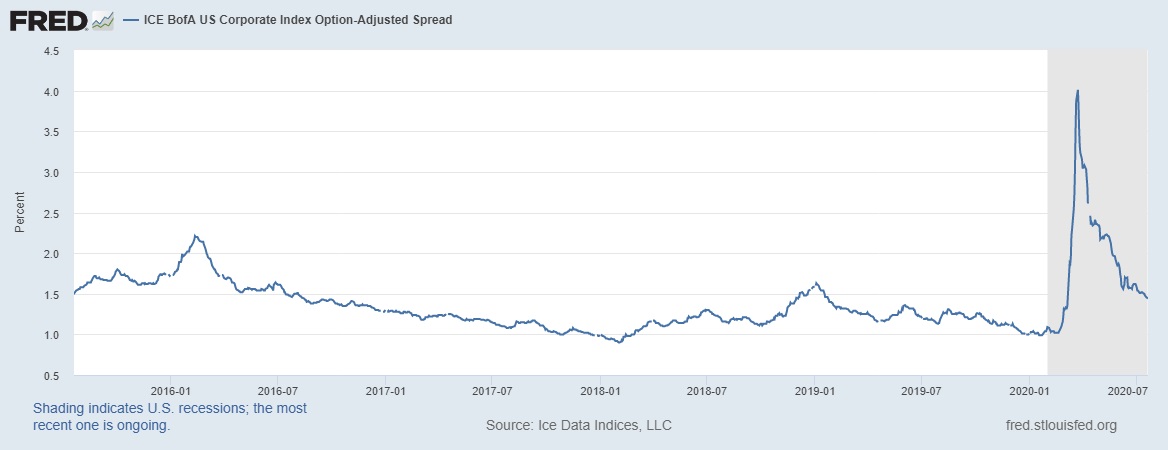
The coma into which the U.S. economy was placed created the deepest decline in GDP since the 1930s and in the shortest order ever recorded. Over a period of only a few weeks, seven years of employment gains were wiped away and unemployment rates surged to double-digit levels. The monetary and fiscal responses have been extraordinary, totaling over $4.5 trillion in the aggregate, inclusive of the $2.3 trillion Coronavirus Aid Relief and Economic Security Act and the Federal Reserve’s multitude of acronym laden programs designed to calm and ensure the integrity of financial markets. The effects have been encouraging as markets have rebounded. Perhaps the broadest direct and indirect impact on the markets has been the Fed’s shoring up of the corporate debt market through its purchases of broad-based ETFs as well as selected issues. This has had the effect of narrowing spreads on corporates from levels last seen in the Great Recession to more traditional levels, as illustrated in this first chart.
Our earlier forecast was for a dramatic decline in U.S. GDP recorded for the second quarter of this year, with the potential to stretch into the third and fourth quarters should a second wave of the virus assert itself. Though we now believe that the worst of the economic damage is behind us, our expectations are that the recovery period will be of a long duration. The Fed should be extremely accommodative over the next three years as Chair Jerome Powell noted during his recent testimony to the House Finance Committee. In an effort to aggressively suppress financial stress, the Fed’s posture will keep fed funds rates near zero for the next two years and the Fed’s balance sheet bloated. Even with the accommodation, we do not believe that inflation will become an issue over our three-year forecast period despite the extraordinary measures employed not only by the Fed, but also other global central banks. Given a world awash in liquidity, we find the natural landing spots to be equities and gold, the latter benefitting from global geopolitical uncertainties.
STOCK MARKET OUTLOOK
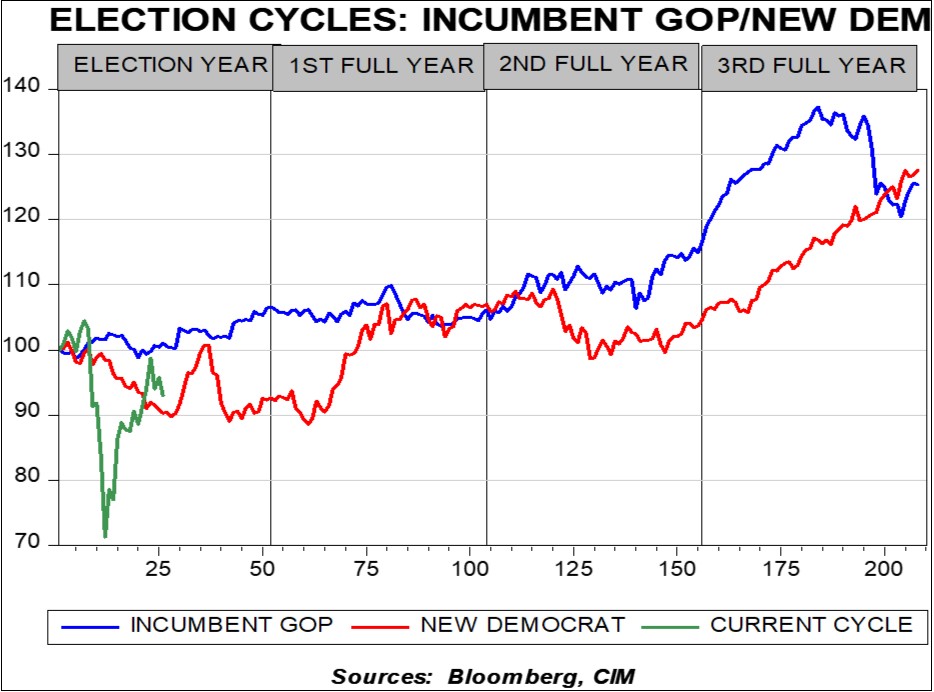
The process we employ in our quarterly cyclical congress led to an extension of where we arrived last quarter relative to expectations for equities. While the pace at which equities recovered over the past quarter was dramatic, the direction was completely within our expectations. We find that the prospects for continued repair and even growth for equities are positive, despite near-term declines in earnings per share, which Confluence estimates to be at $113.70 on the S&P 500 for 2020. The unleashing of pent-up demand, adaptations to work and leisure, and the realigning of supply chains and resultant inventory adjustments all hold positive implications for the U.S. equity market over the next three years. Naturally, there are inherent risks to this thesis, though we don’t count the November U.S. elections as holding an outsized risk. As the accompanying chart exhibits, our analysis of a change in government implies similar results over the course of our forecast period. Although a switch will certainly create winners and losers among companies, industries, and sectors, the overall market is relatively unaffected. Much more risk could result from a potential policy mistake. A rapid withdrawal of stimulus money, further weaponization of the U.S. dollar, or a full monetization of debt are among policies that could unhinge investor behavior and lead to problems among equities. Nevertheless, we view the potential for a policy mistake of large magnitude to be remote, and thereby remain positive on the equity markets over the next three years.
Among U.S. equities, we find lower capitalization stocks to hold more favorable valuations. Accordingly, mid-cap equities are overweight in each strategy. In the strategies with higher risk tolerances, small cap stocks are also overweight. Across the capitalization spectrum we removed the overweight to growth, and now have a neutral posture between value and growth. However, the continued sector overweights to Technology, Communications Services, and Consumer Discretionary create a de facto tilt toward growth, yet not as explicit as the prior quarter.
Beyond the U.S., foreign developed market equities generally hold attractive valuations relative to U.S. counterparts. However, our consensus view over the forecast period is that U.S.-based investors are better positioned with domestic equity exposure due to the lack of a catalyst for the waning value of the U.S. dollar from its current strength. Although developed non-U.S. markets are currently absent from the strategies, emerging market stocks are represented in risk-appropriate strategies. Our view on China, which represents over 37% of emerging market exposure, is that while it engenders significant geopolitical risk, the massive stimulus measures the Chinese government announced at the end of May hold potential advantages for not only Chinese stocks, but also for those in other emerging countries as it is designed for both infrastructure and stimulation of private consumption.
BOND MARKET OUTLOOK
Yields across the U.S. Treasury curve remain historically low and spreads on corporate bonds, including all ratings of investment grade and speculative grade, have narrowed dramatically over the course of the past quarter. The Fed’s entry as a market participant in corporate bonds, through its purchasing of broad-based ETFs and selected individual credits, implies a makeshift policy floor on prices and has instilled confidence in the bond market. Our consensus calls for low rates extending throughout the forecast period, with continued tightening of credit spreads. While we acknowledge the potential for a spike in default rates in high-yield credits as well as an elevated level of credit downgrades due to the effects of COVID-19, over the full forecast period we expect returns on short- and intermediate-term bonds to deliver coupon returns. The sole deviation from this expectation is in the long-term bond category. Although the strategies benefited handsomely from their exposures to long-term Treasuries, we don’t believe that potential returns outweigh duration risk faced by longer-term instruments. Accordingly, they are now absent from all strategies.
OTHER MARKETS
Our consensus view on REITs is that in the aggregate they will earn their dividend over the forecast period. The office/retail segment is certainly struggling but represents less than 20% of the REIT index. More impactful are the data centers, storage, and cell towers that represent a growing proportion of the REIT index. Consequently, we believe REITs provide a differentiated source of income and are thereby positioned accordingly in the strategies where income is a component.
Gold has been an element in each of the strategies over the past several quarters, and allocations were enhanced this quarter. Not only is gold an important diversifier in an era of increased global risk, but the price of gold stands to benefit in a world swimming in liquidity that is in search of a haven. Gold is supplemented in each of the strategies with exposure to silver. We find the advantages of having silver are two-fold—the industrial uses for silver make it desirable during an economic recovery and our research indicates that the gold/silver ratio is at its highest level since the period following World War II.
Confluence of Ideas – #15 “The 2020 Election: Part 3” (Posted 7/21/20)
Weekly Geopolitical Report – The Threat of Militarization in Brazil (July 20, 2020)
by Patrick Fearon-Hernandez, CFA | PDF
When investors think about Latin American politics and policy, the various countries’ military forces often come to mind. You’d almost think the region was a hotbed of international aggression, invasions, and state-to-state warfare. The reality is that for the last century, national military organizations in Central and South America have mostly been used against indigenous insurgencies or opposition political movements. In recent decades, even that role has been proscribed in most countries, raising hopes that the region has finally learned to solve its domestic political conflicts democratically instead of by force.
Current economic and social challenges in Brazil have prompted some officials to hint that the military should have a stronger role in guiding the state again. Some people in the government have even issued veiled threats to reimpose a military dictatorship in the country. In this report, we’ll examine what has led to the current threat and assess the likelihood of a military-backed government in Brasilia. As always, we’ll end with a discussion of the likely ramifications for investors if the military does take a bigger role in Brazilian politics.