by Bill O’Grady, Thomas Wash, and Patrick Fearon-Hernandez, CFA | PDF
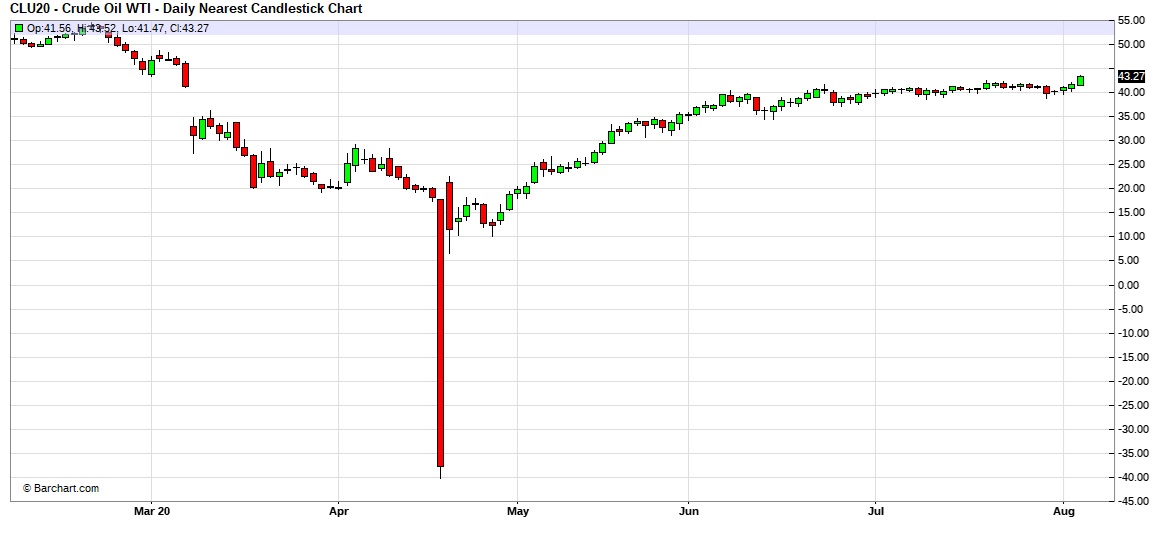
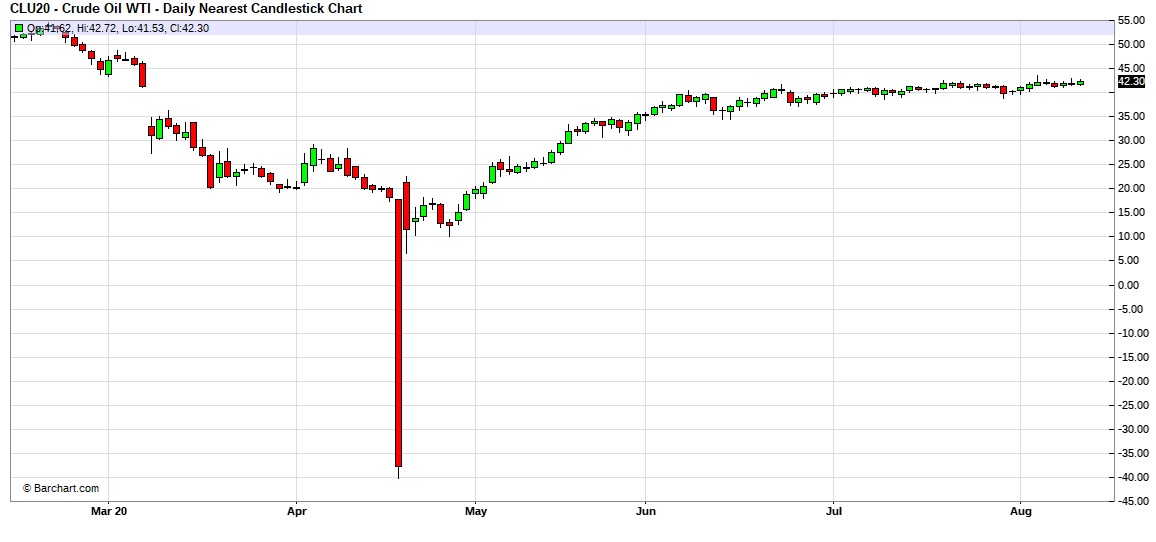
Here is an updated crude oil price chart. The oil market has stabilized at higher levels after April’s historic collapse.
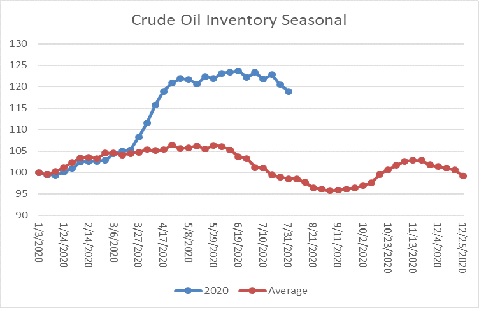
Crude oil inventories fell more than anticipated, declining 4.5 mb compared to forecasts of a 3.7 mb decline. The SPR declined 2.2 mb as oil that was placed in the SPR for temporary storage is now being put back into the commercial system.
In the details, U.S. crude oil production fell 0.3 mbpd to 10.7 mbpd. Exports rose 0.3 mbpd, while imports fell 0.4 mbpd. Refining activity rose 1.4% but most of that was due to declining East Coast capacity.
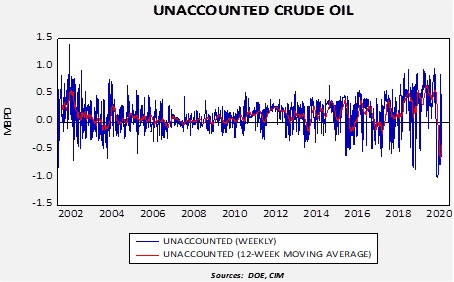
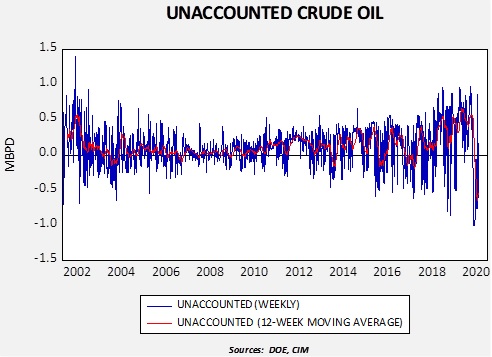
Unaccounted-for crude oil is a balancing item in the weekly energy balance sheet. To make the data balance, this line item is a plug figure, but that doesn’t mean it doesn’t matter. This week’s number is +515 kbpd. Although the volatility of this number is elevated, the trend is slowly stabilizing.
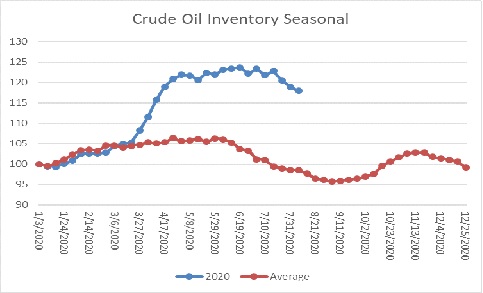
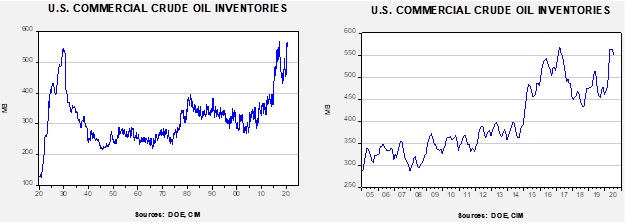
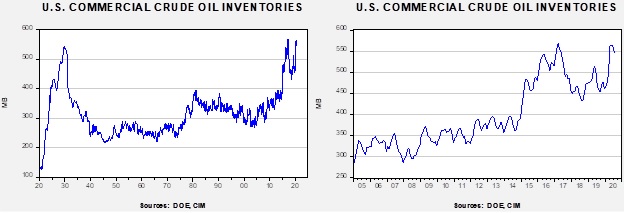
The above chart shows the annual seasonal pattern for crude oil inventories. This week’s data showed another decline in crude oil stockpiles. We are approaching the end of the seasonal withdrawal period. Although the declines of the last few weeks are supportive, stockpiles remain well above seasonal norms and remain a bearish factor.
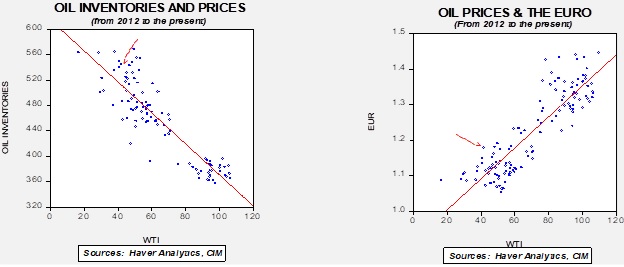
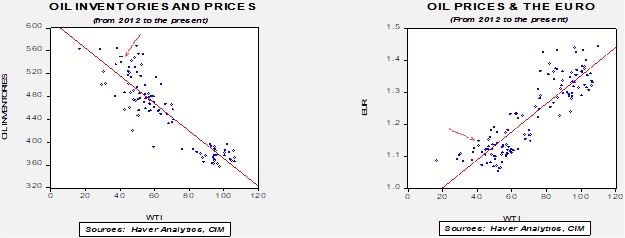
Based on our oil inventory/price model, fair value is $35.95; using the euro/price model, fair value is $63.51. The combined model, a broader analysis of the oil price, generates a fair value of $49.85. The wide divergence continues between the EUR and oil inventory models. As the trend in the dollar rolls over, it is bullish for crude oil. Any supportive news on reducing the inventory overhang could be very bullish for crude oil.
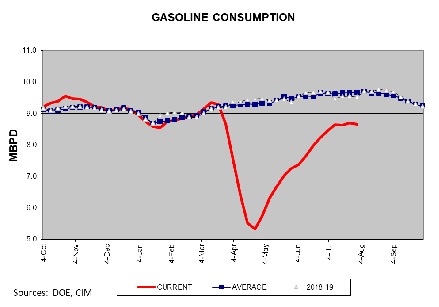
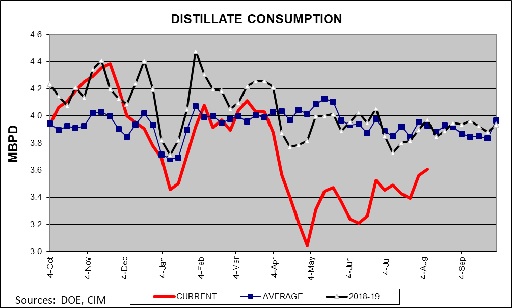
As we have noted recently, gasoline consumption has stalled. However, we are seeing some good news on the distillate front—demand is clearly recovering.
In oil news, OPEC has revised its demand outlook for 2020 lower, calling for a 9.1 mbpd decline in demand this year. If VP Biden wins in November, it may be a bearish event for oil. Not because of any new “green” legislation but more because he would likely return to the Iran nuclear deal that was implemented by President Obama. If he does, it is likely that Iranian oil exports would resume, adding around 2.0 mbpd to the oil markets. That would be difficult for OPEC+ to manage.
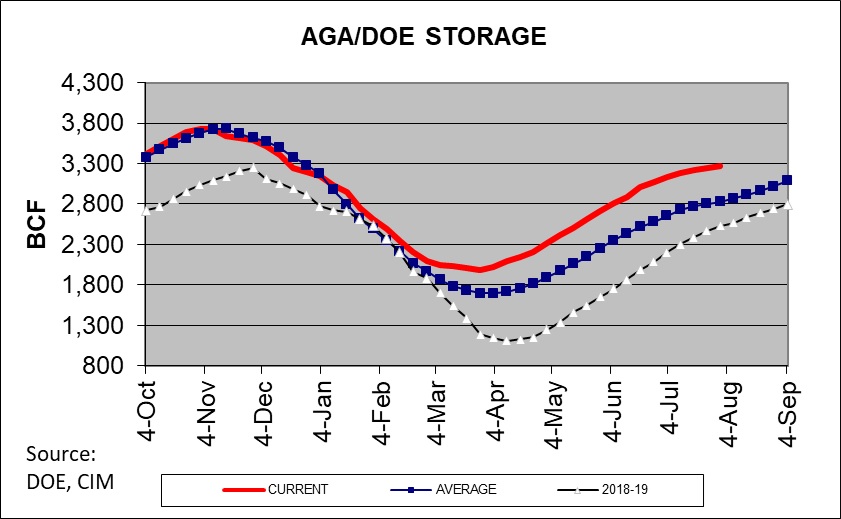
We have seen a surprising jump in natural gas prices.
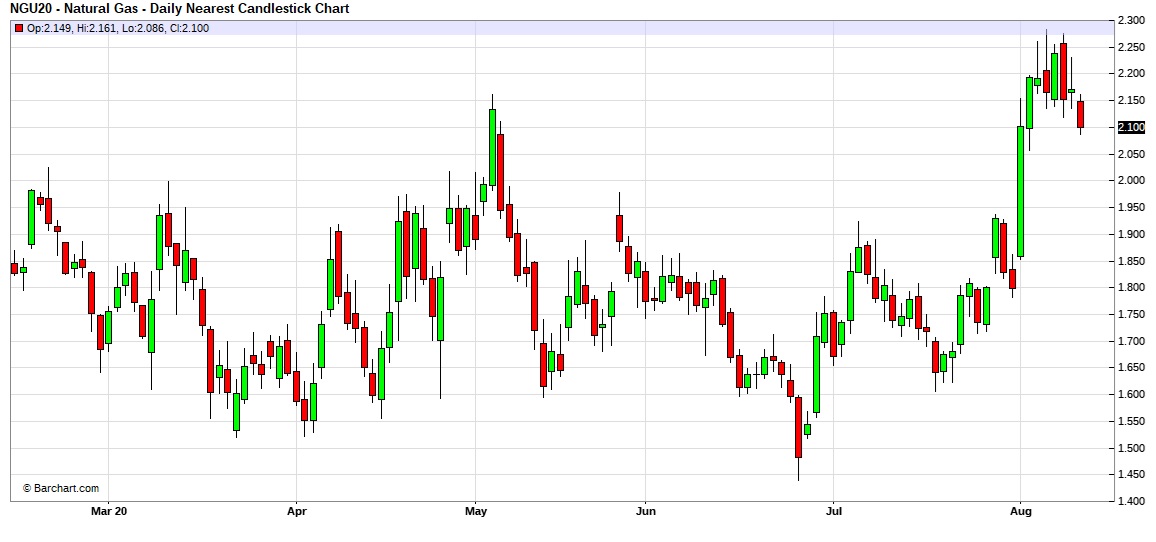
As the chart shows, there was a huge rally in early August and prices have been consolidating since. The jump in prices occurred despite the persistent inventory overhang.
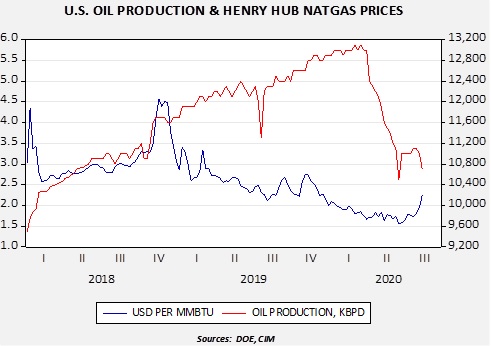
The rise in prices is probably due to expectations that falling crude oil output will reduce natural gas supplies. It is not unusual for oil drillers to discover natural gas (so-called “associated gas”), so when oil production is elevated, natural gas supplies increase almost as a byproduct.
Some of the suddenness of the price action was likely due to rising coastal temperatures, but the sustainability will really come down to winter weather. Current outlooks are bearish for prices.