

Business Cycle Report (September 24, 2020)
by Thomas Wash | PDF
The business cycle has a major impact on financial markets; recessions usually accompany bear markets in equities. The intention of this report is to keep our readers apprised of the potential for recession, updated on a monthly basis. Although it isn’t the final word on our views about recession, it is part of our process in signaling the potential for a downturn.
In August, the diffusion index rose further above contraction territory, signaling that the economy remains on track to expand in Q3. Financial markets were sending positive signals as equities surged, while the yield curve steepened. Meanwhile, the labor market continues to show signs of improvement as hires continue to surpass the pre-pandemic high. Markets responded positively to news regarding the stage of development of various vaccines. However, the lack of progress on additional fiscal stimulus continues to weigh on growth expectations as concerns over slowing consumer spending continue to mount. As a result, five out of the 11 indicators are in contraction territory. The reading for August rose from 0.0303 to 0.0909, above the recovery signal of -0.100.
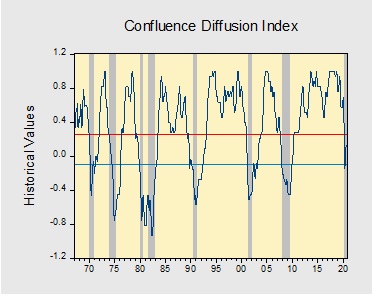
The chart above shows the Confluence Diffusion Index. It uses a three-month moving average of 11 leading indicators to track the state of the business cycle. The red line signals when the business cycle is headed toward a contraction, while the blue line signals when the business cycle is headed toward a recovery. On average, the diffusion index is currently providing about six months of lead time for a contraction and five months of lead time for a recovery. Continue reading for a more in-depth understanding of how the indicators are performing and refer to our Glossary of Charts at the back of this report for a description of each chart and what it measures. A chart title listed in red indicates that indicator is signaling recession.