Weekly Geopolitical Report – The Threat of Militarization in Brazil (July 20, 2020)

by Patrick Fearon-Hernandez, CFA | PDF

When investors think about Latin American politics and policy, the various countries’ military forces often come to mind.  You’d almost think the region was a hotbed of international aggression, invasions, and state-to-state warfare.  The reality is that for the last century, national military organizations in Central and South America have mostly been used against indigenous insurgencies or opposition political movements.  In recent decades, even that role has been proscribed in most countries, raising hopes that the region has finally learned to solve its domestic political conflicts democratically instead of by force.

Current economic and social challenges in Brazil have prompted some officials to hint that the military should have a stronger role in guiding the state again.  Some people in the government have even issued veiled threats to reimpose a military dictatorship in the country.  In this report, we’ll examine what has led to the current threat and assess the likelihood of a military-backed government in Brasilia.  As always, we’ll end with a discussion of the likely ramifications for investors if the military does take a bigger role in Brazilian politics.

Read the full report

Asset Allocation Weekly (July 17, 2020)

by Asset Allocation Committee | PDF

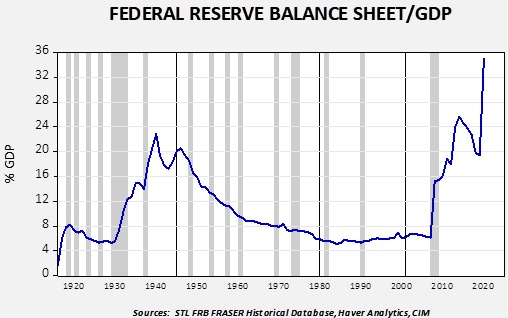
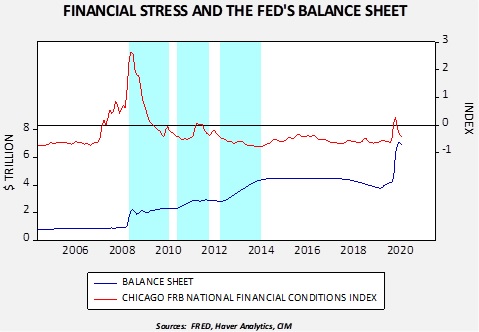
One of the burning issues about the current path of policy is its inflationary impact.  In other words, will the massive increase in fiscal spending and the Fed’s balance sheet lead to higher price levels?  To discuss this issue, we return to the equation of exchange:

M x V = P x Q

The money supply times velocity is equal to the price level times goods and services produced.  This equation is an identity; simply put, it will always be true.  But, the direction of causality of the variables comes from theory.  Classical economists and their philosophic progeny, monetarists, argued that V and Q were fixed, so changes in price levels were due to changes in money supply.  Keynesians and their most recent variation, modern monetary theorists, argue that Q can be below its capacity and V is variable, so increases in M may not necessarily lead to higher price levels but could result in a decline in V or a rise in Q.  Essentially, the Keynesians and their modern versions argue that if Q is below capacity, increasing M can boost the economy without triggering inflation.

The problem with both of the major theories is that there is a psychological element to the equation that tends to be downplayed.  The problem for the Classical construct is that even at full employment (Q) rising M might simply lead to falling V.  Complacency about future inflation or fears about the future growth path of the economy might lead households and businesses to simply hold larger cash balances.  Confounding the Keynesians is the potential outcome where P rises even with Q below capacity when M is increased if economic actors fear future inflation.  In fact, higher price levels can result even without a rise in M if V rises.  The most extreme case of this condition is hyperinflation, where V rises rapidly as households and businesses rush to convert cash to real goods that will hold their value.

Therefore, determining if there is an inflation problem from current policy is tricky because there is a psychological element that is difficult to estimate.  It is easy to measure money supply, output or price levels, but the psychology of velocity is hard to measure and potentially prone to sudden shifts.

Reframing the question can simplify this problem.  If a household receives a notable sum of money, let’s say, $10,000, what does it do with it?  If the householder fears future price increases, it would make sense to use that money to buy inventory.  In other words, they may take part of it to buy food, perhaps consumer durables, art, gold, or other items that might hold their value.  On the other hand, if there is little fear of future inflation, the household may be content to simply hold the cash as savings or place it in other financial assets.

One way to answer this question is to compare the money supply to gold prices.  If some money supply, say, M2, rises faster than gold, it would suggest that economic actors are not afraid of future inflation.  A rising ratio of M2/gold would be a positive signal for financial assets; on the other hand, a falling ratio would likely be bearish.  Now, it is possible that a contracting money supply could distort the measure.  The monthly change in M2 since 1959 has only been negative 4.4% of the time.  Over that same time frame, it has never been negative on a yearly change basis.

Anyone familiar with financial market history can note that equity markets tend to outperform when this ratio rises, but equities tend to suffer when the ratio declines.  The ratio captures that when the supply of money is rising relative to gold (the proxy for real assets), economic actors tend to put this excess liquidity into financial assets.  A declining ratio suggests a preference for real assets.

In general, the ratio has been mostly steady for the past four years.  Despite a rally in gold, the ratio hasn’t declined.  Put another way, we haven’t seen households and firms show significant inflation fears despite a massive increase in liquidity.  Gold prices have been mostly rising with M2 but not accelerating faster than the money supply.  And so, in a portfolio, gold has been acting as a diversification asset without unduly hampering performance.  As the Fed has boosted liquidity, funds have been going into both stocks and gold at a pace where neither has signaled a particular bias.  If inflation fears escalate, we would expect this ratio to decline and equity markets to show signs of weakness.  But, for now, easy monetary policy is supportive for both gold and equities.

View PDF

Weekly Energy Update (July 16, 2020)

by Bill O’Grady, Thomas Wash, and Patrick Fearon-Hernandez, CFA | PDF

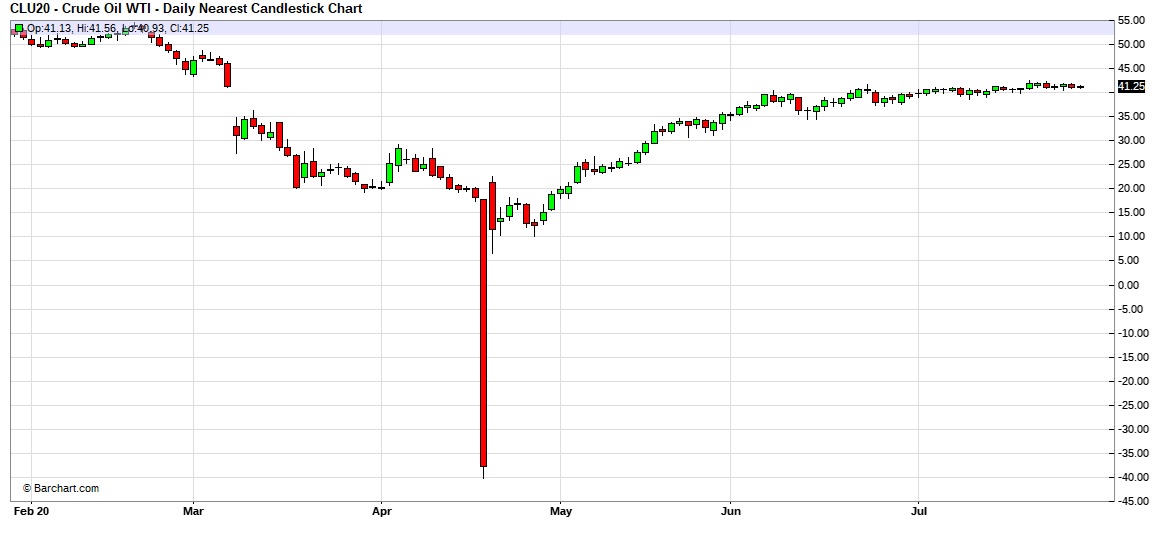
Here is an updated crude oil price chart.  The oil market has stabilized at higher levels after April’s historic collapse.

(Source: Barchart.com)

Crude oil inventories reversed last week’s unexpected rise, with stockpiles falling 7.5 mb compared to forecasts of a 1.8 mb draw.  The SPR added 0.1 mb this week.

In the details, U.S. crude oil production was unchanged at 11.0 mbpd.  Exports rose 0.2 mbpd, while imports declined 1.8 mbpd.  Refining activity rose 0.6%, near expectations.

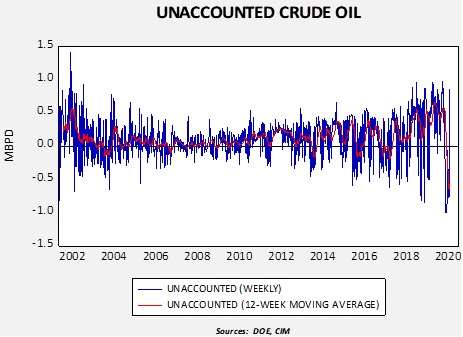
High negative readings continue for unaccounted-for crude oil, although they are higher than what we saw a few weeks ago.

Unaccounted-for crude oil is a balancing item in the weekly energy balance sheet.  To make the data balance, this line item is a plug figure, but that doesn’t mean it doesn’t matter.  This week’s number is -768 kbpd.  This is a large number and suggests the DOE is still struggling to figure out what accounts for the missing barrels.  We suspect much of it is caused by the DOE overestimating production.

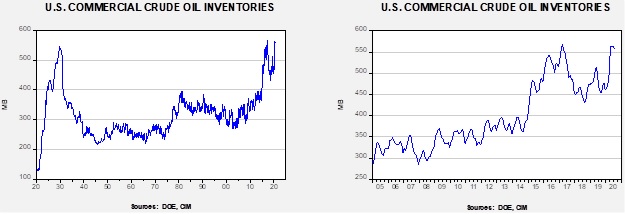
(Sources: DOE, CIM)

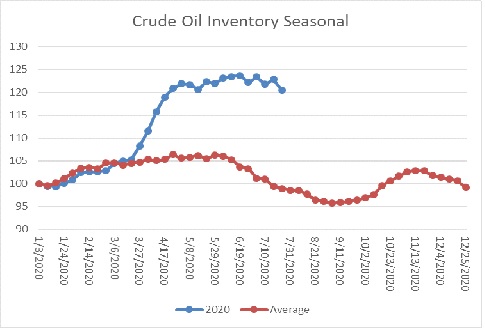
The above chart shows the annual seasonal pattern for crude oil inventories.  This week’s data showed a decline in crude oil stockpiles.  We are well into the seasonal draw for crude oil.  By this time of the summer, we have usually seen a 5% decline in commercial storage.  The fact that inventories are mostly steady is a bearish factor.

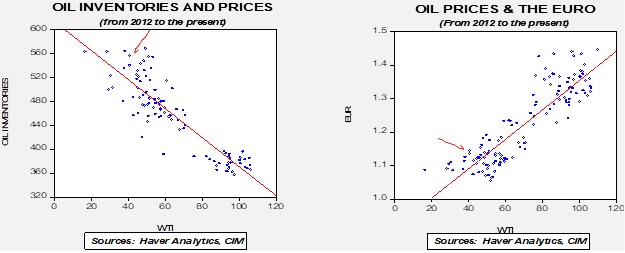
Based on our oil inventory/price model, fair value is $30.14; using the euro/price model, fair value is $53.25.  The combined model, a broader analysis of the oil price, generates a fair value of $40.42.  We are starting to see a wide divergence between the EUR and oil inventory models.  The weakness we are seeing in the dollar, which we believe may have “legs,” is bullish for crude oil and may overcome the bearish oil inventory overhang.

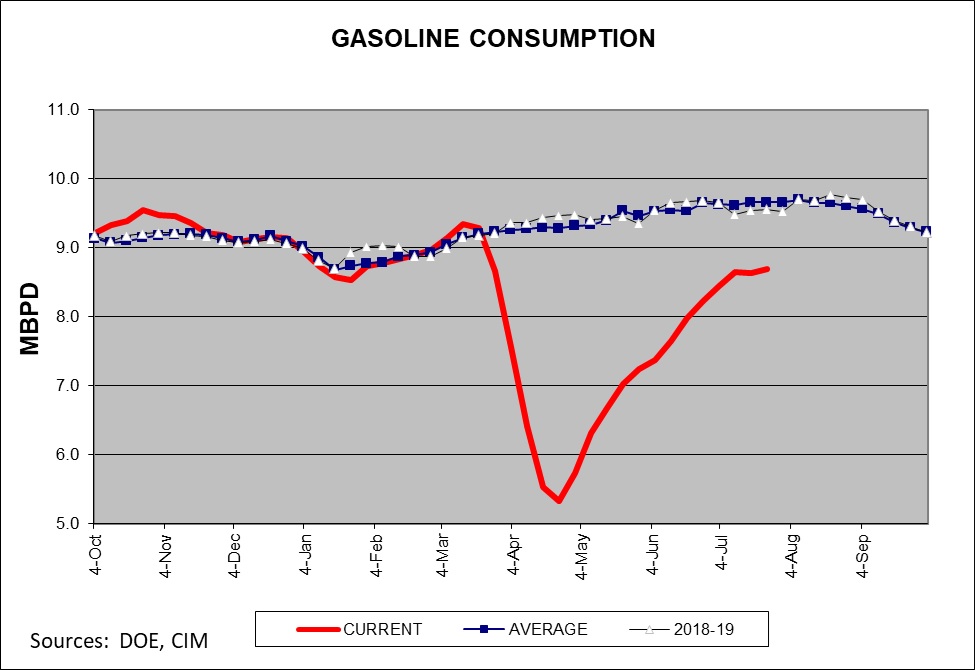
Gasoline consumption remains below average, but the recovery is unmistakable.

The oil and gas industry is facing a disinvestment movement from college and university endowments, driven by student activism.  In general, such movements tend to gain momentum when the cost of the action is low.  Current low oil prices make activism toward disinvestment relatively costless.  This action could become difficult to sustain if oil prices (and gasoline prices) rise in the future.

In light of last spring’s oil price collapse, the CFTC is getting involved in commodity ETPs.  The commodity regulator is pushing for greater disclosure of activity.  The ETPs were widely blamed for the negative prices for WTI (see the chart above) seen in April.

The recent rise in VAT in Saudi Arabia is calling into question the kingdom’s social contract.  For years, the House of Saud offered Saudi citizens a deal—the government would provide a deep safety net in return for not having a direct voice in how citizens are governed.  In essence, the Saudis created a rentier state that was funded from oil revenues.  In an attempt to diversify the economy in a period of low oil prices, CP Salman has moved to raise taxes to restore some of the lost revenue.  What remains to be seen is if common Saudis will tolerate “taxation without representation.”

View PDF

Shining a Light on Indexes: How to Help Investors Better Achieve Their Goals (July 2020)

A Report from the Value Equities Investment Committee | PDF

“What is the appropriate benchmark for your strategy?”

This is a question frequently posed to an investment manager. Before this question can be answered, it is necessary to gain a solid understanding of the strategy by examining the manager’s investment philosophy and how it is applied in the investment process, and, more specifically, how it is expected to perform throughout a full business cycle.

At Confluence Investment Management, our investment philosophy for the domestic value equity strategies was adopted in mid-1994 at our predecessor firm and continues to be implemented more than 25 years later. The approach is focused on understanding and valuing individual businesses with the emphasis on owning competitively advantaged businesses at attractive prices. It is a fundamental approach that views risk as losing money, or more precisely, the probability of a permanent loss of capital. Today, it is the foundation for all six of our domestic value equity strategies.

It is an approach borne from the belief that as investment managers we manage risk, not returns.  Returns are the byproduct of an investment process and how well it is deployed. Our philosophy and process are centered around individual businesses with the intent of owning a collection of superior entities in a concentrated manner and then allowing them to compound over long periods.

Our energy has never been focused on managing to a benchmark or index as it is not additive to the investment process. Furthermore, we do not view tracking error as a measure of risk. Quite the contrary, active investors should welcome tracking error as it is the only way to outperform an index. This is not to say that we are not mindful of the indexes; we are, and it is perfectly reasonable to compare us to an index. But it is equally important to understand how an index is constructed to better understand the applications and limitations when using that index as a benchmark to measure an investment manager.

Read the full report

Weekly Geopolitical Report – Why China and India Are Fighting (July 13, 2020)

by Patrick Fearon-Hernandez, CFA | PDF

In a bizarre confrontation last month, Chinese and Indian soldiers fought a pitched battle in near total darkness high up in the Himalayan mountains.  If that wasn’t strange enough, the weapons used were merely fists, stones, police batons, and wooden clubs wrapped in barbed wire or studded with nails.  At least 20 of the Indian soldiers died, many after falling down steep mountain ravines or freezing to death in the cold.  An unknown number of Chinese troops also died.  In spite of the primitive weapons used and the relatively small number of casualties, the skirmish created a major crisis and risk of war between Asia’s two nuclear behemoths.

In this report, we explain how the confrontation came about and why it was waged in such a primitive way.  More importantly, we examine the tensions building between China and India and how the skirmish could cause them to spiral out of control.  We also outline how things could develop from here and the likely ramifications for investors.

Read the full report