by Bill O’Grady, Thomas Wash, and Patrick Fearon-Hernandez, CFA | PDF
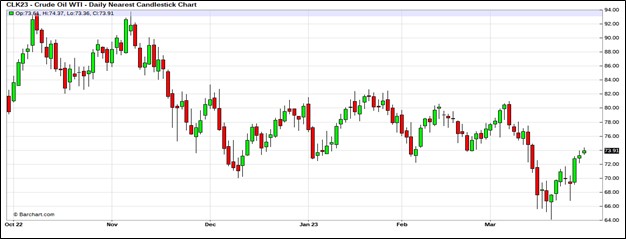
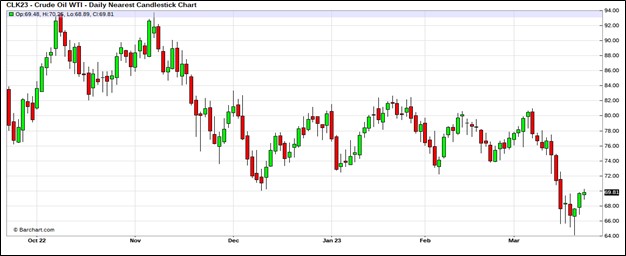
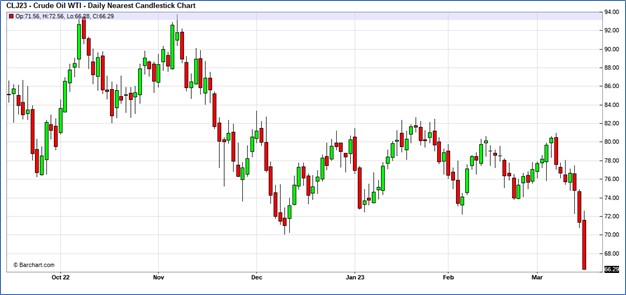
Crude oil jumped on the unexpected decision by OPEC+ to cut production targets.
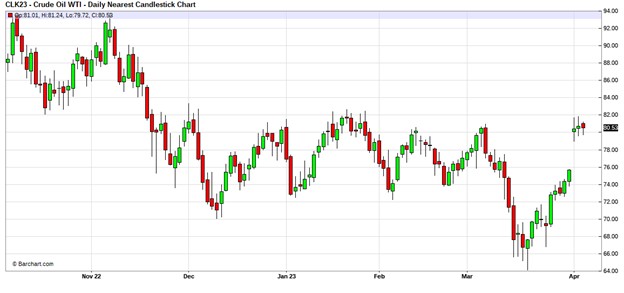
(Source: Barchart.com)
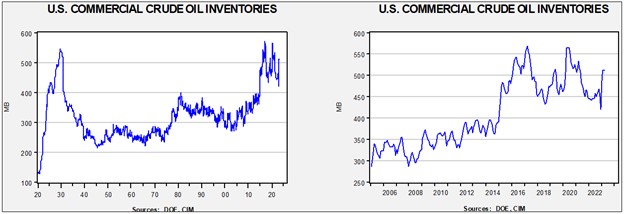
Crude oil inventories fell 3.7 mb compared to the forecast of a 1.8 mb build. The SPR fell 0.4 mb.
In the details, U.S. crude oil production was unchanged at 12.2 mbpd. Exports rose 0.7 mbpd, while imports increased 1.8 mbpd. Refining activity declined 0.7% to 89.6% of capacity.
(Sources: DOE, CIM)
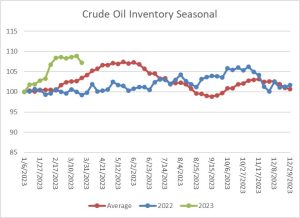
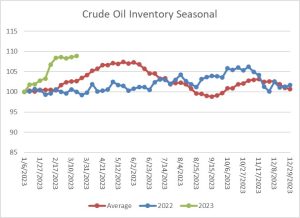
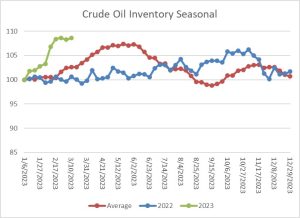
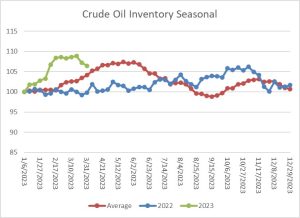
The above chart shows the seasonal pattern for crude oil inventories. After accumulating oil inventory at a rapid pace into mid-February, injections first slowed and then declined for the past two weeks, putting levels near seasonal norms.
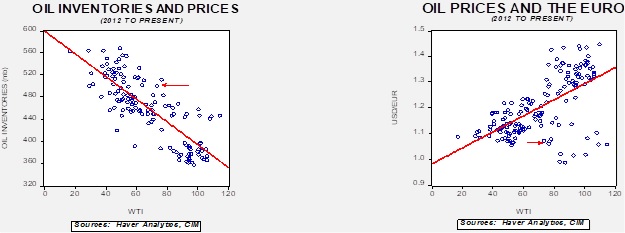
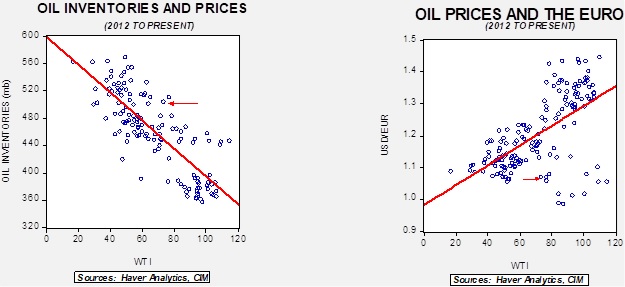
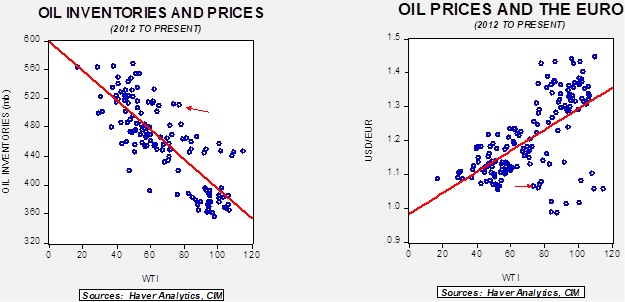
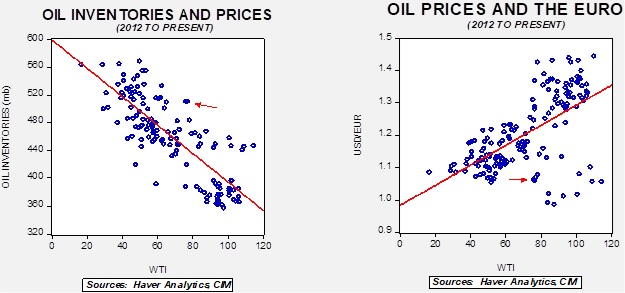
Fair value, using commercial inventories and the EUR for independent variables, yields a price of $55.48. The actions of OPEC+ this week are clearly designed to prevent this sort of price from emerging.
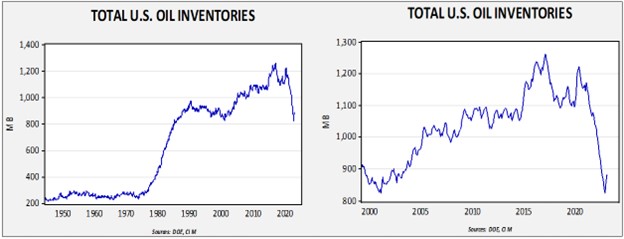
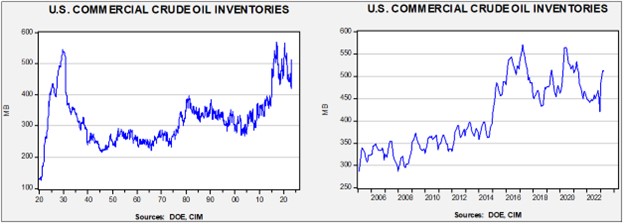
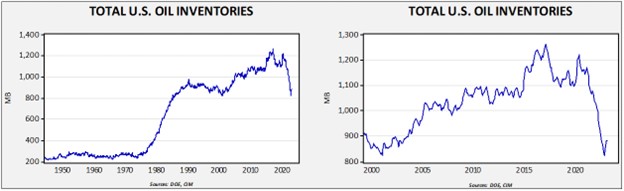
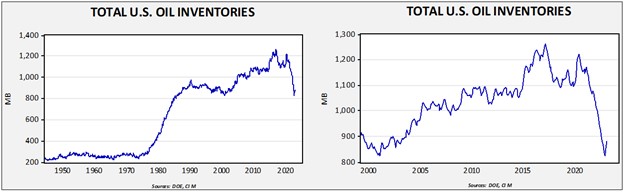
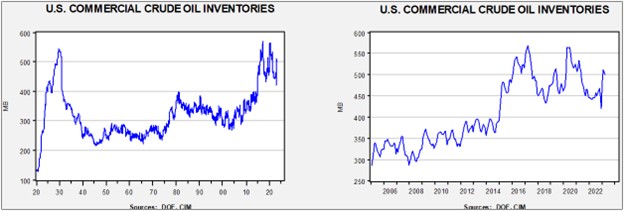
Since the SPR is being used, to some extent, as a buffer stock, we have constructed oil inventory charts incorporating both the SPR and commercial inventories. With another round of SPR sales set to happen, the combined storage data will again be important.
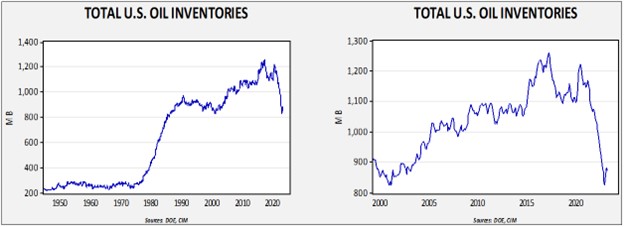
Total stockpiles peaked in 2017 and are now at levels last seen in 2001. Using total stocks since 2015, fair value is $94.11.
Market News:
- The big news this week was the decision by OPEC+ to cut production targets. Consensus going into the meeting had been for no change, and the announced cut, between 1.0 to 1.5 mbpd, was a shock that sent oil prices higher.
- This decision was a major disappointment for the Biden administration. As we have previously noted, presidential approval ratings are closely tied to gasoline prices and the rise in crude oil will likely lift these prices going into summer. We believe there is a broad difference of opinion on the “proper” price of oil. We suspect the West (obviously including Washington) would prefer a price around $60 per barrel, but with this action the oil-exporting countries are signaling a price above $80 per barrel. That scenario raises the odds of gasoline prices at $4 per gallon.
- Last week, we noted that the U.S. had delayed rebuilding the SPR (as regular readers know, we doubt the reserve will ever be refilled). According to reports, Riyadh did not take the lack of injections well.
- The U.S. wasn’t the only target for Riyadh. The Kingdom of Saudi Arabia (KSA) also wanted to punish bearish speculators.
- The modest rise in U.S. oil production has increased OPEC+ market power. This gives the cartel the ability to force prices higher.
- The Dallas FRB’s quarterly survey of the oil and gas industry in its district suggests production is stalling. The overall index of business activity has sharply declined from 30.3 to 2.1. Both oil and gas production are reporting declines.
- China has opened a new refinery that specializes in heavy oil, and the heightened demand is lifting prices.
- The state of California is preparing to regulate profit margins on gasoline. Similar measures in the 1970s led to shortages and gas lines. Although a similar outcome is possible in this instance as well, it does depend on how the price intervention is structured. It should be noted that the California gasoline market is isolated, so this action will probably have little effect outside of the state.
- LNG projects are facing increasing financing costs as interest rates rise. This factor combined with growing input costs for labor and construction materials may potentially slow development. The recent banking problems are creating financing problems as well. Less LNG capacity is a risk for Europe.
- The Brent oil price is the global benchmark. However, due to falling production among the components of the benchmark, S&P/Platts (SPGI, $340.01) announced it will begin to include U.S. Midlands crude oil in the benchmark. This decision could affect the Brent/WTI spread going forward.
- The Biden administration has approved a large Gulf of Mexico drilling auction. Although the administration initially was hostile to the oil and gas industry, its recent actions in Alaska and now in the Gulf suggest that the White House now realizes that oil and gas are necessary for economic growth and security.
- For the first time ever, China recently settled an LNG shipment in CNY instead of USD.
- It would stand to reason that the expansion of EVs should reduce oil consumption, but given the life of gasoline engines and the steady demand for petrochemicals, the “end of oil” will probably take longer than expected. However, EVs may play havoc on refining.
- Environmentalists have been using the courts to delay or kill pipeline projects, but it appears the Mountain Valley pipeline might finally be approved.
- Last week, we noted that oil flows from Kurdistan had been halted due to an arbitration decision that favored the Iraqi government. The halt has apparently also led to a delay in debt payments. It does appear that we are close to a resumption in oil exports from northern Iraq.
- Nigeria is boosting investment with the goal of increasing its oil reserves.
- Freeport LNG is finally back to full output after the facility suffered a major fire last summer.
- Sanctions on Russia have clearly disrupted global oil flows. We note that Russian diesel is moving to the Middle East. If this product gets reexported (as we expect), then the Middle East is essentially “laundering” this diesel for resale to Europe and other parts of the world.
Geopolitical News:
- Russia and India have agreed to an export arrangement where the former will boost supplies to the latter. The two countries will use the Dubai price for the transactions. Russia is steadily shifting its focus onto Asia.
- Japan bought Russian oil at a price above the cap; Tokyo has claimed an exemption. As prices rise due to the OPEC+ production target cuts, other nations may be forced to violate the cap as well.
- There are growing concerns that Russia is using substandard oil tankers to skirt sanctions, which will increase the odds of an accident.
- Ukraine’s energy minister is arguing that oil companies should pay to rebuild the country’s infrastructure because the war has boosted these companies’ profits.
- The KSA is joining the Shanghai Cooperation Organization, a China-led Eurasian security bloc. As we have noted recently, the KSA is rapidly aligning with China. The Saudis are also implementing a harder line on nations that receive their aid.
- There are reports that diplomats from the KSA and Iran will meet in China.
- When Venezuela was under sanctions, it relied on rogue traders to move oil. It seems that these brokers were the primary beneficiaries of the arrangement.
Alternative Energy/Policy News:
- Ford (F, $12.30) announced a joint venture with two other companies (one Chinese) to process nickel in Indonesia. Automakers are rapidly trying to secure supply chains for EVs.
- The Biden administration has issued its guidance on the Inflation Reduction Act subsidies. As often occurs with White House policies, there was an attempt to find a middle ground by giving enough leeway to help allies while still being restrictive enough to support U.S. investment. Such attempts tend to be unpopular, and we are already seeing opposition grow in Congress. Given China’s dominance in EV batteries and minerals, the rules are rather fuzzy on Chinese content and subsidies. We suspect the administration wants to support EV adoption, which means that China will be a part of that goal.
- China’s dominance of these key industries made it into Jamie Dimon’s CEO letter to shareholders.
- Western moves to reduce China’s dominance in rare earths have been noted in Beijing.
- European utilities are investigating whether they can use abandoned mines as “gravity batteries” to store energy from wind and solar and unwind the batteries when intermittent outages develop.
- One issue with EVs is what to do with the depleted batteries. We are seeing a growing effort to recycle batteries, not just from cars but from other sources as well.
- As we have noted recently, geothermal energy is also attracting attention.
- A recent study suggests that once the world engages in geoengineering, it may be trapped into maintaining it for a long period of time. Often, the process is seen as a short-term stopgap measure.
- Although EVs dominate the alternative fuel mandates, hydrogen is also a viable competitor.