by Bill O’Grady, Thomas Wash, and Patrick Fearon-Hernandez, CFA | PDF
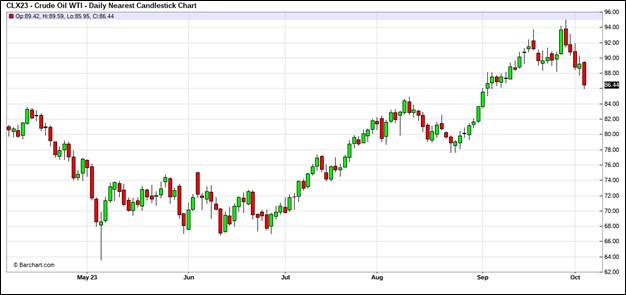
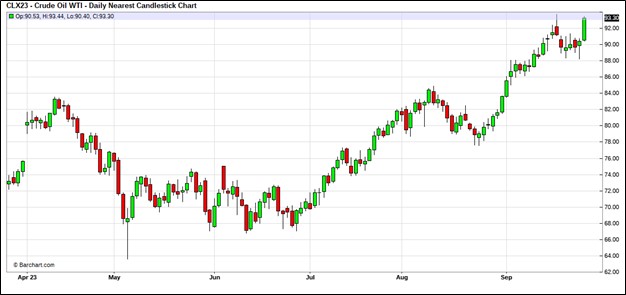
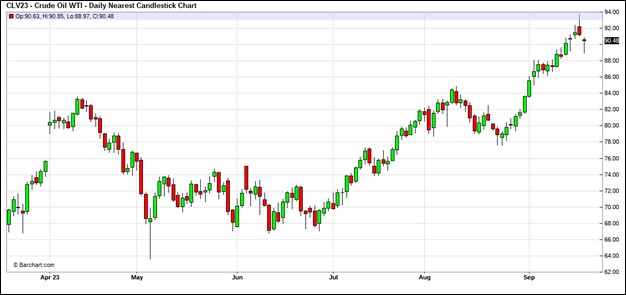
After making a run at $95 per barrel last week, prices are correcting; we suspect rising interest rates are increasing fears of an economic slowdown.
 (Source: Barchart.com)
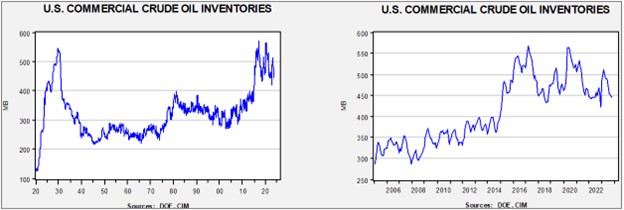
Commercial crude oil inventories fell 2.2 mb compared to forecasts of a 1.5 mb build. The SPR rose 0.3 mb, which puts the net draw at 1.9 mb (difference due to rounding).
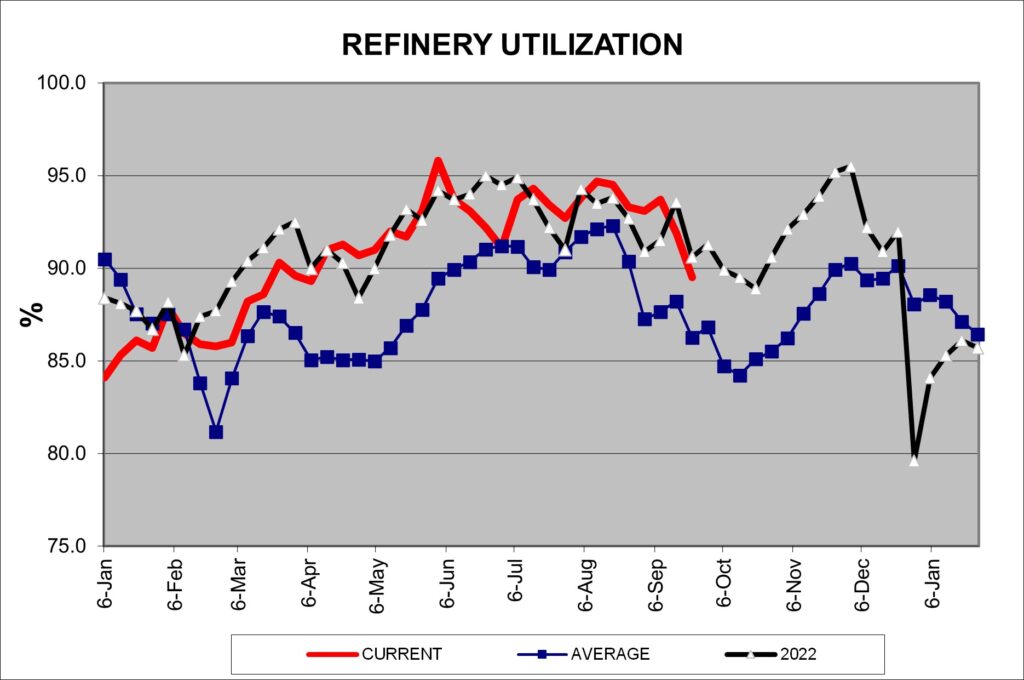
In the details, U.S. crude oil production was steady at 12.9 mbpd. Exports rose 0.9 mbpd, while imports fell 1.0 mbpd. Refining activity fell 2.2% to 87.3% of capacity. We are clearly heading into the autumn refinery maintenance period which should reduce demand.
 (Sources: DOE, CIM)
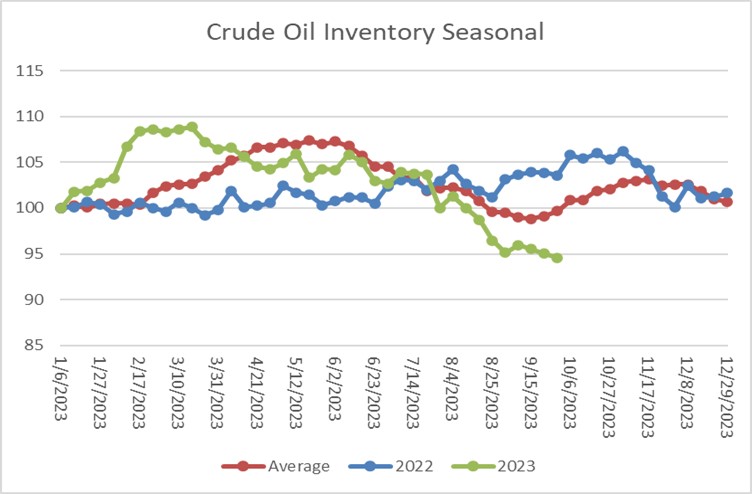
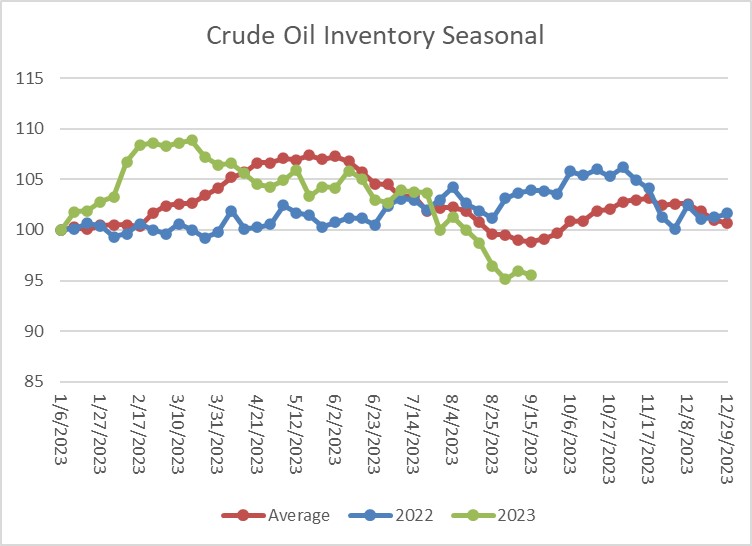
The above chart shows the seasonal pattern for crude oil inventories. Last week’s decline is contra seasonal and thus is bullish for crude oil prices. The continued drop in stockpiles while refinery maintenance is underway is profoundly bullish for oil prices.
 (Sources: DOE, CIM)
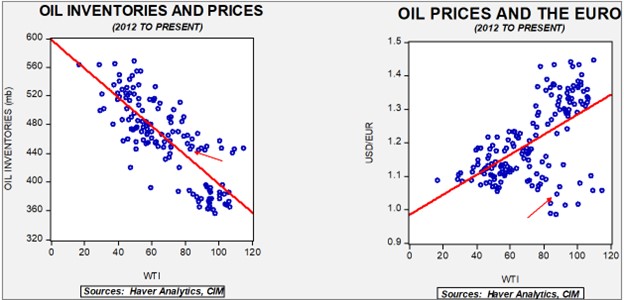
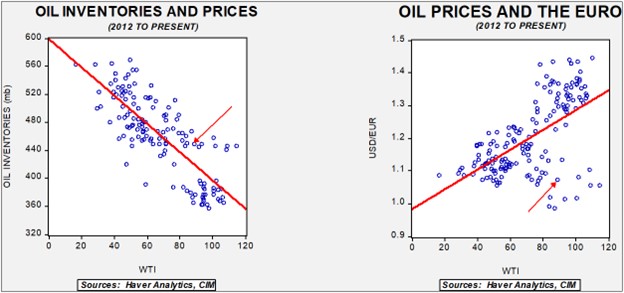
Fair value, using commercial inventories and the EUR for independent variables, yields a price of $76.55. The continued draw in commercial inventories is supportive for oil prices, but there is a geopolitical risk factor that is boosting prices as well.
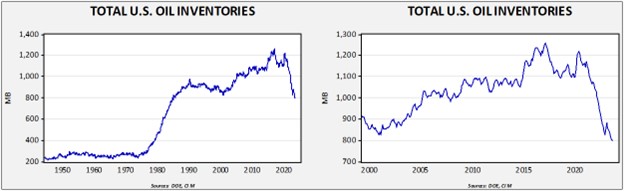
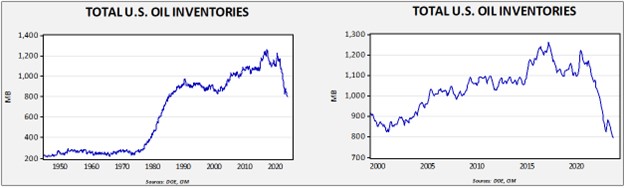
Since the SPR is being used, to some extent, as a buffer stock, we have constructed oil inventory charts incorporating both the SPR and commercial inventories.
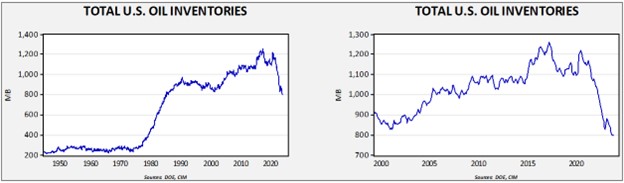
Total stockpiles peaked in 2017 and are now at levels last seen in late 1984. Using total stocks since 2015, fair value is $95.21.
Market News:
- Although there has been a clear trend by U.S. oil companies to focus more on profitability and less on production, surveys of oil executives suggest that they see oil demand continuing. So far, this hasn’t necessarily led to a major production boom. However, if these attitudes about demand begin to affect behavior, we could see renewed investment.
- At the same time, government hostility toward oil and gas continues. The Biden administration has reduced the number of offshore oil drilling leases to a record low. It should be noted that this stance could shift with a GOP White House, but the industry must consider the fact that power could shift back in later years. Policy uncertainty tends to dampen investment.
- Hedge funds are providing funding for environmental lawsuits. Although the funding, so far, has applied to mining firms, these lawsuits tend to raise the costs of production and reduce supply.
- U.S. product exports have hit a new record, and the same goes for U.S. exports of natural gas. As the global energy market restructures, the U.S. is benefiting.
- China is increasing its imports from the Arctic route.
Geopolitical News:
- With the spike in oil prices, the G-7 oil price cap has collapsed. This development is boosting Russian oil revenues. It should be noted that the vessels carrying Russian oil are not using Western insurance. So far, that hasn’t stopped their shipments. At the same time, Russian production of natural gas is falling as the loss of European markets and Western technology is undermining production.
- Turkey continues to play its role as a borderland nation. The number of Russian and Iranian firms locating to Turkey has surged since sanctions have been implemented in the wake of the war in Ukraine.
- Despite high oil prices, rising fiscal spending is expected to generate a deficit in the Kingdom of Saudi Arabia in 2024. It is unclear whether the Saudis will press for even higher prices to increase revenue. Obviously, this only works if the demand for Saudi oil is price inelastic.
- Saudi and Chinese energy ties are deepening. China is the world’s largest oil importer, and the Saudis are investing in China’s downstream industry. By doing so, it should increase China’s dependence on Saudi oil.
- There are reports that Iran has opened direct nuclear program talks with the U.S. Although getting to a deal would be difficult, the fact that Iran has moved on this issue could be significant.
- We also note that Tehran has been engaging in talks with various Gulf States.
- It’s looking increasingly likely that Robert Malley was involved in supporting Iranian diplomatic and intelligence efforts in Washington. As we note above, the Biden administration has been trying to resurrect the Iran nuclear deal; the revelation of a spy in the administration won’t help in this process.
Alternative Energy/Policy News:
- As we discussed last week, Ford (F, $12.54) has put a battery plant on hiatus due to uncertainty surrounding the facility’s profitability. Another issue looms regarding legislation on EV tax credits, which rests on how a “domestic” EV is defined. Foreign EVs or those with foreign components sourced from a “foreign entity of concern” will no longer be eligible for the credit. Ford is using Chinese-licensed battery technology, but the rest of the car is considered domestic. It is unclear whether Ford EVs will qualify if they use these batteries. Thus, the government’s decision on subsidies is a major issue for future domestically built EVs.
- Although the U.S. and increasingly the EU are using trade restrictions to support their domestic EV industries, there will be a cost to this protection in the form of higher prices. It’s a classic example of economic tradeoffs—if you want a rapid EV transformation, importing cars from China is probably the quickest path, but if you want to refashion the domestic auto industry, then consumers will pay more.
- EV makers outside of China are struggling to turn a profit. Tesla (TSLA, $245.26) has reported lower sales due, in part, to factory upgrades for next year’s models. The company has been trying to expand market share at the cost of margins, which has depressed revenue. Other firms are struggling as well.
- There is a near-constant debate as to whether EVs are better for the environment. Although they clearly reduce emissions, the mining of metals and the source of electricity can clearly affect the environmental situation. A new study suggests that even with assumptions that the electricity source is “dirty,” EVs are still a plus for the environment.
- Battery technology is evolving as research efforts increase. This research could change the types of metals needed for EV batteries over time.
- Emerging markets, in general, and China, in particular, are expanding nuclear power at a rapid pace. This development is bullish for uranium. In developed markets, permitting and other issues are undermining development.
- Nucor (NUE, $158.25) is looking to manufacture steel using fusion energy.
- As costs rise, growth in wind power is starting to stall.
- Global shipping firms are investigating the use of sails on vessels to reduce fuel consumption.
 (Source: Barchart.com)
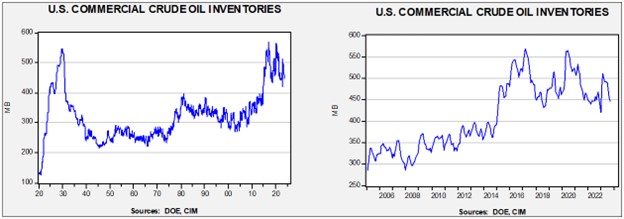
 (Sources: DOE, CIM)
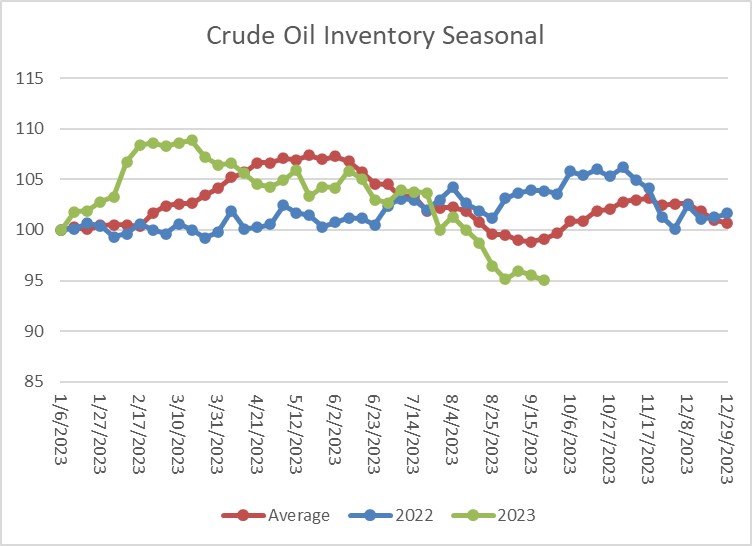 (Sources: DOE, CIM)
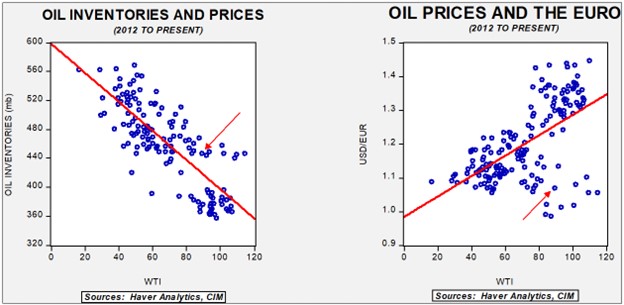
 (Source: Barchart.com)
 (Sources: DOE, CIM)