Asset Allocation Weekly (September 9, 2016)

by Asset Allocation Committee

Milton Friedman postulated that inflation expectations are established through a lifetime of experience.  To some extent, the issue of inflation expectations is similar to other market gauges in our lives, such as the level of financial markets, interest rates and home prices.  What we have experienced is considered as “normal” in our lives.  Behavioral economists call this anchoring; it’s where we believe levels “should be” based on our experience.

To get a feeling for this, we calculated the adult experience of inflation, looking at ages 16 to 94.

(Sources: Haver Analytics, CIM)

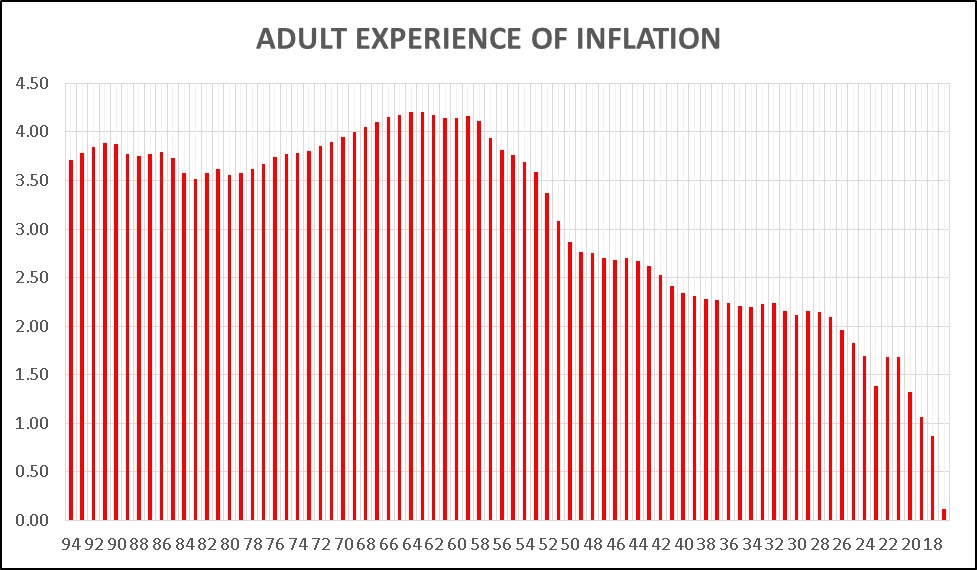
We have presented the “lifetime” experience of inflation on several occasions in the past.  However, on this chart, we omit the data related to the first 16 years of an individual’s life on the assumption that children are less aware of inflation than adults.  The difference is interesting.  Essentially, Americans with the highest experience of inflation are in their late 50s and early 60s.  By age 50, which is 34 years of inflation experience, the average inflation experience falls below 3%.  And, by age 26, the average falls under 2%.

It makes sense that current policymakers are concerned about inflation.  Vice Chairman Stanley Fischer is 73, while the youngest member of the FOMC, Neil Kashkari, is 43.[1]  The allocation of hawks and doves doesn’t seem to follow an age pattern.  In fact, the most important factor to determine policy stance is permanent voting members versus rotating voter members.  The NY FRB president and the five governors, all permanent voting members, are moderates to doves.  All the hawks are other regional FRB presidents who are rotating voters.  But, the fact that the “dots” chart mostly shows high future rate levels does suggest that nearly all the FOMC members expect some degree of normalization.  This is consistent with the adult inflation experience for the ages of the members.

The other factor this chart highlights is the expectations of investors.  Older investors are likely more concerned about inflation because they have experienced it.  As time wears on, the odds of inflation-inducing policy become lower because fears of it should decline.  However, we would not expect this to become an issue for at least another decade.  Thus, fears of rising long-term rates and duration risk are probably overestimated, for now.

View the PDF

________________________

[1] The current age breakdown for FOMC voting and alternate members is as follows: ages 40-44: 1 member, ages 45-49: 0 members, ages 50-54: 3 members, ages 55-59: 5 members, ages 60-64: 4 members, ages 65-69: 0 members, ages 70-74: 2 members.

Asset Allocation Weekly (September 2, 2016)

by Asset Allocation Committee

At the recent Kansas City FRB’s gathering at Jackson Hole, the tone from policymakers turned surprisingly hawkish.  Vice Chair Stanley Fischer was quoted as saying that two rates hikes are possible this year and the upcoming FOMC meeting in September could generate a rate hike if the payroll numbers are on trend.  Until those comments, the financial markets were mostly leaning toward no change in rates until 2017.

The best argument for rate increases is that the labor market is tightening.  The theoretical construct for policymakers is the Philips Curve, which postulates that tight labor markets boost wages and eventually inflation.  There have been periods in U.S. history when the Phillips Curve was a useful tool for policy.  Over time, it has become increasingly controversial as institutional changes, such as the decline of labor unions, deregulation and globalization, have changed the slope of the Phillips Curve.  Despite these changes, policymakers continue to use the Phillips Curve (best seen in the Taylor and Mankiw models, which attempt to set rates based on inflation and the level of slack in the economy) for lack of other alternatives.

The issue of slack is important, because the presence of available productive capacity would mean the FOMC would not need to tighten policy as much compared to a situation where capacity is constrained.  One of the great unknowns about the economy is whether the unemployment rate or the employment/population ratio better reflects the labor market.

This chart shows the two series, with the employment/population ratio on an inverted scale.  From 1980 into 2010, the two series closely tracked each other.  However, since the recession, the two have diverged.  The unemployment rate would suggest a labor market without much slack.  The employment/population ratio would indicate that there is ample slack in the economy; if the relationship had held, the unemployment rate would be closer to 8%.  If the divergence is structural, due to baby boom retirements along with geographic and skills misalignment, then the issue is probably not going to change suddenly and slack will continue to diminish.  If, on the other hand, discouraged workers can be lured from the ranks of the unemployed with modestly higher wages, then sizeable slack exists.  At 8% unemployment, the Fed should be easing.

Here is another way to look at the data.

This chart shows a time trend of total employment.  The data is annual from 1900 to 1947 and monthly thereafter.  We have regressed a time trend through the data.  Note that employment growth was above trend into the Great Depression and didn’t consistently return to trend until the mid-1970s.  Employment remained above trend into the 2008 Financial Crisis but has been depressed since.

It is quite possible that after a traumatic event, like the 1930s or the 2008 crisis, the labor market takes a long time to normalize.  Note that social norms capped employment during the 1950s and 1960s.  There were legal and social restrictions by race and gender that likely prevented a recovery above trend.  Racial and gender equality laws, coupled with social changes, led to steady employment growth from the early 1960s; by the late 1970s, employment had risen well above trend.

We suspect the current situation has more in common with the Great Depression than the early 1960s, but that doesn’t mean it’s a duplicate situation.  The demographics are different—the baby boomers are retiring.  But, we do suspect that there is a pool of workers that could be tapped if the economy grows quickly enough.  Thus, the FOMC probably has much more time than it thinks to raise rates.  Despite this opinion, the Fed will likely move at least once, if not twice, before year’s end even if a strong case can be made for remaining steady.  The key variable we will be watching is the dollar—if the Fed raises rates and the dollar appreciates strongly, look for the FOMC to back away from moving rates higher.  On the other hand, if the dollar does not react, there are probably more hikes to come.

View the PDF

Weekly Geopolitical Report – What’s Putin up to? (August 29, 2016)

by Bill O’Grady

Over the past few months, Russian President Vladimir Putin has been unusually active on multiple fronts.  He has expanded his military operations in the Middle East in support of Syrian President Assad, boosted troop strength on the Ukrainian border and conducted a major purge and restructuring of the Russian government.  He has also accused Ukraine of terrorist activity in Crimea, which he seized in 2014.

In this report, we will offer a short recap of Putin’s recent activities.  To create context for these moves, we will discuss how these actions fit into Putin’s hold on power.  As always, we will conclude with potential market ramifications.

View the full report

Asset Allocation Weekly (August 26, 2016)

by Asset Allocation Committee

As we noted last week, equity markets are trading at the upper end of the range defined by the relationship between the Federal Reserve’s balance sheet and equities.  To some extent, the level of the relationship is somewhat less important than what the expanded balance sheet signals, which is that monetary policy remains accommodative.  In our AAW from June 24, 2016, we discussed St. Louis FRB President Jim Bullard’s paper on monetary regimes.  Bullard is projecting only one rate hike of 25 bps over the next two years unless economic conditions change, a position for which he has taken some criticism. However, we note that a recent paper by San Francisco FRB President Williams suggests that the neutral real interest rate has probably declined to near zero, meaning that if inflation is 2%, the target rate for fed funds that would be neither stimulative nor restrictive would be 2% as well.  To stimulate growth, the policy rate would need to be below 2%, suggesting little room to raise rates.  Although various U.S. central bank officials keep suggesting that every meeting is “live,” meaning a rate change could occur, the reality is that there appears to be a distinct intellectual trend toward the idea that the slow growth the economy is facing is more than just temporary headwinds.  In fact, Ben Bernanke recently blogged that the FOMC does appear to be shifting its perspective on the economy in a dovish direction.[1]

There is increasing attention on fiscal policy.  We note that both presidential candidates are calling for increases in infrastructure spending.  Our review of economic literature shows little consensus on the multiplier effect of government investment spending; there is no doubt, however, that the state of U.S. roads would be improved by repairs.  On the other hand, it isn’t obvious what sort of investment the government could make that would equate to the building of the interstate highway system or the dam building of the Great Depression.  If the Federal Reserve and the government coordinated stimulus through direct funding (“helicopter money”), the effect could be substantial, although its most important impact might be in currency depreciation.[2]

What this all means is that the financial markets, which have been projecting significantly less tightening than the “dots” chart has been signaling, are probably correct.  Interest rates will likely remain low and the terminal rate will probably come nowhere close to what we saw prior to the 2008 Financial Crisis.  This situation puts policymakers in a difficult position.  In both the U.S. and in Europe, there is great reluctance for fiscal expansion.  Most of the policymakers came of age during the high inflation years of the 1970s and early 1980s and are quite skeptical of government spending.  If a recession were to develop, the Federal Reserve would find itself at the zero bound rather quickly.  At that point, all monetary policy could offer is either QE4 or negative nominal rates.  The former might help equities but foreign experience with negative nominal rates has been quite disappointing.

So far, policymakers in the major economies have avoided competitive currency depreciation.  However, a move to such policies will become increasingly tempting as other tools fail to deliver growth.  This was the pattern seen during the 1930s.

This chart shows the deviation from the Mankiw Rule model, using core CPI and the unemployment rate along with the dollar index.  In the past, the FOMC paid little attention to the dollar in setting policy.  However, commentary from the Fed minutes suggests “international” concerns are being discussed at length.  We suspect that the dollar (using the JPM effective exchange rate as a proxy) would need to fall before the FOMC would consider raising rates.

This means that, despite protests to the contrary, the FOMC probably won’t raise rates for a while unless (a) the dollar weakens, (b) core inflation unexpectedly rises, or (c) unemployment falls further.  The risk of a rate hike is that it would push the dollar higher and tighten policy more than the FOMC would want.  This puts the Fed in something of a quandary.  They would like to have a higher rate in place, if for nothing more than to give them room to lower rates into the next downturn.  However, due to the uncertainty surrounding the reaction of the dollar, we expect monetary policy to remain on hold into 2017, assuming the three conditions noted at the top of this paragraph don’t arise.  If that is the case, equity values should remain supported.

View the PDF

_______________________

[1] https://www.brookings.edu/blog/ben-bernanke/2016/08/08/the-feds-shifting-perspective-on-the-economy-and-its-implications-for-monetary-policy/

[2] See WGR: The Geopolitics of Helicopter Money, Part I (5/2/16), Part II (5/9/16), and Part III (5/16/16).

Weekly Geopolitical Report – Thinking about Thinking: Part II (August 22, 2016)

by Bill O’Grady

Last week, we examined the three types of statements deemed true.  This week we will discuss the appropriate assignment of these statements and the dangers in their inappropriate use.  We will conclude with how investors can use this analysis.  As an aside, these last two WGRs have examined a broad topic outside the usual scope of this report, some “summertime reading,” if you will.  Next week, we will return to our usual analysis.

View the full report

Asset Allocation Weekly (August 19, 2016)

by Asset Allocation Committee

U.S. equity markets are showing impressive strength.

(Source: Bloomberg)

This chart shows the S&P 500 Index along with the 200-day moving average.  The white horizontal line shows recent highs; note that the S&P 500 has recently moved above these highs.  Technically, this is a “breakout” and suggests the market will likely move higher.

Still, this rally has occurred with slowing earnings growth.  Although S&P 500 operating earnings are coming in better than expected, they are still down about 2% from last year.[1]  Rising equity prices with falling earnings implies a rising P/E (confirmed below).  Without an increase in future earnings, equity markets are becoming increasingly pricey.

One of our more reliable indicators during this cyclical bull market has been the relationship between the S&P 500 and the Federal Reserve’s balance sheet.

This chart shows the size of the Fed’s balance sheet along with the S&P 500 Index.  Periods of quantitative easing (QE) are shown in gray.  Note that since the recovery began in 2009, equity values tended to rise during and in anticipation of a balance sheet expansion and move sideways during periods where the balance sheet remained steady.

This chart shows a regression of the relationship.

This chart shows the fair value for the S&P 500, based on the Fed’s balance sheet, along with standard error bands.  Over the past seven years, the upper standard error band has been a signal that markets are overvalued; dips to the lower standard error bank suggest a more favorably valued equity market.

We are currently well above one standard error which raises three possibilities.  The first is that equities are overvalued and primed for a pullback (fair value is 2,025 and the lower standard error line is 1,947).   The second is that the relationship was always spurious and the recent rise is uncorrelated.  The third is that there are other variables that are now more important which can justify the recent rise.  We disagree with the second possibility because the relationship between the Fed’s balance sheet and the Shiller P/E is also quite strong, suggesting that unconventional monetary policy boosted investor sentiment and supported a higher P/E.

This chart shows the relationship of P/E ratios and the balance sheet; note that the P/E rises sharply during periods of QE.  We believe this relationship offers support for the notion that unconventional monetary policy lifted investor sentiment and P/E ratios remained steady in its absence.

However, the third possibility does remain—there are new factors that are boosting equities.  We note the equity markets rallied on Friday’s strong employment data.  However, the historical record on the relationship of employment and equities is mixed.  Clearly, an improving labor market signals that a recession isn’t imminent.  But, when the labor market becomes very strong, it often triggers tighter monetary policy.  At present, the financial markets do not expect tighter policy until December at the earliest.  Thus, at least in the short run, the equity markets may be in a “sweet spot” where better growth may lift top line revenues without triggering tighter policy.  However, these favorable conditions may not last.  Therefore, our base case is that equities are fully valued but a correction may not be imminent.

At the same time, equities are not cheap and could be vulnerable to exogenous issues, such as the U.S. presidential elections and terrorism.  As a result, we would not be surprised to see a modest correction in the coming months but, as long as a recession is avoided (which we expect), a major pullback isn’t likely.

View the PDF

_______________________

[1] Using Thompson-Reuters’ calculation of operating earnings.

Weekly Geopolitical Report – Thinking about Thinking: Part I (August 15, 2016)

by Bill O’Grady

We are in the “dog days” of summer.  The world is in turmoil.  The U.S. presidential elections offer us a stark choice between a traditional establishment candidate and a populist alternative.  Populism is on the rise in Europe, exhibited by the Brexit vote.  Lone wolf terrorist attacks seem to occur with frightening regularity.  China is threatening the U.S.-dominated maritime order of the past seven decades.

Perhaps most disconcerting is that there seems to be a steady dissonance of viewpoints.  I often hear comments like, “how can a person think like that?”  The internet, for all its power, has been creating virtual thought islands.  Essentially, people can tailor their reading and information sources to fit their biases and rarely confront other viewpoints.  And, when confronted with other viewpoints, people seem to be at a loss on how to hold a civil discussion on these differences or have the tools to understand positions that vary from their own.

Last spring, my youngest son took his first philosophy course.  He was exposed to the classic thinkers in the Western canon, including Plato, Descartes, Kant, Nietzsche and others.  We had long discussions about these thinkers, harkening me back to my Jesuit philosophical training of more than 30 years ago.  Our talks forced me to revisit these philosophic issues with three decades of additional experiences.  As I thought about these issues, I was absorbed by the relevance of these philosophic questions to our current economic, social, political and geopolitical conditions.

In this week’s report, we will take a detour from our usual analysis of specific global events to a broader analysis of knowledge.  Part 1 of this report will offer a short course on the basics of knowledge, focusing on an examination of the three types of knowledge statements.  We will then discuss the strengths and weaknesses of all three and how philosophers have tried to resolve the dilemmas that they posed.  Next week, in Part II, we will discuss how one uses this information, concentrating on the idea that it is important to match appropriate ways of knowing to the areas we are examining.

These reports will be a bit more personal and academic than most, but given the divergence of opinion in the world now, I believe this analysis can be useful to investors approaching information and positions that differ from their own.

View the full report

Asset Allocation Weekly (August 12, 2016)

by Asset Allocation Committee

We originally published the comments below in our Daily Comment on July 27.  However, we have received a number of questions on the widening of the TED spread and the rise in LIBOR to warrant updating the report for this week’s Asset Allocation Weekly.

There has been some curious behavior in the LIBOR markets recently.  Although expectations of Fed tightening are benign, LIBOR rates have been ticking up.

(Source: Bloomberg)

This chart shows three-month USD LIBOR.  Note that over the past month, the rate has moved up around nearly 20 bps.  Usually, such moves occur for one of the following reasons: (a) the Fed is raising rates, or (b) there is a systematic financial system problem developing, leading investors to flee the LIBOR market for sovereigns.  The second case is one of the reasons for monitoring the TED (T-bills vs. Eurodollar) spreads.

The TED spread has been rising and is near levels seen during the last Eurozone crisis.  Although this increase warrants watching, putting the recent rise in context does suggest that this move, thus far, isn’t a signal of a major problem brewing.

(Source: Bloomberg)

Just compare the above chart to the long-term TED.

(Source: Bloomberg)

Note how LIBOR rates spiked in 2008 and were “spikey” from mid-2007 through 2008.  That is a more classic example of the flight to safety element of the TED spread.  We are not seeing that now.

So, why the rise in rates?  It’s entirely due to regulations on money market funds (MMFs).  On October 14, prime money market funds will see their statutory maximum weighted average maturity fall from 90 to 60 days.  In addition, institutional MMFs will be forced to institute a floating NAV and can put up “gates” to slow withdrawals during crises.  We are already seeing the impact.

Assets in prime MMFs have declined about $500 bn and government funds have risen by about the same amount since December.  Prime MMFs now represent 35% of total MMFs, down from 53% last October.  The total assets in MMFs are about the same but the allocation has shifted from prime to government MMFs, which don’t face the same restrictions.  We expect further shifts as investors begin to realize that a prime MMF isn’t “cash.”

Here are some potential market effects:

The dollar could rise.  The rise in USD LIBOR hasn’t been matched by a similar rise in EUR LIBOR.  All else held equal, the higher yield should support dollar buying.

Commercial paper markets will be adversely affected.  Prime MMFs buy commercial paper.  As funds shift to government funds, the money available to buy commercial paper will decline, boosting funding costs to commercial paper issuers.

A secular change in the TED spread is likely.  In general, investors discount the odds of a problem in the financial markets when they buy LIBOR-based paper.  With the rules on prime MMFs changing, the risk calculation will change, which should permanently shift the spread wider.  It is important for investors to realize that the TED isn’t necessarily signaling a financial system problem during this reset.

The rise in LIBOR and the dollar could be a bearish factor for commodities.  If the regulatory change acts as a de facto monetary policy tightening and isn’t offset by the Fed, we may see some weakness develop in commodities.  The primary driver of this will be the dollar.

Overall, investors will need to consult with their MMF providers and their financial advisors to determine which MMF is appropriate for them.  The issue really is what the function of the MMF is in the portfolio; if it is truly cash, then the government funds might be preferred.  If it is for yield, then one needs to realize that a prime MMF will likely lose its cash-like characteristics during financial crises and one could find that there will be a delay in tapping a prime MMF if financial conditions deteriorate.  Although retail investors in prime MMFs should not “break the buck,” that may not provide much comfort as the potential restrictions on withdrawals remain in place.

View the PDF

Weekly Geopolitical Report – The Turkish Coup, Part III (August 8, 2016)

by Bill O’Grady

Last week, we recounted the events of Turkey’s recent coup and some of our thoughts about why the coup failed and who was behind it.  This week we will discuss the unfolding purge, including the role of Fethullah Gulen, and discuss the impact on regional geopolitics.  In this week’s report, we will examine the market effects of the coup and its aftermath.

The Purge
At first blush, this coup seemed to be the work of Kemalists in the military.  For example, the coup plotters forced a Turkish state media broadcaster to read a prepared statement which accused the government of “eroding democratic and secular rule of law,” as they declared martial law.  This is fairly standard coup behavior.  However, nearly from the start, President Erdogan accused Gulen of fomenting the coup.  We will examine this issue below.

The scope of those affected by the purge is rather large.

Although a bit more than 15k of military and police have been removed from their posts (and in many cases, under arrest), the education sector has been hit hard, with nearly 28k being removed from their jobs, including 21k teachers who have had their licenses revoked and nearly 1,600 university deans who have been forced to resign.  The purge continues to widen and it appears that the Gulenists are the primary target.  For example, Gulenists are deeply imbedded in education which explains why Erdogan has targeted academia.

In addition to the purge, Erdogan has implemented a state of emergency that will allow him to rule by decree.  We would not be surprised to see this decree extended.  Erdogan is not going to let this crisis pass without extracting the most value he can for it.  We suspect Erdogan intends to reshape Turkey’s government to resolve which Islamic group is going to dominate the country’s future.

View the full report