Asset Allocation Weekly (July 21, 2017)

by Asset Allocation Committee

In the past few years, we have generally avoided allocations to non-U.S. markets for our asset allocation portfolios due to two primary concerns.  First, the dollar was rising as a result of an improving U.S. economy and policy divergences between the U.S. and the rest of the world.  The Federal Reserve was raising rates and tapering its balance sheet while the majority of the other nations were still adding monetary stimulus.  Second, we have had secular concerns about the stability and attractiveness of foreign investing in a world where the U.S. is seemingly reducing its hegemonic role.

This quarter we have added foreign allocations into our portfolios.  The primary reason is that we believe the dollar’s bull market is probably coming to a close.  On a relative valuation basis, the dollar has become rather expensive.

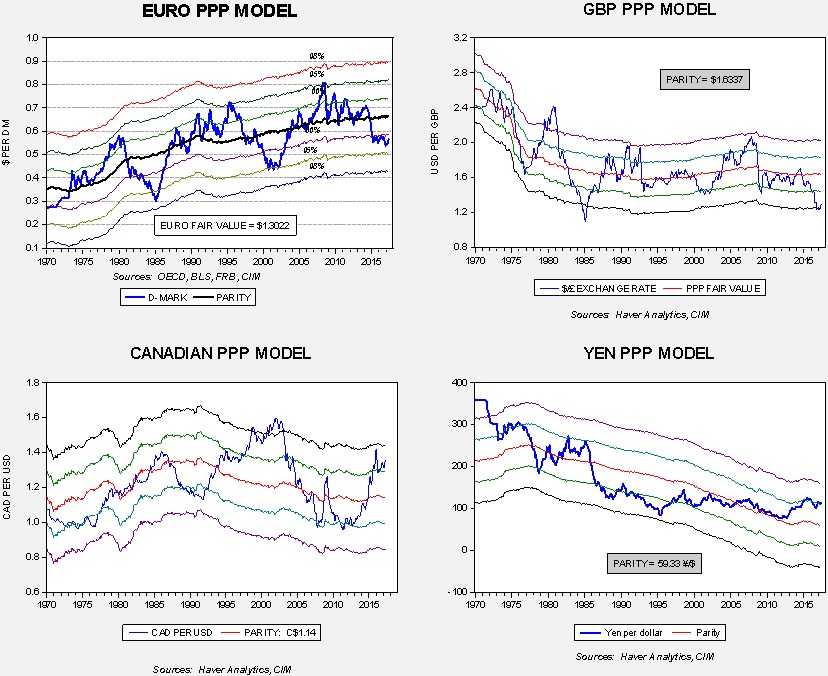
This chart shows four purchasing power parity models for the euro, yen, British pound and Canadian dollar.  In all four cases, the dollar is trading “rich” by more than one standard error, and in two cases, nearly two standard errors from parity.  Purchasing power parity uses relative inflation to value currencies.  As the models show, currencies are rarely at parity.   Although purchasing power parity is the oldest way to value currencies, it isn’t the most accurate.  However, it tends to be useful at extremes, and exchange rates tend to move around the parity measure.  In other words, parity is something of an anchor around which the actual exchange rate vacillates.

History also suggests that exchange rates can diverge from parity for long periods of time, which usually means that a catalyst is required to move currencies from extremes of under-and over-valuation.  For example, in the above euro and pound models, the deep undervaluation in the mid-1980s ended with the Plaza Accord.  Yen overvaluation in the early 1990s was ended by the Halifax Accord.  Changes in policy or governments can trigger an end to valuation extremes as well.

This leads us to two additional reasons for this repositioning.  We believe there are two catalysts which will pressure the dollar in the coming quarters.  First, the Federal Reserve appears to be hedging on future tightening.  Although the dots charts still indicate rising rates, a number of FOMC members have raised worries about raising rates while inflation remains depressed.  Chair Yellen appears to be offering a trade to the hawks on the committee; instead of raising rates, balance sheet reductions can act as policy tightening.  It is possible reducing the balance sheet will be dollar bullish.  However, that isn’t supported by the data.

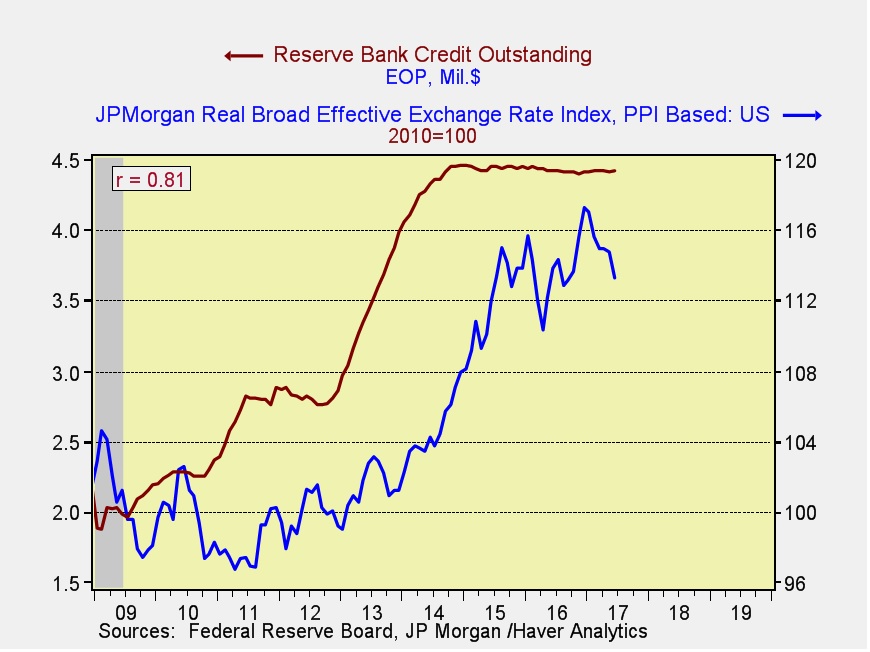
Although economic theory would suggest that boosting the size of the balance sheet should depreciate a currency, all else held equal, the pattern on the above chart developed likely because QE raised hopes of stronger growth.  Our expectation is that reducing the balance sheet probably won’t matter, but if the pattern is consistent, balance sheet reduction may actually be dollar-bearish.  So, we expect the anticipated monetary policy trade of fewer rate hikes for balance sheet shrinkage to be bearish for the dollar.

The second catalyst is policy disappointment from the Trump administration.  Earlier this year, we were worried about the dollar’s overvaluation. And, proposed tax cuts and fiscal expansion from the Trump administration would have been dollar bullish, even at lofty valuations.  However, the likelihood of major policy actions have declined and each month that passes without a policy adjustment means that political capital is being lost and it becomes less likely anything will pass.  As disappointment grows, we would expect the dollar to retreat.

Although we retain our secular concerns about the stability and attractiveness of foreign investing in a world where the U.S. is seemingly reducing its hegemonic role, these concerns are overshadowed by the changing dynamics of monetary stimulus. Essentially, the near-term effects of policy and the exchange rate outweigh our secular concerns.

Finally, the issue of recent performance needs to be addressed.  Both emerging and foreign developed equity markets have performed very well this year and there is a concern that we may be shifting too late into these asset classes.  Although possible, if our expectations of a weaker dollar are accurate, history would suggest a longer period of foreign outperformance.

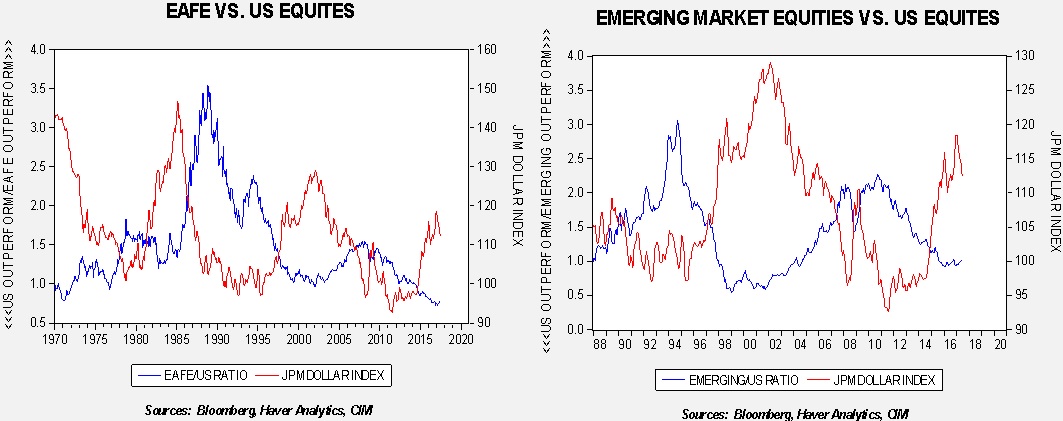
The red line on both charts shows the JP Morgan real dollar index. The blue line on the left chart is the ratio of dollar-denominated EAFE and the S&P; on the right chart, it’s the dollar-denominated ratio of emerging markets and the S&P.  Both have been rebased to their respective start periods.  On both charts, a lower ratio indicates U.S. equity outperformance relative to foreign markets; a rising ratio shows the opposite.  In both cases, periods of dollar strength coincide with domestic outperformance.  Thus, even with good foreign performance this year, a weaker dollar may result in a longer period of foreign outperformance.

View the PDF

Asset Allocation Quarterly (Third Quarter 2017)

  • Economic data remain supportive and the inflation outlook is currently benign.
  • Though the economic expansion is elongated, we do not anticipate a near-term recession.
  • Fed policy is expected to tighten in terms of rising short-term rates and the reduction in the size of the Fed’s balance sheet.
  • We expect the Fed to commence the reduction of its $4.5 trillion balance sheet with a $10 billion monthly run-off by the end of this year.
  • Expectations for a softer U.S. dollar combined with attractive valuations overseas have encouraged us to include non-U.S developed and emerging market equity exposure, the former with a tilt toward Europe.
  • Overall allocations to bonds are intact, though with a heavier presence in intermediate-term bonds. Speculative grade bonds remain supportive for income objectives.
  • Our growth/value even weight of 50/50 remains unchanged from last quarter.

ECONOMIC VIEWPOINTS

The themes present at the start of the year continue unabated, with inflation and unemployment at low levels and both consumer and business sentiment remaining elevated. Although the U.S. is now 97 months into an expansion, closing in on the second longest on record, there are pockets of softness. For example, consumption is slower than historical experience as measured by PCE, investment is muted and capacity utilization is running at 75%, as evidenced in the accompanying chart. In addition, government spending, inclusive of the contributions of states and municipalities, is very low as a percentage of real (inflation-adjusted) GDP. These measures all factor into our belief that a recession is not on the near-term horizon and the economy holds solid potential for continued expansion despite its current length.

Although members of the FOMC are signaling further monetary tightening through an increase in the fed funds rate as well as a reduction in the reinvestment of balance sheet proceeds, markets anticipate that the Fed won’t be as hawkish as the current trajectory implies. For example, the Fed’s much-publicized dot plots indicate a fed funds rate of 2.25% by this time next year, while the markets, as measured by LIBOR, provide an implied rate of 1.61%, as exhibited in the below chart.

The Fed appears mollified by the improvement in unemployment figures and the lack of deflationary pressure, providing the latitude to move rates higher and commence some withdrawal of stimulus by reducing the reinvestment of proceeds from its $4.5 trillion balance sheet. However, uncertainties abound regarding not only the path of balance sheet reduction and its concomitant effect on the U.S. banking system and the availability of credit, but also the complexion of the Fed’s Board of Governors with its three vacancies and the prospect of a new Fed Chair. As mentioned in our last quarter’s report, it remains unclear as to whether the Trump administration will be appointing members who are hawkish or populist. While the issues surrounding the complexion of the Fed and its amount of monetary accommodation remain unresolved, the pace of tightening thus far has been appropriate and there are no indications that they have raised the prospect of thrusting the economy into a recession

Our view is that the issues that create headlines, such as current Congressional activity surrounding healthcare and the potential modifications to the tax code, are more distracting than influential at this juncture. Until, or unless, legislation is advanced or the Fed missteps, we retain the perspective that equity markets carry fair value on the traditional metric of Price/Earnings with a benign level of inflation. In addition, the intermediate and long portions of the bond market provide positive inflation-adjusted returns.  The greater near-term investment significance for U.S.-based investors include expectations that nascent U.S. dollar weakness relative to foreign currencies will continue, particularly versus the euro and the basket of emerging market currencies. The Trump administration’s encouragement of a weaker dollar is a marked departure from the policies of prior administrations and consistent with our belief that U.S. economic hegemony is waning.

STOCK MARKET OUTLOOK

The economic landscape has proven favorable for U.S. equities and we find that the current economic environment remains healthy. However, signals of policy tightening from the Fed advise a degree of caution and bear continued scrutiny. In addition, recent readings of small business optimism exhibit softness compared to earlier in the year. Nevertheless, factors that are typical of elevated downside risk are noticeably absent, as shown on the accompanying chart. This graph depicts the monthly average for the S&P 500 Index versus our conflation of initial jobless claims, the Conference Board’s Consumer Confidence data and the CRB commodity index using adjusted standardized data.1 Though this shows that the U.S. economy is well advanced in the economic cycle, near-term concerns are not evident. Valuations have certainly advanced over the past year, but we believe that they can be persistent and are not untenable at this stage. Large cap, mid-cap and small cap equities have all enjoyed solid returns and traditional valuation metrics of Price/Earnings, Price/Book, and Price/Cash Flow have advanced accordingly. In contrast, non-U.S. equities, while enjoying positive returns this year, are generally priced below U.S. counterparts on traditional valuation metrics. Furthermore, given our views of a softer U.S. dollar environment, we are shifting some U.S. exposure to foreign equities. Much of this shift is being pulled from U.S. mid-cap exposure as pricing is more elevated and therefore expected returns are more muted. Among foreign domiciles, we tilt toward Europe in developed countries and also introduce exposure to emerging markets for more growth-oriented strategies.

1 For a full description of the standardization of data, please refer to our Asset Allocation Weekly, 6/30/17.

Among U.S. large cap sectors, we favor healthcare and industrials and continue to underweight telecom and consumer staples. We reduce our previous overweight of financials and utilities to even-weight. REITs continue to be positioned in two strategies for their diversification benefits and potential for modest appreciation. Our growth/value style bias remains evenly balanced at 50/50, reflecting our views toward sectors and industries.

BOND MARKET OUTLOOK

The Treasury yield curve has flattened over the course of this year, reflecting tighter monetary conditions at the Fed. Though the duration of the bond exposure in the more income-oriented strategies remains consistent with our prior exposures, it is now attained through a greater allocation to the intermediate segment as opposed to the former bar-belled overweights to short- and long-term bonds.

The exposure to long-term bonds has proven beneficial, but the current outlook has encouraged a more cautious positioning for the months ahead, especially as the Fed begins to engage in some normalization of its balance sheet. We maintain our favor to investment grade corporate bonds over Treasuries and mortgage-backed securities as the spreads continue to be attractive and supported. We also retain exposure to speculative grade bonds given our outlook for contained default and recovery rates.

OTHER MARKETS

Despite a more favorable outlook for commodities, we have concluded that introducing exposure at this time may be premature. In an environment of faster economic growth and/or a surge in inflation expectations, commodities would prove helpful to a diversified portfolio. However, we harbor no expectations of either environment over the near term. Accordingly, there remain no allocations to commodities in the strategies.

View the complete PDF

Quarterly Energy Comment (July 18, 2017)

by Bill O’Grady

The Market
Oil prices peaked in March around $55 per barrel.  There have been a series of lower highs and lower lows, as shown by the lines on the chart.

(Source: Barchart.com)

This obvious downtrend has led to a general bearish tone to the market.  We don’t necessarily share that level of pessimism; as we will show below, dollar weakness and falling inventories are supportive for oil prices.  On the other hand, there are legitimate concerns that Saudis may reverse production restrictions after next year’s initial public offering for Saudi Aramco.

View the complete PDF

Weekly Geopolitical Report – A Productivity Boom: A Response to Robert Gordon, Part I (July 17, 2017)

by Bill O’Grady

Robert J. Gordon is a well-known economist and a professor at Northwestern University. A member of the National Bureau of Economic Research, his most notable work is in the area of productivity.  His 2016 book[1] argued that the best years of American productivity are behind us—highlighted by the introduction of steam power to industry, the mechanization and biological revolution in agriculture, the electrification of the country, the communications revolution of telegraph, telephone and television, and the transportation revolution of automobiles and airplanes.  He suggests that the technology revolution would never be able to replicate the growth spawned from these events.  Sadly, ecological damage, rapidly aging populations and the peaking of educational attainment mean that economic stagnation would be the order of the day for the Developed World economies.

We examined the geopolitical ramifications of Gordon’s position in an earlier report.[2]  Stagnation could easily lead to geopolitical problems.  For example, industrialization and the spread of democracy occurred at nearly the same time; it is generally believed that democracy supports economic development but it is possible the direction of causality occurs in the opposite direction.  If so, it may mean that a certain degree of economic growth is necessary to maintain democracy. If growth stagnates, it may become difficult to maintain societal order.  In addition, it is intuitive that an expanding economy makes distribution issues easier; it’s a lot more difficult to determine distribution if it appears to be a zero-sum environment.  In such a world, one group improves only at the expense of others.  That scenario creates conditions of conflict.

Michael Mandel and Bret Swanson recently published a paper[3] rebutting Gordon’s position, suggesting that productivity is poised to expand and support stronger economic growth.  In Part I of this report, we will examine the productivity issue, discuss Mandel and Swanson’s analysis of the situation, and focus on their specific division of industries.  Next week, we will look at six sectors of the economy that appear poised to digitize and how that could change the economy.  We will also discuss the hurdles to Mandel and Swanson’s projection.  As always, we will conclude with market ramifications.

View the full report


[1] Gordon, R. (2016). The Rise and Fall of American Growth: The U.S. Standard of Living Since the Civil War. Princeton, NJ: Princeton University Press.

[2] See WGR, The Gordon Dilemma, 8/12/13.

[3]http://www.techceocouncil.org/clientuploads/reports/TCC%20Productivity%20Boom%20FINAL.pdf

Asset Allocation Weekly (July 14, 2017)

by Asset Allocation Committee

One of the mysteries of this expansion has been the slow pace of wage growth.  Despite the plethora of evidence that labor markets are tight, including hires-to-openings ratio below one, low unemployment, low initial claims and a low unemployment rate, wage growth has remained stunted.   The chart below is one we have used often in the past; it suggests with unemployment at current levels, previous episodes would have brought wage growth closer to 4% compared to the current growth of 2.3%.

One of our thoughts was that, perhaps, the national unemployment rate was masking pockets of high regional unemployment.  In other words, if there was a wide dispersion of labor market activity, the weak regions of the country could be holding down wage growth.

To test this, we looked at the level of state unemployment relative to the Congressional Budget Office’s calculation of the natural rate of unemployment.[1]  We calculated the number of states with unemployment below the natural rate.  What we found is consistent with the above graph.  In other words, it doesn’t appear that regional issues were holding down wages.

Since 1987, average wage growth is 2.98%; in the periods where the percentage of state unemployment rates below the natural rate exceeds 65%, wage growth was 3.89%.  The current combination is unusually low.

However, as part of this research, we did find another interesting factor.  There has been speculation that low inflation rates may be affecting wage growth.  To test that thesis, we subtracted annual wage growth for non-supervisory workers against the three-year average of the yearly change in CPI.  Our reason for using the average is that businesses and workers tend to react to the recent trend in inflation and not necessarily the most current number.  We found results that were more consistent with this theory.

Over the same time frame, real wage growth was 0.26%, but when the percentage of states with unemployment below the natural rate exceeds 65%, real wage growth is 1.04%.  As the chart shows, real wage growth is consistent with tight labor markets as defined by the percentage of state unemployment rates below the national natural rate.

So, the puzzle of why wage growth is slow may simply be due to low inflation.  The three-year average of inflation may act as an anchor in the wage bargaining process and wage growth will probably remain stalled without rising inflation.   A cursory glance at the annual rate of inflation relative to the three-year average suggests that the average rate will likely remain stable for the foreseeable future.  Thus, wage growth will probably remain stable, increasing the risk that tightening monetary policy will have an adverse impact on the economy and markets.  Of course, the wage issue is a matter of debate within the FOMC which could mean that the path of tightening is slow and measured, more in line with the financial market’s expectations surrounding future policy.

View the PDF


[1] This rate is sometimes called the Non-Accelerating Inflation Rate of Unemployment, or NAIRU.  The idea is to determine what level of unemployment is the lowest rate attainable before higher inflation is triggered.

Weekly Geopolitical Report – The Mid-Year Geopolitical Outlook (July 10, 2017)

by Bill O’Grady

As is our custom, we update our geopolitical outlook for the remainder of the year as the first half comes to a close.  This report is less a series of predictions as it is a list of potential geopolitical issues that we believe will dominate the international landscape for the rest of the year.  It is not designed to be exhaustive; instead, it focuses on the “big picture” conditions that we believe will affect policy and markets going forward.  They are listed in order of importance.

Issue #1: The Political Fragmentation of the West

Issue #2: North Korea

Issue #3: An Unsettled Middle East

Issue #4: A Resurgent Russia

Issue #5: China’s Financial Situation

View the full report

Asset Allocation Weekly (July 7, 2017)

by Asset Allocation Committee

One of the relationships we persistently monitor is the expectations of 10-year Treasury yields compared to the actual level of yields.  To do this, at the beginning of each year, we plot the rate forecasts from the Philadelphia FRB’s Professional Forecaster Survey.  The record of the forecasters has not been stellar.

The blue line on the chart shows the level of yield; the other lines show the consensus forecasts.  The open boxes on the red lines are “misses” and the filled dots are “hits.”  The forecasters are wrong about 59% of the time.

What is interesting to us is not the error rates but the fact that the direction of the error is consistent; the forecasters expect higher rates.  We suspect a major part of this was due to forecasters overestimating inflation.  It has been our position that globalization and deregulation are responsible for low inflation, not monetary policy.  We had little faith in central bank ability to cause inflation and so we have tended to be more dovish on long-term rates in our asset allocation portfolios.

Still, we have noticed that the downtrend in rates has mostly ended in 2012, while rates have been rangebound for the past five years.  Clearly, the forecasters are looking for an upside “breakout” in yields that has failed to materialize…so far.

Our 10-year T-note yield model puts fair value at 2.10%; thus, current yields are a bit high.  The model uses fed funds, long-term inflation trends, the yen/dollar exchange rate, oil prices and the yield on German bonds.  What is troubling for us is that if we just use the first two variables of the model, the fair value yield jumps to 3.03%, which is in the neighborhood of the current Philadelphia FRB forecast.  Simply put, international factors appear to be holding down fair value yields.  A weaker yen, higher oil prices or rising German sovereign yields will likely have a negative effect on the fair value yield.  Of the three, German yields are probably the most critical.  If the Eurozone avoids financial and political problems, it appears the ECB is prepared to begin slowly withdrawing stimulus.  If that’s the case, the forecasters may have a chance of being right this year.

View the PDF

Asset Allocation Weekly (June 30, 2017)

by Asset Allocation Committee

For equity investors, there is always a concern about the major market declines; being able to reduce market exposure prior to crashes like the ones in 2000 or 2008 is always desirable.  Although large declines have occurred outside of economic recessions, they have become increasingly rare.  The last major market pullback absent a recession was the 1987 crash.  Thus, an indicator that can use high frequency economic data (data that is available on a weekly basis) and relate it to equities should have some value.

This chart shows one of our recent efforts.  The upper line is the monthly average for the S&P 500; the lower line is an indicator built of three economic numbers—initial claims, the CRB commodity index and the Conference Board’s Consumer Confidence data.  We have standardized[1] the economic data and created an indicator, shown on the bottom of the graph.  In general, a positive reading is generally bullish for equities.  We have placed vertical lines on the chart to indicate when the indicator turned negative with persistence.  These are usually periods of falling equities.

Although useful, it is clear that the indicator is somewhat “late” in that the equity decline is well underway by the time it becomes negative.  That would suggest that a momentum number based off the economic indicator might be helpful.

To achieve this, we calculated the 18-month change in the above indicator and set a “crash line” at -1.0.  The adjustment improves the indicator’s value, indicating an investor should reduce equity exposure sooner than the unchanged index would suggest.  At the same time, using a -1.0 reading eliminated the false exit signals.

There is an element of “data mining” here and we would not recommend using this indicator as a “precision instrument.”  However, it does show that these three standardized data points  are fairly good coincident indicators of the economy and, using an 18-month change and a filter, do offer reasonably good warnings when one should reduce exposure and when a market pullback is a mere correction.

We use the period since 1997 because it makes the data easier to observe.  But, we did look at data from 1980 and the performance is similar.  As we would expect, the indicator did not help at all during the 1987 crash, confirming that its usefulness is as a gauge of the interaction between equities and the economy, not as a pure market indicator.

What is it telling us now?  The economy is doing well enough that market declines will probably not be more than normal pullbacks.  Of course, this sort of indicator won’t necessarily be helpful if a geopolitical event triggers a major market decline.  But, the most common cause of bear markets in equities are recessions.  For now, that doesn’t appear to be on the horizon.

View the PDF


[1] Standardizing entails subtracting the raw data by its average and dividing by its standard deviation.  The resulting number is then adjusted by how far it is from average and how far it is from its normal deviation.  Standardizing allows one to combine unlike indicators and essentially balance their relative effect.  In this case, the formula is Indicator = (standardized CRB + standardized Consumer Confidence) – standardized Initial Claims.  We subtract the claims data because lower claims indicates a stronger economy.  Subtracting that number thus allows the indicator to rise when economic data are improving and vice versa.

Weekly Geopolitical Report – The Second Korean War: Part II (June 26, 2017)

by Bill O’Grady

(N.B.  Due to the Independence Day holiday, our next report will be published on July 10th.  That edition will be our Mid-Year Geopolitical Update.)

Last week, we offered background on the situation with North Korea.  We presented a short history of the Korean War with a concentration on the lessons learned by the primary combatants.  We also examined North Korea’s political development from the postwar period through the fall of communism and how these conditions framed North Korea’s geopolitical situation.  We also analyzed U.S. policy with North Korea and why these policies have failed to change the regime’s behavior.

The primary concern is that North Korea appears on track to developing a nuclear warhead and a method of delivery that would directly threaten the U.S.  This outcome is intolerable and will trigger an American response.

In Part II, we will discuss what a war on the peninsula would look like, including the military goals of the U.S. and North Korea.  This analysis will include the signals being sent by the U.S. that military action is under consideration and a look at the military assets that are in place.  War isn’t the only outcome; stronger sanctions or a blockade are possible, as are negotiations.  An analysis of the chances of success and likelihood of implementation will be considered.  As always, we will conclude with market ramifications.

View the full report