

Asset Allocation Weekly (July 14, 2017)
by Asset Allocation Committee
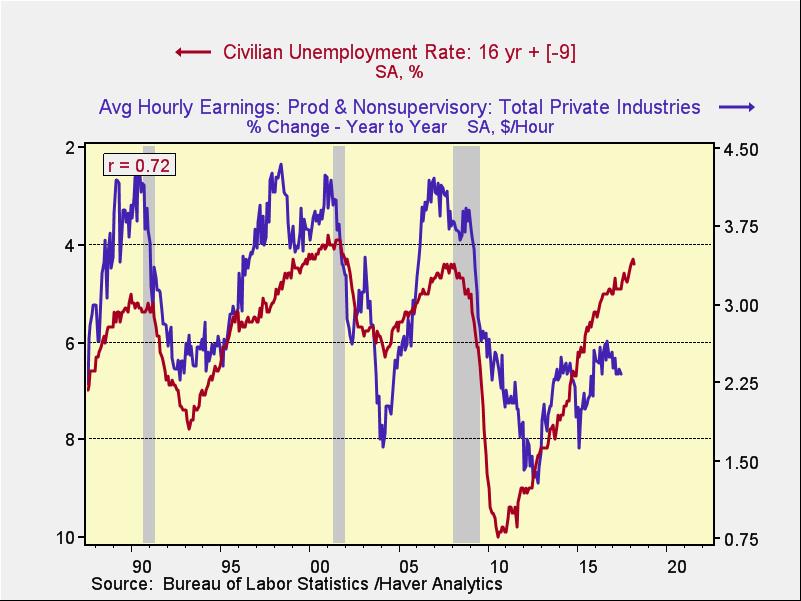
One of the mysteries of this expansion has been the slow pace of wage growth. Despite the plethora of evidence that labor markets are tight, including hires-to-openings ratio below one, low unemployment, low initial claims and a low unemployment rate, wage growth has remained stunted. The chart below is one we have used often in the past; it suggests with unemployment at current levels, previous episodes would have brought wage growth closer to 4% compared to the current growth of 2.3%.
One of our thoughts was that, perhaps, the national unemployment rate was masking pockets of high regional unemployment. In other words, if there was a wide dispersion of labor market activity, the weak regions of the country could be holding down wage growth.
To test this, we looked at the level of state unemployment relative to the Congressional Budget Office’s calculation of the natural rate of unemployment.[1] We calculated the number of states with unemployment below the natural rate. What we found is consistent with the above graph. In other words, it doesn’t appear that regional issues were holding down wages.
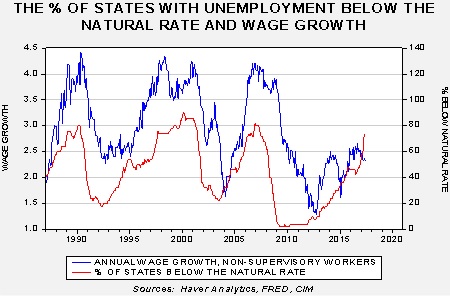
Since 1987, average wage growth is 2.98%; in the periods where the percentage of state unemployment rates below the natural rate exceeds 65%, wage growth was 3.89%. The current combination is unusually low.
However, as part of this research, we did find another interesting factor. There has been speculation that low inflation rates may be affecting wage growth. To test that thesis, we subtracted annual wage growth for non-supervisory workers against the three-year average of the yearly change in CPI. Our reason for using the average is that businesses and workers tend to react to the recent trend in inflation and not necessarily the most current number. We found results that were more consistent with this theory.
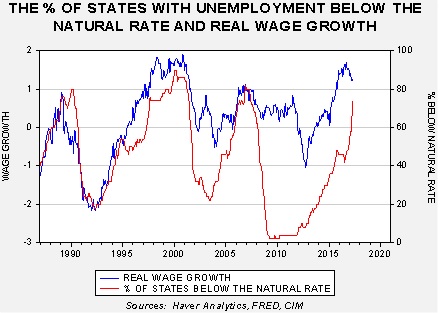
Over the same time frame, real wage growth was 0.26%, but when the percentage of states with unemployment below the natural rate exceeds 65%, real wage growth is 1.04%. As the chart shows, real wage growth is consistent with tight labor markets as defined by the percentage of state unemployment rates below the national natural rate.
So, the puzzle of why wage growth is slow may simply be due to low inflation. The three-year average of inflation may act as an anchor in the wage bargaining process and wage growth will probably remain stalled without rising inflation. A cursory glance at the annual rate of inflation relative to the three-year average suggests that the average rate will likely remain stable for the foreseeable future. Thus, wage growth will probably remain stable, increasing the risk that tightening monetary policy will have an adverse impact on the economy and markets. Of course, the wage issue is a matter of debate within the FOMC which could mean that the path of tightening is slow and measured, more in line with the financial market’s expectations surrounding future policy.
[1] This rate is sometimes called the Non-Accelerating Inflation Rate of Unemployment, or NAIRU. The idea is to determine what level of unemployment is the lowest rate attainable before higher inflation is triggered.