Weekly Geopolitical Report – The Italian Elections: Part II (February 26, 2018)

by Bill O’Grady

In Part I of this report we outlined the geopolitics of Italy and its political economy.  This week, we continue the report with an analysis of the upcoming elections and Germany’s impact on the EU, concluding with potential market ramifications.

The Election
There are four major parties in Italy.  Below we detail each party, its current support in the polls and major policy positions.

Five-Star Movement
Current Polling: 28.0%
Alignment: The Five-Star movement is not currently part of a coalition and has indicated it won’t join one.
Policy Positions: This party would be best described as left-wing populist.  Since inception, the Five-Star Movement has been a Eurosceptic party and has threatened to exit the Eurozone.  However, leaders have recently backed away from that position as Italians, while unhappy with the euro, are not committed to the disruption that leaving would entail.  Instead, this party wants to see the EU fiscal compact abolished and wants Italy to run high deficits to boost growth.  It has also called for universal income for low income households.

Democratic Party
Current polling: 22.1%
Alignment: The Democratic Party is a center-left establishment party.  It makes up the majority of a coalition of four other parties that have very little support.
Policy Positions: This party is the least Eurosceptic of the major parties, but it wants a revision to the EU fiscal compact.

Forza Italia
Current Polling: 18.3%
Alignment: Forza Italia is part of a right-wing alignment of three other parties, including the Northern League (see below), which is polling at 39.3% as a group.
Policy Positions: Forza Italia is a center-right establishment party but is led by the controversial Silvio Berlusconi, who often portrays himself as a populist.  He is calling for lower taxes, labor market liberalization and tighter immigration controls.  Their position on the single currency is that it has been bad for Italy but the country cannot exit it.

Northern League
Current Polling: 13.2%
Alignment: The Northern League is part of the center-right coalition, led by Forza Italia.
Policy Positions: With its base in the northern part of Italy, the Northern League is a right-wing populist party.  It wants lower taxes, a smaller federal government and a referendum on remaining in the Eurozone.

View the full report

Asset Allocation Weekly (February 23, 2018)

by Asset Allocation Committee

Last week, we discussed the impact of the growing fiscal deficit on the economy and markets.  We did note that fiscal deficits have tended to weaken the dollar.  This week, we want to expand on that analysis.  To start, we note that fiscal policy does not operate in a vacuum.  To measure the combined effect of monetary and fiscal policies, we added real fed funds (fed funds less yearly change in CPI) and the fiscal deficit as a percentage of GDP to create a policy proxy variable.  Real fed funds offset the impact of inflation and scaling the fiscal account to GDP shows the relative effect of fiscal policy.

The lower line of the chart is the sum of the upper two lines on the chart.  The thesis is that policy is stimulative when the lower line is rising.

This chart shows the policy proxy with the JPM dollar index.  The pattern seems to be that the dollar appreciates when policy tightens with at least a two- or three-year lag.  The “Volcker dollar” rally in the early 1980s was due to the combination of very high interest rates and rising fiscal deficits.  The dollar bull market from 1995 to 2002 was due to the combination of rather tight monetary and fiscal policies.  The most recent bull market, surprisingly, was tight fiscal policy (especially in light of the sluggish economy) and rather easy monetary policy.

The first chart shows the Congressional Budget Office’s estimate for the future deficit.  If the FOMC does not significantly tighten monetary policy in the coming months, it looks like the dollar could come under pressure.  Obviously, if we were to get a repeat of Chair Volcker’s monetary policy, we would be bullish on the greenback.  However, we strongly doubt monetary policy will be that tight.  After all, real fed funds approached 10% in 1991.  And, if the economy were to weaken, the fiscal deficit would widen more than expected due to the automatic spending that comes from higher unemployment insurance and other income support and the lower revenue for falling tax receipts.

Given the dollar’s current parity overvaluation, as we discussed earlier this month,[1] the current fiscal expansion and continued accommodative monetary policy have the potential to exacerbate the weakening dollar.  A weak dollar is bullish for foreign equities and commodities, and usually boosts large capitalization stocks relative to small capitalization stocks.  The policy proxy is also suggesting steady headwinds for the dollar in the coming years.  Given how rarely changes occur in fiscal policy, we don’t expect major changes on that front anytime soon.  Although monetary policy will likely tighten, it will take significant increases in the fed funds target to offset the overvaluation noted in the parity analysis discussed in an earlier report and the widening fiscal deficit.  Thus, we look for dollar weakness to be a factor this year and into 2019.

View the PDF


[1] See Asset Allocation Weekly, 2/2/18.

Asset Allocation Weekly (February 16, 2018)

by Asset Allocation Committee

Do fiscal deficits matter?  This is one of the more polarizing topics in economics.  The recent tax bill and budget agreement will increase the deficit, which has led to all sorts of worries and claims.  Here are a few observations:

  1. Politically, deficits matter to the party out of power. Protesting against deficits are one of the few ways a party out of power can restrain the party in power.  Thus, the party in power tends to ignore deficits because it doesn’t want to be restrained.  In addition, there is always a fear that borrowing capacity could become constrained, so by the time the party out of power regains a majority, it will be stuck with implementing austerity.  Each party believes there are some types of public expenditures that are good for their own sake and should be paid for even if the deficit increases.  Although a generalization, Republicans tend to support defense spending and tax cuts; Democrats tend to support health care and social spending.  Thus, what angers each side about the other side’s priorities is that they view their own priorities as sacred and the others’ as buying votes.
  2. The economic impact is complicated and dependent upon market and economic conditions. One of the most common mistakes people make in terms of the deficit is the error of composition.  This is a classic logic error where one postulates that what is true on a small scale is also true on a large scale.  Thus, it’s common for politicians[1] to note that a household can’t borrow money to unsustainable levels and neither can the government.  However, there is a big difference between a government and a household.  First, the former can use force to collect revenue to service debt (if you don’t pay your taxes, the government can use coercion), and second, the government prints the currency used to pay the debt.  If households could use force to service their debt and print money, they would be like the government and thus could borrow much more.
  3. The major issue with deficits is spending priorities. The government of a developing nation should run deficits to build out infrastructure because the return on the investment will likely exceed the cost.  In wartime, borrowing money to fund the war effort makes sense because the state will cease to exist if the nation loses the war.  Education is arguably a good public investment, as is domestic security.  One would expect strong debates about how much of these public[2] or quasi-public goods should be provided.  The reality is that it’s difficult to estimate the value of public investment and spending, and arguments over these issues will be perpetual.

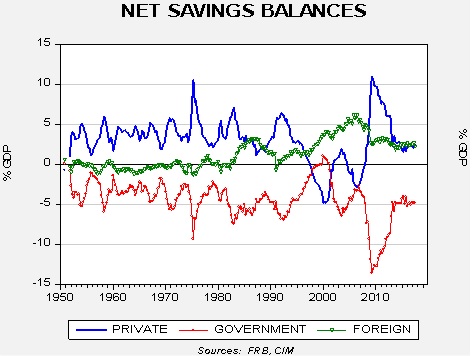
Do deficits matter?  Yes, but not in the simple form that pundits suggest.  When the government spends more money than it takes in from taxes, that saving has to be acquired from the other major sectors of the economy, the private sector (households and businesses) or the foreign sector (through the trade account).

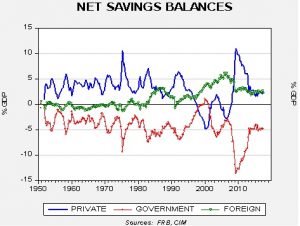
Private saving balance = (business revenue less business investment) + (household saving less consumption)

Public saving balance = (taxes less government spending and transfers)

Foreign saving balance = inverse of the current account

The above chart shows the three sectors of the saving balance; it’s a macroeconomic identity, meaning that it will always equal zero.  Thus, when the government deficit expands, it must be funded by saving created by either the foreign sector or the private sector.  When the government runs a surplus, it depletes private sector saving or reduces foreign inflows.

The impact on the economy depends on the return from government spending relative to the return from the private sector or the foreign sector.  If public spending has a higher rate of return than investment in the private sector, then fiscal deficits are reasonable.  However, this calculation is extraordinarily difficult.  Think of the rate of return on the Strategic Petroleum Reserve; if the world experiences a major war in the Middle East and oil rises to $150 per barrel, the investment when oil was cheaper would almost certainly be positive.  The same would be true for peacetime defense spending when war breaks out.  However, outside of dire situations and under shorter time frames, private sector investment probably has a higher rate of return.

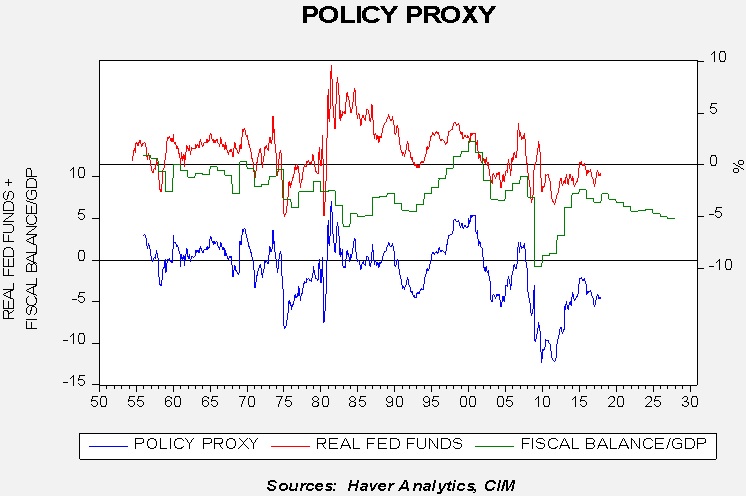
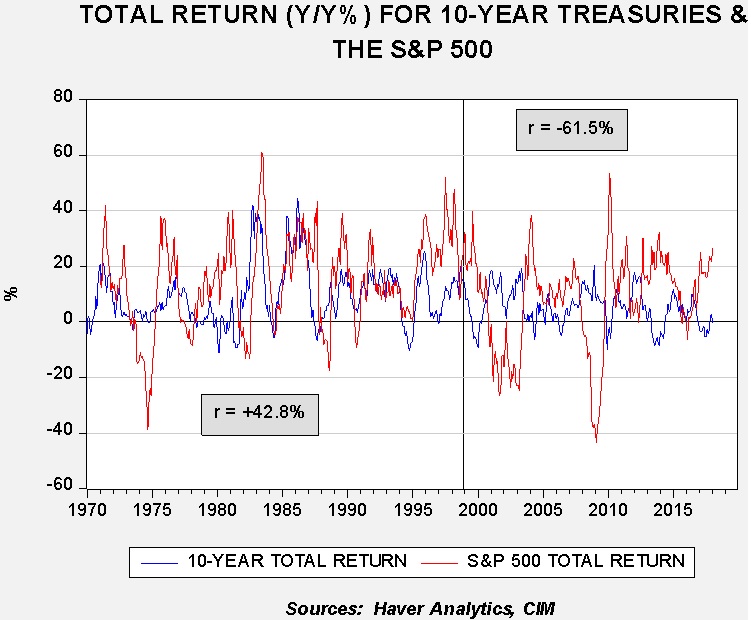
Our concern is the market impact.  The classic fear is that deficits trigger inflation and higher interest rates.  The theory is that if the government runs a deficit, the private sector will offset it, which will require a drop in consumption and crowd out private investment.  The drop in consumption is usually facilitated by higher prices and the contraction of investment would usually constrain output and lift inflation as well.  The data actually shows that higher deficits did seem to boost interest rates from the late 1950s into the early 1980s; however, the relationship became uncorrelated thereafter.

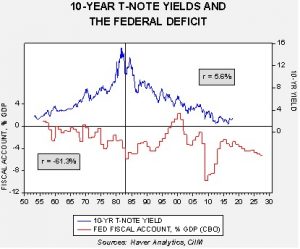
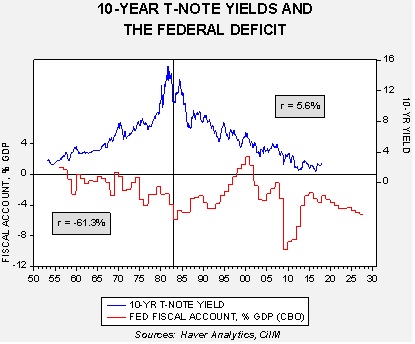
Since 1983, long-duration Treasury rates have steadily declined despite the trend in the deficit.  In comparison to the first graph, what changed in 1983 was the expanding current account deficit, which brought in another source of saving to fund the fiscal deficit.

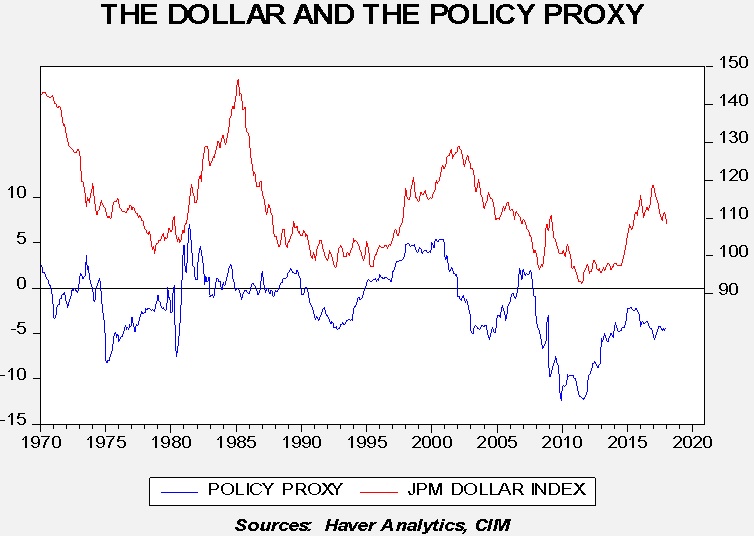
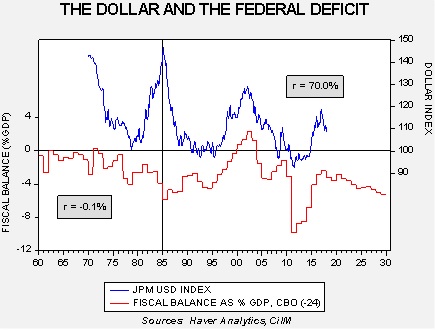
One area that will likely be affected is the dollar.  The dollar was mostly uncorrelated with the fiscal balance until the peak of the “Volcker dollar” in 1985.  However, since then, with a two-year lag, the fiscal account correlates directly with the dollar at a level of 70%.  A fiscal surplus tends to be dollar bullish, while a widening deficit is dollar bearish.

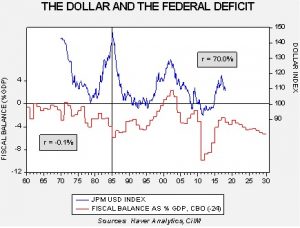
We believe this occurs because of the dollar’s reserve status.  There is a constant demand for dollars on world markets to facilitate trade.  A wider fiscal deficit makes more dollars available for world markets; rising supply tends to weaken the dollar’s price, the exchange rate.  On the other hand, a fiscal surplus (or narrower deficit) means the supply of dollars is less, boosting the exchange rate.

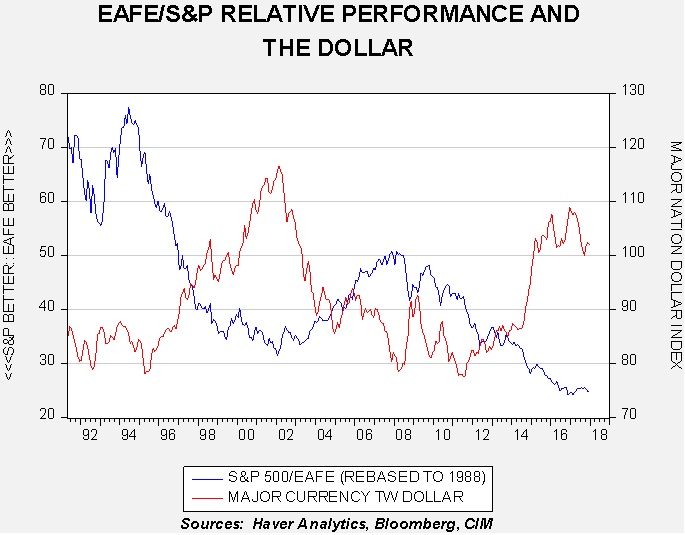
Although it is possible that a weaker dollar could lift prices, the evidence is scant; foreign countries use exports for growth and to lower unemployment in their nations. As a result, they tend to accept margin compression rather than give up market share through higher prices.  Accordingly, we think the preponderance of the evidence suggests the expanding fiscal deficit will be dollar bearish and supportive for foreign assets. 

View the PDF


[1] Usually the party out of power, but not always.  There are a few political figures that are consistently opposed to deficits and government debt regardless of whether or not their party is in control of Congress.

[2] In public finance, a public good is a good that cannot be easily excluded and is non-rivalrous, meaning that it is either provided to all or none.  Fire protection cannot be easily segregated, for example.   In theory, one could argue that the fire department should only put out fires from households that pay their “fire bill.”  In reality, it is probably impossible to allow one house to burn down and not adversely affect neighboring homes who did pay their fees.  Police services, libraries, etc. are examples of pure public goods.  If the government or a non-profit entity doesn’t provide the good, no private sector firm will provide it because it cannot ensure it will get paid (getting back to the government’s ability to use coercion to collect taxes).  Quasi-public goods are goods that can be provided by the private sector but is sometimes provided in less quantities than considered optimal.  If households don’t earn enough to provide for the wellbeing of a family, a quasi-public good would be public assistance.  The private sector does provide food and shelter but it may not produce enough to be a feasible option for a low income household.

Weekly Geopolitical Report – The Italian Elections: Part I (February 12, 2018)

by Bill O’Grady

(Due to President’s Day, the next report will be published on February 26.)

Italy will hold elections on March 4, 2018.  Given that recent elections in the Eurozone have run an emotional gamut, it is difficult to predict the outcome.  There was great fear before last year’s elections in France that a National Front victory could undermine the Eurozone.  The National Front is a nationalist, right-wing Eurosceptic populist party.  In light of surprise populist victories around the world,[1] there were worries that France would be the next major win for populism.  Emmanuel Macron’s surprising landslide put those fears to rest.  On the other hand, there was little concern surrounding last autumn’s elections in Germany as Angela Merkel was expected to win easily.  However, mainstream parties in Germany saw their popularity decline, offset by surprising strength for the AfD party, an anti-immigrant and Eurosceptic party.  Since winning the election, Chancellor Merkel has struggled to build a ruling coalition.  She recently made a deal with the Social Democrats (SDP) to form another “Grand Coalition” government, but in the process she was forced to give the SDP key ministries that will likely provide Germany more flexibility in managing the fiscal rules of the EU but will make the conservatives less likely to support this government for an extended period.

Thus, expectations for the French elections proved to be too pessimistic, while expectations for the German elections were overly sanguine.  It appears the anticipated outcome for the upcoming Italian elections is similar to that of Germany; although there is clear evidence that populist parties are growing in popularity in Italy, predictions call for a hung parliament and the eventual creation of a center-right coalition that will not threaten the stability of the Eurozone.  This sentiment is evident in the financial markets.

(Source: Bloomberg)

This chart shows the spread between Italian and German 10-year sovereign yields.  Although German yields declined relative to Italian yields into early 2017, the spread has steadily narrowed since April 2017 to the present.  If there were serious concerns about the Italian elections leading to Italy’s exit from the Eurozone, Italian yields would be rising relative to German yields.

Although we think the consensus case is the most likely outcome, there is potential for a negative surprise.  Given that Euroscepticism is high in Italy, even a consensus outcome may not be all that favorable.

In Part I of this report, we will begin with the basic geopolitics of Italy with a focus on the natural divisions in the country that make it difficult to govern.  From there, we will examine the political economy of Italy, especially how Italian political leaders managed the economy to deal with the sharp divisions between the north and south.  In Part II, using this background, we will analyze the polling for this election and the potential outcomes.  We will also touch on the issue of German influence in the EU.  As always, we will conclude with potential market ramifications.

View the full report


[1] The presidency of Donald Trump and Brexit are two examples.

Asset Allocation Weekly (February 9, 2018)

by Asset Allocation Committee

The continued rise in long-term interest rates is clearly grabbing the attention of financial markets.  Stronger than expected wage growth was the proximate cause of the recent lift in yields.  Although overall wages rose 2.9%, wages for production and non-supervisory workers grew only 2.4%.  Still, it is clear that fears of inflation stemming from an accelerating economy and concerns about monetary policy tightening are leading to rising interest rates.

Here is our updated 10-year T-note model.

The model’s core variables are fed funds and the 15-year moving average of inflation, which we use as a proxy for inflation expectations. The other three variables are the yen, oil prices and German long-duration sovereign yields.  The current yield on the 10-year T-note, which is in the 2.80% range, is running above fair value.  The standard error for this model, shown on the lower part of the graph as the parallel lines running along the midpoint of the standard error, is ±70 bps.  Thus, reaching a level that would signal excessively high yields would be 3.20%.

Complicating this case is the fact that the FOMC is expected to raise rates at least three times this year, and perhaps four, German yields are rising and oil prices have increased as well.  To project the potential lift in yields, we made some projections.  Assuming the FOMC moves the upper end of the target rate to 2.25%, with nothing else changing, fair value for the 10-year T-note will reach 2.825%.  The recent lift in 10-year T-note yields appears to be mostly discounting tighter monetary policy.  If oil prices reach $75 per barrel, the fair value yield would hit 2.90%, and if German yields rise to 1.00%, we would see 2.95%.  This suggests to us that a reasonable projection of variables likely takes us to a 3.00% 10-year T-note in the coming months.  In other words, it appears the 10-year T-note yield is mostly about discounting tighter monetary policy.

One other factor worth mentioning is that bond and stock prices have been positively correlated recently.  Under these circumstances, the effectiveness of bonds as a portfolio diversification tool is reduced.

It’s interesting that the returns were positively correlated from 1970 to 1998.  What caused the reversal?  Most likely it’s a function of the steady decline in interest rates from their high peak in the early 1980s to normal levels by the late 1990s.  In other words, falling yields were the norm during that two-decade period and, as rates fell, it supported rising P/E multiples.  After rates normalized by the end of the 1990s, the ordinary inverse relationship between equities and bond prices emerged.  Although the short-term price action between bonds and equities is a concern, we doubt it will be maintained.  Since the shift in the correlation occurred in the late 1990s, we have seen two periods when the one-year rolling correlation became positive, 2007 and 2015.  Neither event lasted very long nor did it undermine the longer term diversification that longer duration bonds offered.  We suspect the current positively correlated event is due to an overbought correction in equities and a bond market discounting tighter monetary policy (as noted above).  Thus, we view this as a temporary event.

View the PDF

Weekly Geopolitical Report – Trump & Trade: The First Year (February 5, 2018)

by Bill O’Grady

President Trump has been in office for just over one year, having been inaugurated on January 20, 2017.  He campaigned on a populist agenda—anti-globalism was a core message.  Specifically, his “America First” mantra railed against free trade deals, suggesting they were poorly negotiated, supported immigration restrictions and called on allies to shoulder more of their defense burdens.

In this report, we are going to focus on the trade situation following his first year in office.  We will begin with a review of American hegemony and trade, including how trade is affected by saving patterns both in the U.S. and abroad.  This analysis will include commentary on the effects of fiscal policy on administration trade policy, showing how they are working at cross purposes.  One critically important aspect of administration trade policy is how foreign nations react to the threat of tariffs and sanctions.  We will argue that the administration’s goal should be employment and show how foreign companies may be adjusting to Trump’s policies in a way that won’t help narrow the trade deficit but could improve the job market.  As always, we will conclude with potential market ramifications.

View the full report

Asset Allocation Weekly (February 2, 2018)

by Asset Allocation Committee

The World Economic Forum in Davos was held recently and various comments were made about the dollar during the meetings.  Treasury Secretary Mnuchin seemed to imply that the administration was talking the dollar lower, a violation of unwritten protocols that make it acceptable to have a weaker currency in support of growth but improper to use depreciation to give a nation an advantage on trade.  Later, President Trump seemed to contradict his treasury secretary, suggesting the dollar should strengthen.  This led the financial media to deploy a parade of currency analysts to try to explain the dollar’s behavior.  The cacophony of comments did little to explain market action.

Our position on exchange rates is that there is no single valuation method that works consistently.  In our over 30 years of monitoring and analyzing exchange rates, we have found they are usually characterized by regimes.  During some periods, trade balances drive exchange rates.  In other periods, interest rate differentials are the key factor.  Relative growth rates or productivity have also been relevant.  But, in the long run, the oldest valuation method, purchasing power parity, remains useful for investors.

Purchasing power parity assumes that exchange rates bring equilibrium to relative prices.  In other words, if price levels in one nation are higher compared to another nation, the country with higher price levels will experience currency depreciation until price levels equalize.  In practice, the ratio of price levels isn’t perfect—not all goods in a price index are tradeable, inflation indices between countries are not identical and no markets are frictionless, so adjustments can take time.  But, what we find in practice is that when the exchange rate deviates widely from the ratio of inflation rates (or, purchasing power parity), the exchange rate usually adjusts.

These are exactly the conditions we have seen recently.

This chart shows our calculation of purchasing power parity for the euro (based off the D-mark at euro parity and German inflation), the Canadian dollar, the British pound and the Japanese yen.  In all cases, the dollar is highly overvalued.  What we find missing in most comments about the dollar that we see in the financial media is that the dollar is weakening in response to overvaluation.  All these charts show that key market signals come at extremes.  As exchange rates approach the standard error lines, they become vulnerable to reversals.  And, when reversals occur, it is not uncommon for the exchange rate to move to an opposite extreme.  This likely means that the dollar will continue to weaken for an extended period.

In response, our asset allocation has added foreign equities.

This chart shows the S&P and EAFE equity indices, denominated in dollars.  We have rebased the two to 1988 and calculated a ratio of the indices.  We have also added the Federal Reserve’s major current index.  When the dollar is strengthening, U.S. stocks tend to outperform.  When the dollar is elevated and reverses, it is usually favorable to foreign equities relative to U.S. equities.

In general, both indices tend to be closely correlated.  As a result, shifting to overseas stocks doesn’t mean that domestic equities are expected to decline.  Instead, it suggests that the tailwind of a weaker dollar boosts the relative value of foreign stocks to a U.S. investor.  That is the rationale for our current allocation.

View the PDF

Weekly Geopolitical Report – Thinking the Unthinkable (Again): Part II (January 29, 2018)

by Bill O’Grady

Last week, we published the first part[1] of this report looking at how the U.S. and other nations are changing their policies toward nuclear weapons.  This is something of a refresh of a report we did seven years ago.[2]  Since we published this earlier report, we have seen an increase in actual and potential nuclear proliferation.  Both the previous and current U.S. administrations are developing new nuclear weapons policies.  What spurred this two-part report was the recent false alarm in Hawaii.

Last week, we reviewed the development of nuclear weapons and the U.S. deployment policy from the end of WWII to the end of the Cold War.  We offered an analysis of how the theory of deterrence developed over time and introduced the history of the post-Cold War era.  This week, we will discuss how the Cold War arrangements have broken down in the post-Cold War world and the nuclear proliferation that has ensued.  We will also examine how states will cope with this changing nuclear weapons environment and the evolution of new nuclear doctrines.  This will include a discussion on civil defense, nuclear strategy and weapons development.  We will conclude, as always, with potential market ramifications.

View the full report


[1] See WGR, 1/22/18, Thinking the Unthinkable (Again): Part I.

[2] See WGR, 1/10/2011, Thinking the Unthinkable: Civil Defense.

Asset Allocation Weekly (January 26, 2018)

by Asset Allocation Committee

Equity markets have been steadily rising, with the major indices making a series of new all-time highs.  The recent impetus to equities has been the tax law.  As we detailed in our recent addendum to our 2018 Outlook,[1] the tax bill will shift about 1.3% of GDP to after-tax corporate profits.  This development led us to raise our forecast for the S&P 500 to 3056.12 for 2018.  At the same time, we realize bear markets do happen.  So, what do we think as the market keeps trending higher?

In our 2018 Outlook[2] we detailed our views on the economy and how the economy affects equity markets.  In summary, since 1987, each bear market in equities has coincided with economic recession.  There is no evidence at present that a recession is looming in the near future; however, we do pay very close attention to the two major causes, geopolitical events and monetary policy mistakes, and will try to warn readers if we see anything looming.

This report, instead, is going to focus on short-term market factors.  The steady rise in equities fosters both fear and greed.  Here are some of the factors we are watching:

First, investor sentiment is elevated.  The American Association of Individual Investor Sentiment Index is elevated; in fact, the ratio of bulls/bears is 5.25, wider than before the 1987 crash.  Another sentiment indicator we monitor, from Ned Davis, tells a similar story.

Copyright 2018 Ned Davis Research, Inc. Further distribution prohibited without prior permission. All Rights Reserved. See NDR Disclaimer at www.ndr.com/copyright.html. For data vendor disclaimers refer to www.ndr.com/vendorinfo/.

The theory behind these sentiment indicators is “contrarianism.”  Contrarianism is based on the idea that what the crowd believes is probably either (a) wrong, or (b) already discounted by the market.  In other words, once investors become extremely bullish, not only does the price probably contain that sentiment, but high sentiment means there probably isn’t more upside left.  Another variation of this theory can be seen in famous magazine covers, like The Economist predicting $5 crude oil in the late 1990s very close to the bottom around $10 per barrel.

Still, it is evident from the above chart that sentiment alone isn’t reliable.  After all, Ned Davis uses a reading above 61.5 as an indicator of elevated sentiment; based on this figure, sentiment has been elevated since last November’s election with no significant declines in equity prices.

Second, another factor we monitor is the level of money market funds held by retail households.  Since the recovery began in 2009, equity markets have tended to do well as long as money market funds exceed $920 bn.  But, if money market funds fall below this level, equity markets seem to stall, most likely due to the lack of liquidity.  The combination of liquidity and sentiment appears to offer better insights into market behavior than just sentiment alone.

The chart on the left shows household money market funds.  We have placed orange shading on periods when money market funds fell below $920 bn.  Note how equity markets tended to stall once liquidity became tight.  On the right, we use the same shading (indicating a low level of available liquidity) and the 26-week moving average of the NDR Sentiment Indicator.  This shows that high levels of sentiment with ample cash levels tend to support high equity prices, whereas a reading over 60 on the sentiment index and low cash levels tend to lead to a flat to weaker market.

What is salient about the current situation is the combination of elevated sentiment and ample liquidity.  Although it is possible that short-term interest rates have risen to a level where investors find them attractive, we rather doubt that’s the case.  Over the past few years, elevated levels of cash usually indicate the potential for increased allocation to equities.  High money market balances, coupled with elevated levels of investor sentiment, probably signal higher equity values.

That being said, concern about the elevated level of equities is not without merit.  There is no doubt we are in the “late innings” of this bull market.  After all, the current expansion will soon be the second longest on record.  Although expansions don’t die of old age, rising geopolitical tensions and expectations of tighter monetary policy do suggest this bull market may be measured in quarters, not years.  At the same time, the combination of strong sentiment and high liquidity suggests that further upside is likely and it is probably premature for investors to become overly defensive.

View the PDF


[1] See 2018 Outlook: Addendum, 1/4/18.

[2] See 2018 Outlook, 11/30/17.