Asset Allocation Quarterly (First Quarter 2018)

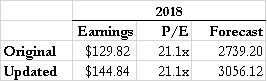
  • The passage of the Tax Cuts and Jobs Act of 2017 significantly increased our earnings forecast for the S&P 500 for 2018 from $129.82 to $144.84.
  • We do not expect major changes to economic growth stemming from the tax legislation.
  • Fed policy should continue to tighten through increases in the fed funds rate and a reduction in the size of the Fed’s balance sheet.
  • An increased federal deficit factors into our outlook for softness of the U.S. dollar versus other currencies.
  • We initiate a laddered structure for bonds in strategies where income is a factor.
  • Overall equity exposures remain elevated across all strategies relative to historic allocations.
  • Our sector and industry outlooks favor a growth style bias at 60%.

View the complete PDF

ECONOMIC VIEWPOINTS

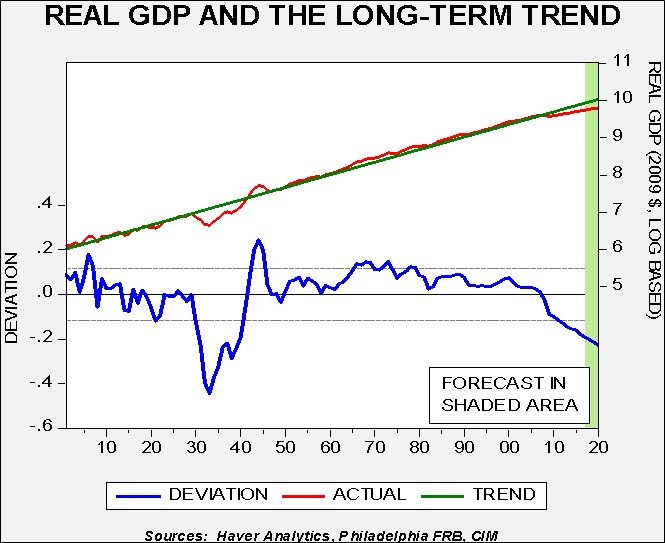
The most significant domestic economic news since last quarter was the passage of tax reform legislation in December, known colloquially as the Tax Cuts and Jobs Act of 2017. While the implications for corporate profitability and a rising federal deficit are substantial and will certainly affect financial markets, our analysis supports the notion that the effects on economic growth will be minimal. Throughout this expansion, GDP has remained beneath its long-term trend, with average real growth of 2.2%.

This slower growth, combined with deregulation and globalization, has encouraged a low inflationary environment, both domestically as well as across developed countries. Our expectations for the year, which help frame our view of our three-year forecast period, is that the economy will remain on its trajectory of modest real GDP growth and inflation will be tame despite a low level of unemployment. Against this backdrop, we expect Fed policy to hold course in raising fed funds and possibly become slightly more hawkish given the changes to the FOMC voting roster. While the potential exists for a policy mistake by the Fed, even with such a mistake our analysis leads to the conclusion that it would not engender an effect until 2019.

Although our forecasts for GDP and inflation are sanguine, consumer and business sentiment remain elevated. The conflation of such high sentiment, tax changes and low inflation may lead to what many describe as a “melt-up” in the equity markets. Though fundamental metrics such as P/E or earnings yield underscore the notion that equities in general are fully valued, we note that such conditions may not only persist for an extended period of time, but can become even more pronounced. While this is not our base case, we view the odds as higher than normal.

Beyond the U.S., a number of issues harbor some degree of uncertainty, notably the upcoming Italian election and its potential to further splinter the EU, the ECB’s tapering of its bond purchase program and China’s ongoing efforts to control credit growth. Despite these uncertainties, we are constructive on developed market economies. Moreover, based on purchasing power parity, which is a measure of exchange rate valuation based on relative inflation rates, we find the U.S. dollar remains overvalued relative to the euro, pound, yen and Canadian dollar. Regarding emerging economies, there is obviously a wide divergence of economic activity. Nevertheless, in the aggregate, emerging economies are helping to propel global growth and arguably the basket of emerging market currencies holds appeal relative to the U.S. dollar. For U.S.-based investors, a weakening dollar acts as a tailwind for foreign investing.

STOCK MARKET OUTLOOK

Based on our outlook for the economy and the effects of tax legislation, our expectations for U.S. equities are favorable. Our updated earnings forecast for the S&P 500 for 2018 is now $144.84, which represents an 11.6% increase over our previous forecast of $129.82 prior to the passage of the tax legislation.

On the accompanying chart on the next page, the blue line shows the ratio of total S&P 500 earnings to GDP and the green line is the forecast from our margin model. This includes productivity measures, global integration, several interest rate variables, corporate cash flow, the dollar and oil prices. The red line shows our forecast impact of the new legislation. As the chart indicates, we are expecting a significant effect, with S&P 500 profits expected to exceed 6%, a record level.

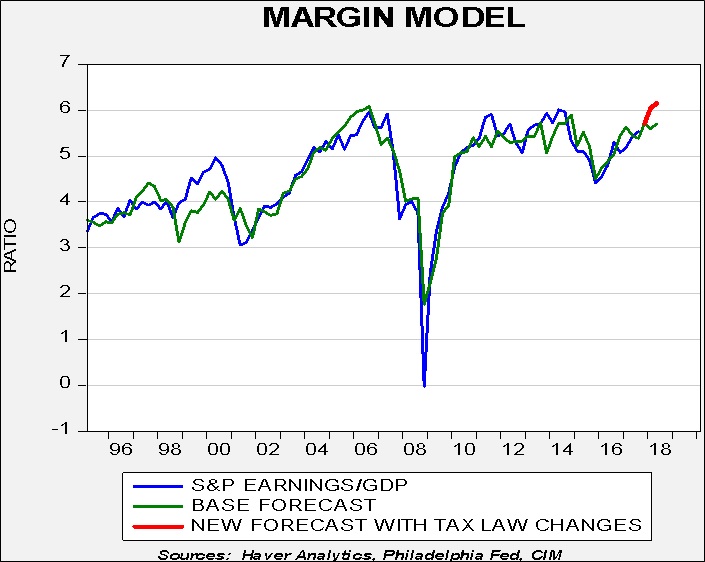
Our new forecast is aggressive and is supportive of the continuation of elevated equity exposures across all strategies relative to our historic allocations. With lower corporate tax rates, cash flow will be higher and, combined with repatriated overseas cash, we expect increased dividends, share buybacks and acquisitions, which should be favorable for the stock market.

Given our overall outlook for equities, we have moved to a 60% tilt toward growth and 40% to value. In U.S. large caps, we overweight technology, energy, financials and materials. Mid-cap and small cap equities have the same tilt toward growth and are both overweight in the more growth-oriented strategies. Outside the U.S., we retain our historic maximum exposure owing to our expectations of continued softness in the U.S. dollar exchange rate.

BOND MARKET OUTLOOK

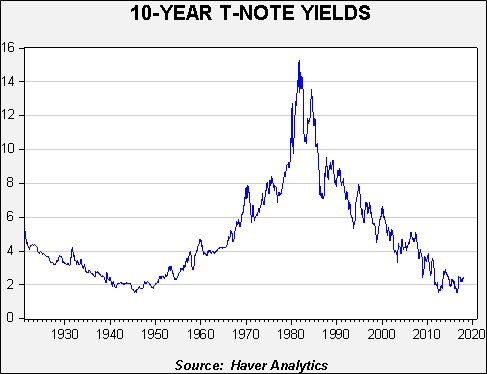
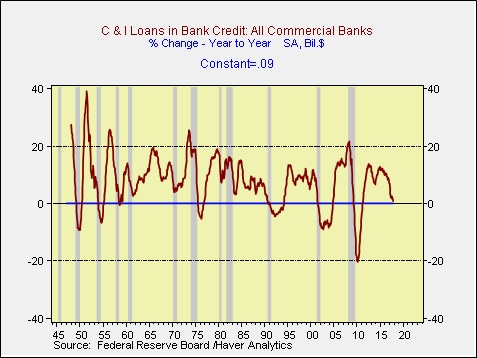
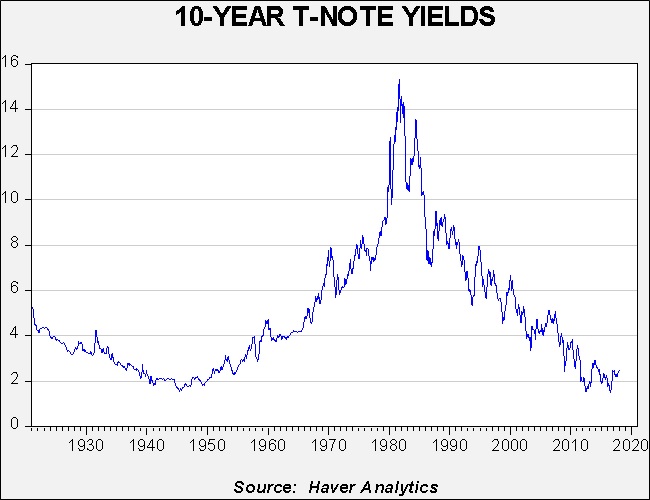
The rise in Treasury yields since the passage of the tax legislation in December has led many commentators to suggest that a bear market in bonds has developed. Though we tend to agree with this assessment, we believe that a secular bear market commenced in 2016 and the prospect is for a gradual increase in rates over not only our forecast period of three years, but likely beyond. The operative word in the previous sentence is gradual as historically problems engendered by bond bear markets take years to manifest. As this chart illustrates, the last secular bond bear market that began in 1945 took over two decades, when yields rose above 5% in the late 1960s, for rising rates to have an adverse impact on financial markets.

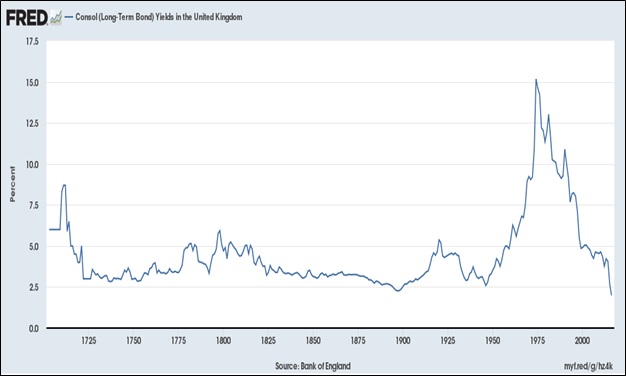
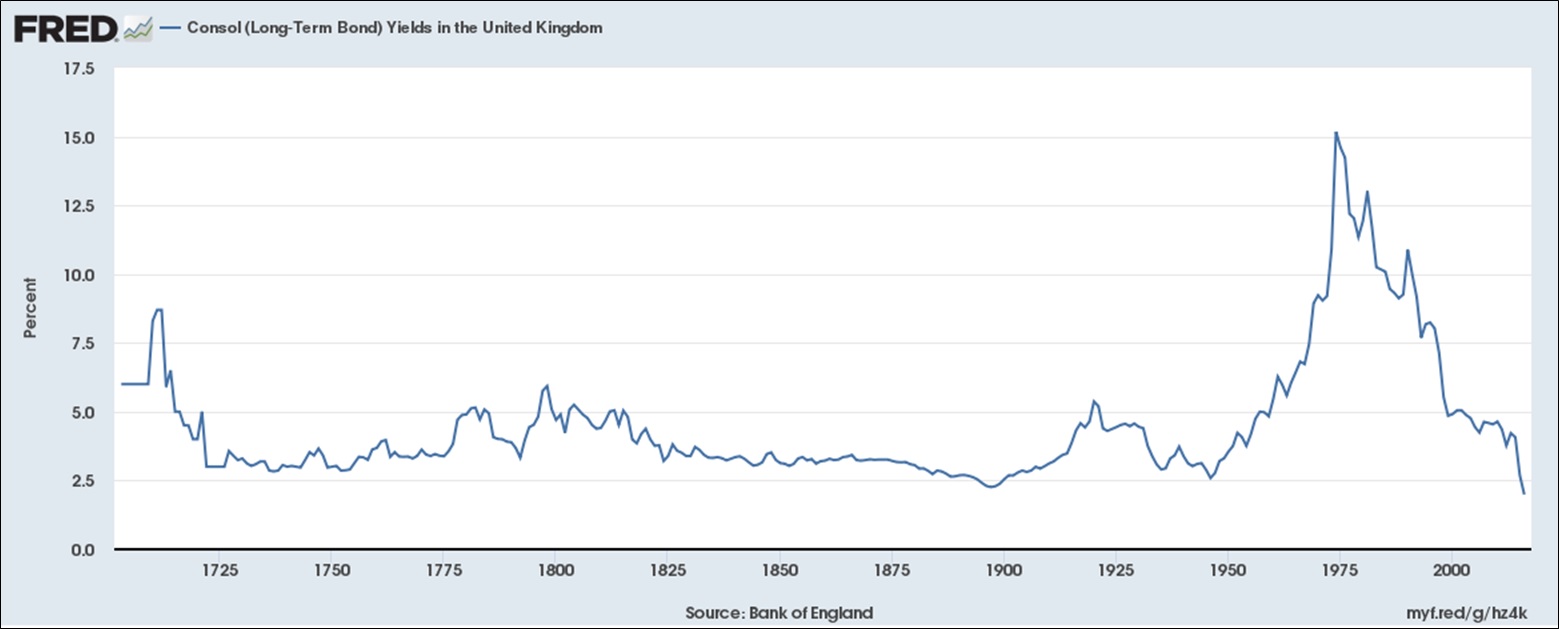
For a longer term perspective, this chart displays the interest rate of U.K. Consols beginning in 1701. What is notable is that both bull and bear markets for bonds endure for long periods of time. Though the British bond bear market following WWII had enormous magnitude, the length was actually fairly normal. For a more detailed analysis of the potential causes and implications of a bear market in bonds, please refer to our Asset Allocation Weekly report (1/19/18).[1]

Over the forecast period, we envision the terminal fed funds rate to be in the range of 2.25% to 2.75%, given the anticipated composition of the Fed’s voting roster. As noted above, we expect a gradual rise in rates over time and, accordingly, have created a laddered core in strategies with income as an investment objective. Bond ladders offer a degree of defense against rising rates through capturing the rolling yield while also allowing maturing issues to be deployed at the longer rungs of the ladder, benefiting from yield advantage. Although the yield curve has flattened and we expect a degree of continued flattening, we still forecast a positively sloped curve that should inure to the benefit of a laddered approach.

Through the use of bond ladders, we lessen the overall duration slightly and maintain the concentration in the intermediate segment of the yield curve. Regarding sectors, spreads for both investment grade and speculative grade corporate bonds remain near post-recession tight levels. Accordingly, Treasuries are attractive and we maintain a lower exposure to speculative grade bonds.

OTHER MARKETS

Exposures to commodities are typically helpful during conditions of rapid economic growth and/or surging inflation expectations. As these conditions are absent from our forecast, the strategies have no allocations to commodities.

View the complete PDF


[1] See Asset Allocation Weekly, 1/19/18

Weekly Geopolitical Report – Thinking the Unthinkable (Again): Part I (January 22, 2018)

by Bill O’Grady

Seven years ago we published a WGR on nuclear war and civil defense.[1]  Over the past seven years, we have seen an increase in actual and potential nuclear proliferation.  Both the Obama and Trump administrations have either reviewed or are reviewing their policies on nuclear weapons and we are clearly seeing a departure from the late Cold War thinking on nuclear policy.  The recent false alarm in Hawaii is an indication of heightened concerns and suggests that another look at this issue is warranted.

In Part I of this report, we will review the development of nuclear weapons and the U.S. deployment policy from the end of WWII to the end of the Cold War.  This history will include analysis of how the theory of deterrence developed over time and introduce the events of the post-Cold War world.  In Part II, we will discuss how the Cold War arrangements have broken down in the post-Cold War world and the ensuing nuclear proliferation.  We will also examine how states will cope with this changing nuclear weapons environment and the evolution of new nuclear doctrines.  This will include a discussion on civil defense, nuclear strategy and weapons development.  We will conclude, as always, with potential market ramifications.

View the full report


[1] See WGR, 1/10/2011, Thinking the Unthinkable: Civil Defense.

Asset Allocation Weekly (January 19, 2018)

by Asset Allocation Committee

Since the beginning of the year, long-term interest rates have moved higher.  The constant maturity 10-year Treasury yield ended 2017 at 2.40%.  That yield climbed to 2.60% in January, which is above our recently released 2018 Outlook forecast.  We are not adjusting our forecast quite yet because the driving factor behind our forecast was continued flattening of the yield curve.  However, if the curve doesn’t flatten further, we will need to revisit that forecast.

The recent rise in yields has led several commentators to declare a new bear market in bonds had developed.  We sort of agree with this statement; we believe a secular bear market in bonds began in 2016 and we will likely see gradually rising rates for the foreseeable future.  However, the key word is “gradually.”  The last secular bear market in bonds began in 1945 and took over two decades to become a serious problem for financial markets.

The above chart shows the 10-year T-note yield from 1921 to the present.  In 1945, yields made their secular low and gradually rose into the early 1980s.  Note the gradual ascent of yields for the first couple decades.  It wasn’t until yields rose above 5% in the late 1960s that rising rates began to have an adverse impact on financial markets.   Of course, when one is talking about secular cycles that last three to four decades, the last experience may not be indicative of what the current secular bear market will look like.  Fortunately, the Bank of England has maintained long-term databases of British interest rates and can offer us some insights into long-term cycles.  The chart below shows the interest rate of British Consols beginning in 1701.  These instruments were bonds without a maturity; essentially, they were very long-duration instruments.  Note that bull and bear markets tended to last a very long time and, in fact, the British bond bear market after WWII was impressive in terms of rate increases but rather normal in terms of length.

Why do secular cycles in bonds last so long?  For the most part, secular cycles in long-duration interest rates are driven by inflation expectations.  Rising inflation undermines the real value of interest return; investors, stung by inflation, will demand ever higher yields for protection.  When policy changes to corral inflation, it takes some time before investors “forget” their unpleasant experiences and accept a lower interest rate.  After a long period of low inflation, investors are “fooled” by rising inflation, at least at its early stages.  This underestimation in inflation leads to falling real returns and prompts demand for rising rates.

What makes the current period interesting is that the baby boomers are unusually sensitive to inflation fears because most of them spent their formative years during the high-inflation period of the 1970s.  Thus, any signs of inflation, regardless of how minor, tend to lead to “discomfort” in the fixed income markets.  The existence and current prominence of the baby boom generation will likely keep long-duration rates from rising very much in the coming years.  The oldest boomer is 72 this year, while the youngest is 54.  Clearly, over the next two decades, the memory of 1970s inflation will fade and the subsequent generations will be much more likely to be fooled by inflation and will be slow to demand higher yields.  This fact will probably lead to the final stages of the bond bear market, which will be rather painful for investors.

So, what does an investor do in the meantime?  We look for gradually rising rates over time.  The policies of neoliberalism, which supported globalization and deregulation,[1] successfully ended the high inflation period of the 1970s.  We are likely in the early stages of a retreat from neoliberalism.  The rise of populism in the West is partly due to citizens becoming acutely aware of the costs of neoliberalism (high level of inequality and job insecurity) without being aware of its benefits (low inflation, long business expansions).  Although it will take some time, tolerance of higher inflation will likely increase.  Investors have two strategies for such an environment.  First, corporate credit tends to do better in the early stages of a secular bear market because gradually rising prices reduce credit risk as firms find it easier to pass along higher prices.  Second, bond laddering, the purchase of instruments at various points of the yield curve, offers some defense from rising rates.  As time passes, the duration of a laddered portfolio falls, reducing rate risk.  As the nearest instrument matures, the investor buys a longer term instrument and the process repeats.  We are currently deploying both strategies in our fixed income allocations.

View the PDF


[1] We define deregulation as the unfettered implementation of new technology and methods on the economy.

Keller Quarterly (January 2018)

Letter to Investors

Welcome to 2018!  The stock and bond markets did much better in 2017 than most participants expected, by my reckoning.  This has led to an unusually large proportion of the forecasts for this year predicting dire outcomes, also by my reckoning.  Predicting the future is impossible, of course, but that doesn’t stop everyone from trying.  Simple bromides such as, “This past year was so good that this coming year must be worse,” or “What goes up must come down,” have the patina of wisdom, but really declare nothing useful.  Markets don’t submit to simple maxims and they definitely don’t obey the law of gravity.

Markets are made up of hundreds of thousands of individuals (and more than a few computers) making independent decisions every day.  The great quantity of individual decisions leads some to think that this data can be analyzed to predict the future, as we can with thousands of observations of natural phenomena.  But trying to make an educated guess about the future of the stock market isn’t like predicting the movements of the planets, which follow long-established rules of physics.  It’s more like trying to guess what your children are going to do next: you have a pretty good idea (because you know them well), but they never cease to surprise you.  Human beings don’t all make the same decisions under the same circumstances.  When the world is tranquil they tend to do the same things, but under stress people often make emotional and irrational decisions (like those children you think you know).  This is why forecasting financial markets, even with lots of data in hand, is so hazardous.  As you may have heard me say before, we are not forecasters, we are odds-makers.  Successful investing involves putting yourself in the best position to be prosperous in an uncertain future.

Getting back to the outlook for the current year, dire projections are everywhere, but, as we noted in last quarter’s letter, fears by so many that a recession and bear market are just around the corner is good evidence that they are not.  Recessions and bear markets are usually the product of complacency, not fear.  The economy is doing rather well, unemployment is low, consumers are spending at a slightly faster rate than in recent years, and business optimism is high.  These conditions correlate better with continued stock market appreciation than with a bear market.

While we have our doubts as to how positive of an impact the recently enacted tax bill will have on economic activity, we have no doubts as to its impact on American stockholders: very positive.  Lower tax rates should result in higher net income and cash flow going forward, even with U.S. business profit margins already at historically high levels.  As the cash piles up and as overseas cash is repatriated, we expect increased dividends, share buybacks, and acquisitions from U.S. corporations.  All of these events are favorable to the stock market.

Is there anything to worry about?  Indeed! The Federal Reserve is famous for “taking the punch bowl away just as the party gets going.”  They have forecasted four increases in the fed funds rate this year, or one full percentage point.  If they follow through with that intention, the economy’s rate of growth could slow.  There also are plenty of geopolitical and economic risks that could throttle back our markets.  But the biggest risk I fear is not yet present: a sense among investors that the market can go nowhere but up.  The conditions that could produce such complacency seem to be coming together in 2018.  So, while we presently aren’t as pessimistic as most forecasts for the current year, we can imagine a world where we would be much more worried: a world where everyone else is optimistic!

Here’s an old adage that we swear by: Be bold when others are cautious and cautious when others are bold.

Thank you for your confidence in us.


Gratefully,

Mark A. Keller, CFA
CEO and Chief Investment Officer

View the PDF

Asset Allocation Weekly (January 12, 2018)

by Asset Allocation Committee

Last week, we issued an addendum to our 2018 Outlook[1] to take into account the recent tax law changes.  Our top-down analysis suggests there will be a significant increase in corporate earnings which will translate into higher S&P 500 earnings.  Our original forecast was for $129.82[2] for 2018; we have increased our earnings forecast in light of the tax bill to $144.84.  We are assuming a 21.1x P/E multiple for 2018, meaning our forecast for the S&P 500 has increased from 2739.20 to 3056.12.

Whenever we make a forecast, as part of the process, we look for factors that could lead us to be wrong.  In the original 2018 Outlook, we focused on a number of factors, including an unexpected recession, excessive monetary policy tightening, etc.  In our 2018 Geopolitical Outlook,[3] we added other events that could adversely affect this forecast.  In this report, we will focus on another factor that could lead to forecast variance.

One of the goals of the tax bill is to boost investment.  The focus on investment does make sense; since the early 1980s, investment levels relative to GDP have been falling with each expansion.

This chart shows the average level of corporate investment relative to GDP for each expansion since the 1960s.  As noted, the level of corporate investment has been falling with each expansion.  It isn’t obvious why this is occurring—a number of factors are probably involved, including more corporate investment offshore due to globalization, improved efficiency of investment due to technology and less investment due to industry concentration (fewer firms making the same things don’t duplicate productive capacity).  The problem is that these are structural factors and we doubt mere changes to the tax bill will foster a significant boost in investment.

This chart shows capital investment and the level of business saving.  Ample capital investment can occur without business saving; in fact, it is not uncommon for business dissaving to occur during periods of expanding capital expenditures.  The recent rise in business saving coincides with falling levels of capital expenditures.

Cutting corporate tax rates could lift investment if there was a lack of available liquidity because cutting tax rates should lift the level of cash available for investment.  However, there is little evidence to suggest a liquidity shortage.  First, as seen above, flows into business saving have been rising.  Second, cash and near-cash holdings of non-financial corporations is relatively high and well above the trough level seen since 1980.

Current liquid assets relative to total assets are 4.9%, which appears ample for self-funding investment.

Third, and perhaps even more telling, is that commercial and industrial (C&I) loan growth is at a level associated with recession.

The current yearly growth of C&I loans is +0.09%; in the past, this level is usually observed either when the economy is in recession or shortly after one has ended.  In no period during the postwar experience has C&I loan growth been this weak without being associated with a recession.  The reason that slowing C&I loan growth affects the economy is that when commercial banks begin cutting back on loans, it usually lowers investment; at the same time, commercial banks tend to be cautious and don’t begin restricting lending until it is abundantly clear that the economy is weakening, thus making this indicator mostly a lagging one.  Lending surveys from the Federal Reserve do not suggest senior loan officers are tightening credit.  Thus, we conclude that the drop in lending is probably a function of falling demand for the loans—simply put, businesses don’t need the liquidity and aren’t borrowing for the current level of economic activity.

As a result, the corporate sector, which has ample liquidity and isn’t borrowing, is about to get even more liquidity pushed its way.  The key issue is most likely a lack of aggregate demand.  In other words, the economy isn’t growing fast enough to trigger an expansion of the capital base.  Thus, unless other parts of the tax law encourage economic growth, the economic impact from the tax cuts will likely be rather small.

However, the financial impact could be significant.  Expanding corporate liquidity will likely encourage higher dividends, share buybacks and merger activity.  Given the expected boost in earnings from the tax cuts, the expansion of corporate liquidity and the anticipated response from corporations to reward shareholders should support the continued elevated multiple and perhaps even lift investor sentiment further.

View the PDF


[1] See 2018 Outlook and 2018 Outlook: Addendum

[2] Using Standard & Poor’s operating earnings rather than the more commonly quoted Thomson/Reuters operating earnings, which averages approximately 8% higher.

[3] See WGR, 12/18/17, The 2018 Geopolitical Outlook

Weekly Geopolitical Report – The Iranian Protests (January 8, 2018)

by Bill O’Grady

(N.B.  Due to Martin Luther King Jr. Day, our next report will be published January 22, 2018.)

In early December, small protests developed in parts of Iran due to sharp increases in some food prices.  By the last week of 2017, the protests had spread across the country and have continued into the New Year.  In this report, we will discuss the current protests, comparing them to the unrest that developed in the wake of the 2009 elections in Iran.  We will examine Iran’s geopolitical position, focusing on the country’s natural barriers that both protect it and increase the costs of power projection.  We will analyze the possible impact of the protests and conclude, as always, with potential market ramifications.

The Protests
Recent protests in Iran have left 22 dead and over 450 people incarcerated.  These protests, though widespread, are fundamentally different from the 2009 “Green Movement.”  One important contrast is that the participants are not the same.  The 2009 protests were a fight between competing elites as the “reformists” and “hardliners” were vying for power.  The hardliners won.  However, these terms should be used with great care.  The hardliners are fairly obvious in their views, but the reformers were not “reformers” in the Western sense.  They were as committed to the Islamic Revolution as the hardliners.  The reformers were simply open to more social and market freedoms compared to the hardliners, but neither group was willing to allow for full democracy.  When Akbar Hashemi Rafsanjani[1] is considered a reformer, it is clear the differences between the two groups aren’t all that great.

The current protestors, instead, are from the lower economic classes.  In some respects, these protests reflect similar political issues recently seen in the West.  These protestors are angry about the state of the Iranian economy.  Officially, unemployment is 20%, but economists estimate that unemployment among Iranian youth is probably closer to 40%.  Many of the protestors are from the underclass from the countryside who have moved to towns and cities in the hope of finding work only to find unemployment.  This group has traditionally supported the regime.  In 2009, they would have been opposed to the Green Movement.  But, Iranian President Rouhani raised hopes of economic improvement after the nuclear deal that has, thus far, disappointed the masses.  Not only are jobs scarce, but inflation remains elevated.  The official data indicates that Iranian CPI rose to 9.6% in November compared to an 8.4% rise in October.  These numbers appear rather benign compared to the 45% rate in the latter half of 2013.  However, during this earlier period, the regime could blame poor economic conditions on Western sanctions.  Now that most international sanctions have been lifted, the current state of the economy remains disappointing.  One could argue that President Rouhani oversold the positive impact of lifting sanctions to foster support for the nuclear deal.  In his defense, however, he probably assumed that Hillary Clinton would win in 2016 and continue the policies of Barack Obama, who seemed open to normalizing relations with Iran.

View the full report


[1] See WGR, 2/6/2017, Exit the Shark.

Asset Allocation Weekly (January 5, 2018)

by Asset Allocation Committee

Equity markets had a very strong 2017, with the S&P 500 up over 20% for the year.  Earnings rose more than expected, the economy continued to expand and investor sentiment was buoyant, all of which contributed to rising equities.  The tax bill, signed in late December, will give equities a lift going into 2018.  In this report, we will examine equity market behavior as part of the presidential cycle.

To perform this exercise, we look at weekly closes for the S&P 500 starting in 1928.  We rebased the index for every four-year election cycle, so the first year is the actual election year (with elections held in November) along with the next three years of the term.  Using this database, we can sort by incoming party, incumbent party, high correlating terms, etc.  Earlier this year, we published this graph.

The red line on the chart shows the average S&P 500 performance for a new GOP president; the blue line shows the performance during the Trump administration.  From the beginning of 2016 into Q3 2017, the two lines closely followed each other.  However, they have diverged rather dramatically since then.  We suspect that the anticipation of tax reform has led to the sharp rise in equities.

The real question is how will equities perform in 2018?  The tax reductions built into the tax bill will likely have a significant impact on corporate earnings; we will have more to say about that in subsequent reports.  However, another way to look at equities is by comparing the performance of the current Trump term to other four-year cycles.

There are six other periods that correlate at 90% or above.  Three of the six show weakness in the second full year of the administration, 1960-63, 1964-67 and 1988-91.  In the first instance, the Cuban Missile Crisis likely led to the pullback.  The escalation of the Vietnam War and rising inflation (the highest rise in the CPI in nine years) weighed on equities in 1966.  The First Gulf War and the 1990-91 recession were behind weaker equities in the 1988 cycle.  The other three had mostly rising equity values in the second full year of the political cycle.

Interestingly enough, the highest correlating cycle is 2012-15, the second Obama term.  Although the current index is running a bit behind compared to that year, the index pattern is most similar.  If we continue to track that cycle and narrow the gap, the S&P 500 would end up at 3267.65 at the end of 2018.

How is this exercise useful?  This analysis looks at high correlation periods and projects what may occur assuming that no major exogenous events occur.  Obviously, a war or recession would lead to different outcomes.  But, if the U.S. avoids an economic downturn or a major political or geopolitical event, equity markets could have another strong year.

View the PDF

2018 Outlook: Addendum (January 4, 2018)

by Bill O’Grady & Mark Keller | PDF

Summary:

When we wrote our 2018 Outlook, we were unable to take into account the Tax Cuts and Jobs Act of 2017[1] because the legislation had not been signed by the time we published our report.  This Addendum will address the impact of the tax bill on our forecasts.

Our analysis suggests the impact will be significant.  The legislation reduced the highest marginal corporate rate from 35% to 21%.

This table shows our updated forecasts[2] for the S&P 500.

Although the tax bill will likely affect other parts of the financial markets and the economy, we expect those effects to be minimal.  We do not expect any major change in economic growth nor do we anticipate that the rise in the fiscal deficit will seriously affect the fixed income markets.  A rising deficit might also affect the dollar, but the historical pattern is mixed; if the deficit leads to more aggressive monetary policy tightening, it would be bullish for the dollar.  This scenario characterized the early 1980s.  However, the fiscal surpluses of the late 1990s also boosted the greenback.  A rising fiscal deficit that does not trigger a monetary policy response is likely dollar bearish but, since our outlook already calls for a weaker dollar, we won’t make any formal changes to our forecast there, either.

Read the full report


[1] The official name is the Act to provide for reconciliation pursuant to titles II and V of the concurrent resolution on the budget for fiscal year 2018; it has this unwieldy name to meet the strict parts of the Byrd Rule, which allowed the bill to pass through budget resolution by a simple majority.

[2] This is a Standard and Poor’s operating number, not a Thomson/Reuters operating number.  If our forecast is correct, the latter operating forecast will rise to around $150 per share.

Asset Allocation Weekly (December 22, 2017)

by Asset Allocation Committee

(N.B. This will be the last Asset Allocation Weekly for 2017.  We thank our readers and wish them a Merry Christmas and Happy New Year.  The next report will be published on January 5, 2018.)

As equity markets continue to trend higher, there are always worries about how long the bull market can last.  In general, bull markets over the past three decades have tended to end with recessions, triggered either by a policy mistake or a geopolitical event.  Unfortunately, the latter are binary events and difficult to predict.  We do pay close attention to such events in our Weekly Geopolitical Reports.

Due to its importance to financial asset performance, we also closely monitor the economy.  One of our more simple indicators is constructed with commodity prices, initial claims and consumer confidence.  We standardize the data and combine it into a single indicator.  The thesis behind this indicator is that these three components should offer clear signals on the economy; in other words, rising initial claims coupled with falling commodity prices and consumer confidence is a warning that a downturn may be imminent.  The opposite condition should support further economic recovery.

The above chart shows the results of the indicator and the S&P 500 since 1995.  We have placed vertical lines when the indicator falls below zero.  Although it works fairly well as a signal that equities are turning lower, it is a bit slow.

To make a more sensitive indicator, we took the 18-month change and put the signal at -1.0.  This triggers a more useful sell signal and also eliminates the false positives that setting it at zero would generate.  However, we do pay close attention when the 18-month change falls under zero.

What does the indicator say now?  Clearly, if we are going to have a pullback, it won’t be from the economy.  The economy is healthy and will be supportive for equity markets.  That doesn’t mean that valuation doesn’t matter, but it does suggest that the economy shouldn’t cause a bear market in the near term.

View the PDF