Asset Allocation Weekly (July 27, 2018)

by Asset Allocation Committee

Last week, in a wide-ranging interview on CNBC,[1] President Trump ended a 25-year détente with the Federal Reserve, openly criticizing the current path of monetary policy.  The president followed up the interview with numerous social media tweets, further criticizing policy tightening.

Although it’s been a long time since a president weighed in directly on the Federal Reserve’s monetary policy, such criticism is not at all unusual.  In fact, the détente is perhaps the outlier.  There is a natural tension between a government in power and a central bank.  Political leadership, regardless of whether a country is a democracy or not, generally prefers lower interest rates.  In the U.S., the Federal Reserve became untethered from the Treasury in 1951 when the White House, Congress and the Federal Reserve agreed to give the central bank independence in setting monetary policy.  Up until that point, the Federal Reserve was required to assist the Treasury in facilitating the management of Treasury debt.  However, it should be noted that President Truman was not comfortable with this change.

As inflation rose in the late 1960s, chairs of the Federal Reserve faced increasing pressure from various administrations.  President Johnson criticized William Martin for not supporting his stimulus policies with monetary accommodation.[2]  Nixon tried to replace Martin after his election in 1968, offering to nominate him for treasury secretary.  There is speculation that Nixon blamed Martin for his loss to Kennedy in 1960[3] and wanted a more compliant Fed chair.  When Martin refused to leave, Nixon eventually replaced him with Arthur Burns.  Nixon persistently browbeat Burns and, in order to ensure he would provide easy monetary policy, started a rumor that Burns was pressing for a raise when the Fed chair was publicly opposing wage increases.  Nixon then recruited Alan Greenspan to tell Burns that if he promised to keep policy accommodative, the White House would deny the rumors.[4]

Reagan was not above criticizing the Fed; in 1980 his government issued a statement warning that the Fed’s independence “should not mean lack of accountability” and that Congress should “monitor the Fed’s performance.”[5]  Reagan strongly considered not reappointing Paul Volcker.[6]  Volcker left the Fed in 1987, surrounded by governors appointed by President Reagan who were in the habit of dissenting with his decisions.

Even Alan Greenspan, who for a period took on a persona of “the maestro,[7]” faced heavy criticism from the Bush administration as he refused to cut interest rates; he was even called “creepy.”[8]  George H.W. Bush blamed Greenspan for his defeat by Bill Clinton.[9]  The current détente between the Federal Reserve and the White House came when Robert Rubin, the director of the National Economic Council, convinced the president that the Fed’s policy decisions should not be questioned.[10]  Rubin argued that if the Fed could establish inflation-fighting credibility and reduce inflation expectations, then long-term interest rates would fall and the economy would prosper.

President Trump has clearly ended that detente.  Does that mean anything in the very short run?  Probably not.  We still expect four more rate hikes; the Eurodollar futures market hasn’t changed its assessment of the current policy path.  But, the criticism will likely increase with each rate hike and it will begin to affect policy at some point.  In fact, Chair Powell faces a difficult future.  Every rate hike will prompt unfriendly comments from the White House.  Once easing starts, Powell could face charges of acquiescence to Trump.

For markets, concern about the Fed eventually manifests itself in rising inflation expectations.  Actual inflation is based on the intersection of aggregate supply and aggregate demand.  Since 1978, deregulation and globalization have shifted the supply curve away from its origin and likely flattened this slope as well.  These factors have led to persistently low inflation.  The role of the central bank is more about managing inflation expectations.  Since Volcker, the Federal Reserve has made it clear that it won’t tolerate or accommodate sharply rising price levels.  The combination of credible monetary policy and rising productive capacity has led to disinflation and a steady decline in long-term interest rates.

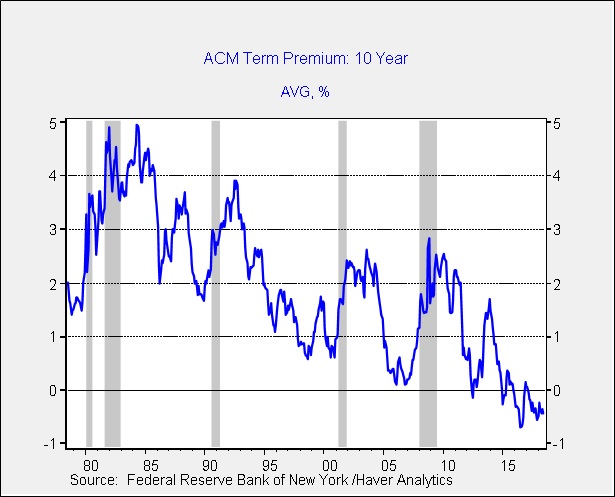
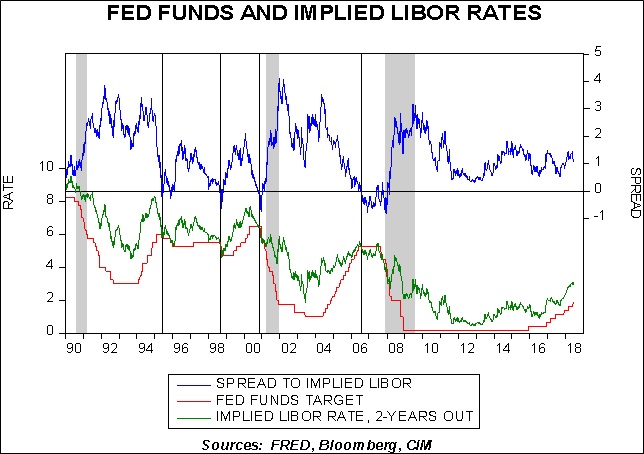
This chart shows a calculation of the term premium on 10-year T-notes.  The term premium measures how much more yield investors demand for holding longer term notes.  In other words, an investor could simply buy a one-year T-bill each year for 10 years or a 10-year T-note.  Usually, the longer duration instrument carries a higher yield because there are risks that rates could rise in the future, lowering the price of the T-note.  Simply put, the term premium is an attempt to measure the market’s estimate of the riskiness of owning long-duration debt.  As the above chart shows, the current term premium is negative, suggesting investors would much rather own the long-duration instrument and are willing to accept a “discounted” rate.

Undermining the Fed runs the risk of reversing this term premium, which would lead to a steeper yield curve and higher interest rates.  So far, that has not occurred.  There are a couple reasons for this lack of movement.  First, the deregulatory policies of the Trump administration are disinflationary. Thus, the inflationary impact from trade impediments may not be as large if the economy can still enjoy the unfettered introduction of new technology.  Second, the term premium is mostly a function of inflation expectations, which take a long time to evolve.  Milton Friedman argued that inflation expectations are set over decades.  Thus, for now, we don’t expect a major increase in long-term rates.  But, the potential risks are rising.  Investors should be wary of long-duration positions and consider bond laddering. 

View the PDF


[1] https://www.cnbc.com/video/2018/07/20/watch-cnbcs-full-exclusive-interview-with-president-donald-trump.html

[2] https://www.nytimes.com/2017/06/13/business/economy/a-president-at-war-with-his-fed-chief-5-decades-before-trump.html

[3] https://www.minneapolisfed.org/publications/the-region/remembering-william-mcchesney-martin-jr; also, Mallaby, Sebastian. (2016). The Man Who Knew: The Life and Times of Alan Greenspan. New York, NY: Penguin Books, p. 134.

[4] Ibid., pp. 141-144

[5]https://books.google.com/books?id=hclu1_TJ9K8C&pg=PA1976&lpg=PA1976&dq=coordinating+committee+on+economic+policy+economic+strategy+of+the+Reagan+administration+november+16+1980&source=bl&ots=URIX4HAra8&sig=iBKs1W1J94qfuMmq5l8k-F-DvEQ&hl=en&sa=X&ved=0ahUKEwjWn__Bwq7cAhUo54MKHZXmBdcQ6AEINDAD#v=onepage&q=coordinating%20committee%20on%20economic%20policy%20economic%20strategy%20of%20the%20Reagan%20administration%20november%2016%201980&f=false

[6] Op. cit., Mallaby, p. 286

[7] Woodward, Bob. (2000). Maestro: Greenspan’s Fed and the American Boom. New York, NY: Simon and Schuster.

[8] Op. cit., Mallaby, p. 415

[9] Ibid., p. 416

[10] https://www.wsj.com/articles/a-brief-history-of-the-federal-reserves-independence-1497346201

Keller Quarterly (July 2018)

Letter to Investors

The “choppiness” of the stock market, of which we wrote last quarter, continues.  Even though the U.S. stock market, as represented by the S&P 500, has been working its way upward since early April, it still stands 2.6% below its high for this year (reached on January 26th).  As we noted last quarter, this market action is completely normal and even somewhat welcome for a market that had barely paused in its upward climb for almost two years prior to the recent sell-off.  Investors who don’t “live daily” with the stock market often think in terms of stable rates of returns.  Experienced equity investors know that stock prices (and stock returns) are lumpy, even if the earnings and dividends of the underlying companies are relatively stable.

This “lumpiness” is called “volatility” by many analysts, and there is really no way to avoid it once you have decided you want to invest in stocks; it goes with the territory.  Yet a wise investor can make use of this volatility.  By both recognizing its existence and expecting it to occur, an investor can use volatility to gain advantage by targeting stocks to buy when the volatility is downward (when stocks “go on sale”) and selling some stocks when the volatility is upward.  This same approach is useful in the management of all financial assets and, indeed, all asset classes used in our Asset Allocation portfolios.

Recent volatility appears to have derived from a combination of Fed tightening (interest rate increases) and administration trade policy changes.  We’ve recently been receiving lots of questions about rising tariffs and the impact of potential trade wars.  This is a topic that requires historical analysis, because no one working in our industry today has direct experience investing during a time of generally rising tariffs and trade barriers.  The last such period was the 1920s and 1930s.  Rising trade barriers do affect the values of financial assets, but perhaps not in the ways you would expect.

Industries that are the targets of tariffs may be directly affected either positively or negatively, depending on “which side of the knife” they’re on.  But these direct effects tend to be short term in nature and simply add to the market volatility that we try to take advantage of.  The more important effect of trade barriers is longer term, one that eventually appears if the barriers remain in place for years.  That effect is inflation.

It is not an accident that we have experienced 38 years of declining inflation during 38 years of steeply declining trade barriers.  The more global trade is unhindered, the greater the supply of goods to U.S. consumers; and the greater the supply is relative to demand, the lower the prices are.  It’s as simple as that.  Reverse the process, i.e., hinder trade and reduce the supply of goods to U.S. consumers, and prices should rise if demand remains the same.  That rise in prices is inflation, and inflation pressures interest rates up and the value of financial assets down.

In light of that, why would anyone want to hinder trade?  Because not everyone is an investor.  In fact, many more people are workers than are investors, and that increased supply of foreign goods displaces domestically produced goods and the jobs that go with them.  After a multi-decade trend in one direction, many people have just presumed that this was the way the world should be.  A sense of history, however, tells you that long-term trends usually sow the seeds of long-term trends in the opposite direction.  If you’ve been reading our Daily Comment (www.confluenceinvestment.com/research-news/) for any length of time, you are aware that this is a matter we’ve been concerned about for years.

I’ve often described investing in a rising inflation environment as something like running up the down escalator: it can be done, but it’s just a lot harder than going up stationary stairs at the same speed.  And it’s not nearly as easy as simply riding up the up escalator!  In all honesty, investing in a declining inflation environment is a little like running up the up escalator: investors do better than they expected to do.  We at Confluence are acutely aware of the dangers of inflation and its impact on all financial assets, in both our Equity and Asset Allocation portfolios.  In fact, we’re old enough to remember that kind of world! Since many of us here started our careers during the high-inflation days of the 1970s and early 1980s, our methodologies incorporate a respect for rising inflation.  We’re not certain that is what lies ahead for investors, but we will be ready if it does.

We don’t get to manage investments in the world we wish we had, we must manage them in the world we have.

We appreciate your confidence in us.


Sincerely,

Mark A. Keller, CFA
CEO and Chief Investment Officer

View the PDF

Weekly Geopolitical Report – Reflections on Politics and Populism: Part II (July 23, 2018)

by Bill O’Grady

Last week, we defined important terms that shape the political alignments and examined the coalitions that mostly define the political sphere.[1]  This week, we make some general observations of how the coalitions interact, discuss the “natural” pairings of the coalitions and examine historical examples.  We will conclude with market ramifications.

Observations
There is a division between class and identity.  This is probably the greatest cause of confusion among political pundits and the general public alike.  Sometimes voters will select a candidate who is detrimental to their economic interests.  They usually do this because, at the time of their vote, identity was a stronger factor than class.  Because it is more emotional and tribal, identity makes it hard to project outcomes.  Class is fairly easy to observe; one can use wealth as a proxy.  But identity, because it is multi-dimensional and somewhat fluid, can turn elections in unexpected ways.  Our “laundry list” of surprises, the anti-establishment political outcomes noted in Part I of this report, were partly due to decisions based on identity.

Political leaders tend to use identity to woo voters outside the coalition of their class.  This is done by either claiming affiliation to a group or by warning against the negative outcomes if another group takes office.  Nearly every campaign story has some “origin myth,” where the candidate (usually RWE or LWE) harkens back to some period of their lives when they were living a hardscrabble existence so they can claim affinity to the populists to attract their vote.  In some cases, the candidate is so removed from struggle that they have to cite the origin myths of their parents, grandparents or great-grandparents.

The other tactic often deployed is to suggest that if the other establishment candidate wins he/she will support policies that will undermine a populist group’s identity.  For example, if a LWE candidate is trying to gain support from LWP voters, he will cite the threat to immigration or reproductive rights if the other candidate wins.  A RWE may use similar tactics on the RWP, suggesting a LWE candidate will undermine gun ownership or religious liberties.

View the full report


[1] A refresher on the coalitions—RWE: right-wing establishment; RWP: right-wing populist; LWE: left-wing establishment; and LWP: left-wing populist.

Asset Allocation Weekly (July 20, 2018)

by Asset Allocation Committee

Although earnings are rising, equity markets have been range-bound since February.

(Source: Bloomberg)

This chart shows the S&P 500; after peaking around 2870, prices have been in a range roughly from 2600 to 2800.  Although monetary policy tightening is partly to blame, the Fed was lifting rates during the period when the market was making new highs.  Instead, it appears the market reversal was caused by the threat of trade impediments.

The chart on the left shows the S&P 500 and the number of times Google Trends reports the popularity of the word “tariff,” with 100 being most popular and zero being no reports of the word getting used.  Note that when tariff chatter started to rise, the uptrend in equities stalled.  The chart on the right shows President Trump’s approval ratings and the same Google Trends data.  Approval ratings bottomed in December, about the time the tax bill passed.  Approval ratings began to rise with the onset of tariff mentions.  Note that as tariff mentions have declined recently the president’s trend in approval ratings has stalled and equities (on the left chart) have started to rally.  Although the correlations are not perfect, overall, when remarks about tariffs are elevated, equities decline and the president’s approval ratings rise.  Thus, it would make sense for the president to keep pushing on tariffs as it’s improving his political situation.

A major issue with trade policy is how the market discounts a turn to protectionism.  That is mostly because we haven’t seen U.S. protectionism as official policy since the 1920s.

This chart shows the level of duties as a percentage of all imports.  The U.S. was a high tariff nation, although tariffs did decline steadily until 1917.  Tariff rates rose sharply after WWI into the early 1930s, culminating in the Smoot-Hawley Tariffs of 1930.  Since then, tariff rates have steadily declined to the current low level of 1.4%.  Simply put, there is no market analyst alive today who was an adult working in the markets the last time we had a major increase in tariff rates.  And, if they were, it’s important to remember that this was under the gold standard so no one really has any experience in how a trade conflict will affect the world economy and financial markets in a floating fiat currency environment.   All we can rely on is theory.

Our expectation is that tariffs will act as a supply constraint on dollars, which would be expected to be dollar bullish.  However, as noted above, there is no reasonable way to indicate how much the dollar would rise because there isn’t a historical precedent to compare.  So far, the financial markets appear to believe that the administration’s tariff threats are designed to prompt negotiations for more favorable trade terms.  Thus, the dollar’s direction has been more a function of U.S. monetary policy—as the Fed continues to tighten the dollar has moved higher.  However, if sentiment toward trade turns from mere posturing to deglobalization, the dollar could move significantly higher.   A much stronger dollar would be very bearish for emerging markets and commodities and also a negative factor for developed markets as well.  It would be bullish for Treasuries and small cap equities.

View the PDF

Asset Allocation Quarterly (Third Quarter 2018)

  • We expect that Fed policy will continue tightening through year-end, with as many as two additional increases in the fed funds rate in tandem with a measured reduction in the size of the Fed’s balance sheet, but the prospect for a recession is not included in our cyclical forecast.
  • Our expectations are for continued GDP growth throughout the balance of this year and into 2019. Accordingly, equity exposures remain elevated across all strategies relative to our historic allocations, with a 60% growth style bias among U.S. equities.
  • The outlook for the U.S. dollar is path dependent upon the durability of both trade conflicts and Fed posture into and through next year.
  • We retain a modest allocation to gold given the combination of the potential for global political instability and its current price well below our estimate of fair value.

View the complete PDF


ECONOMIC VIEWPOINTS

Continued tightening by the Federal Reserve, with its two increases in the fed funds rate thus far this year, combined with the gradual reduction in its balance sheet and the gravitational pull of negative yields in much of the developed world have led to a flattening of the U.S. Treasury yield curve. While our view is for continued economic growth until nearing the end of our three-year forecast cycle, we remain wary of the potential for a misstep by the Fed that would lead to excessive tightening and increase the odds of a recession. Though an inverted yield curve is widely viewed as being indicative of an impending recession, a flattening curve is not necessarily a precursor to an inversion. What we have found to be an even more important metric to measuring Fed policy than either the spread between fed funds and the 10-year or the 2/10 segment of the curve is the spread of fed funds to the implied LIBOR rate advanced two years. As the accompanying chart indicates, implied LIBOR has increased since mid-2016 and remains comfortably in excess of fed funds. When this measure falls into negative territory, it is a signal from the financial markets that the Fed has overtightened policy. If or when this occurs, it will cause us to reassess the probability of a near-term recession. Until that point in time, we are consoled by the high levels of several sentiment indices, including the U.S. NFIB Business Optimism Index, the Conference Board’s Consumer Confidence Index and the University of Michigan’s Index of Consumer Sentiment. In addition, low unemployment and strong GDP figures compel us to retain equity exposures at their historically high levels for the portfolios until such time that potential risk outweighs expected return.  Finally, inflation expectations remain around the 2% level, which creates a stable backdrop for both bonds and equities. While we are cognizant that the mid-term elections in the U.S. may engender fiscal changes that could challenge the economic environment, we find it premature to factor any effects into our forecast.

The global economic environment, while still positive, faces a number of challenges. The imposition of tariffs by the U.S. and, as a result, several of its trading partners, holds the potential to develop into a full-scale trade war with obvious downward implications for global growth. Although Europe is still in expansion, the ECB has maintained a dovish stance on rates and has indicated it might forestall a reduction in its balance sheet until mid-2019, citing a moderation in growth in the first half of the year and concerns emanating from increased protectionism. The Japanese economy has similarly exhibited recent signs of difficulty. After eight straight quarters of GDP growth beginning in 2016, the economy shrank in the first quarter. Although it was a modest decline of -0.2%, it echoes the moderation in Europe and encourages the extension of the BOJ’s asset purchase program. Of even greater consequence to the global economic environment is China’s response to U.S. protectionism. We believe China has the will and determination to engage in a full-scale trade war with the U.S. In addition, China may employ any economic weakness accruing from a reduction in its trade to contain its debt growth, which is prominent in Chairman Xi’s economic construct.

Given the global dispersion of economic growth rates and central bank policies combined with the potential for protectionism to take hold, we find the value of the U.S. dollar versus other currencies to be on a knife’s edge. Continued U.S. economic expansion and weakness abroad are normally a recipe for U.S. dollar strength relative to other currencies. However, though the interest rate differentials support a strong U.S. dollar and a global trade war would lead investors to seek safety in the greenback, leading to the potential for the U.S. dollar to reach historically high valuations, a more localized trade dispute solely with China would limit the overall economic impact. In the event that the goal of the U.S. administration’s trade rhetoric is simply to improve America’s bargaining position, the U.S. dollar could be vulnerable to a pullback to its fair valuation. If the Trump administration openly opposes Fed policy tightening, then the dollar could be especially vulnerable.

STOCK MARKET OUTLOOK

Despite trade tensions and the potential for a misstep by the Fed, our views remain favorable on U.S. equities. Our assessment is that inflation should remain contained, the low level of unemployment will persist and GDP growth will be maintained. As expected, the level of share repurchases, M&A activity and repatriation of overseas assets have been elevated since the passage of the tax act at the end of last year. Current readings show no indication of these trends abating in the near-term. Although equity prices, as measured by the S&P 500, are in excess of the long-term trend, as shown in the accompanying chart, expectations of higher corporate earnings and solid economic data combined with high levels of consumer and business confidence encourage us to retain our historically high equity allocations in each of the strategies. In addition, due to the current stage of the economic cycle, we maintain the 60% tilt toward growth equities, yet without an overt overweight to any particular growth-oriented sector due to potential effects on the Technology and Consumer Discretionary sectors from the upcoming introduction of the new Communications Services sector at the end of September. The overweight to the traditionally value-oriented sectors of Energy, Financials and Materials that have existed since the beginning of the year are supported by attractive valuations and are therefore retained.

Mid-cap and small cap exposures have an identical tilt to growth equities and are both overweight in our strategies that have growth as an objective. Outside the U.S., we retain most of the posture from last quarter. The factors discussed above regarding the U.S. dollar exchange rate will naturally create either a headwind or tailwind for returns on non-U.S. equities, but the attractive relative valuations advocate for their retention.

BOND MARKET OUTLOOK

The more hawkish composition of voting members of the Fed’s Board of Governors as compared to last year produces the expectation of continued tightening and balance sheet unwinding. Combined with a stable inflationary outlook, this leads to a forecast of an extremely flat yield curve over our three-year cyclical outlook. Though this bodes well for the longer rungs on the ladder, as well as the long-term Treasuries employed in the income-oriented strategies, such a flattening will impact the intermediate rungs of the ladder.  However, given our outlook for the full three-year cyclical period, any price pressure on the intermediate rungs will prove ephemeral as their roll toward maturity will find them comfortably recovering. While our view of the bond market is sanguine over the cyclical time frame, we harbor some level of trepidation in the speculative bond space. As the chart alludes, spreads are at post-recession tight levels. In addition, Moody’s estimates that $952 billion of high-yield bonds will be maturing between 2019 and 2022, most of which will be seeking refinancing. Coupled with the tax legislation limitation of interest deductibility to 30% of EBITDA by corporations, this may pressure spreads to widen. Accordingly, exposure to speculative grade bonds remains at the low end of our historic levels in the strategies.

OTHER MARKETS

We retain the allocation to real estate in the more income-oriented strategies given attractive and improving dividend yields. As a function of yield relative to potential risk, we view REITs more favorably than speculative bonds.

We also retain our allocation to gold, which was introduced last quarter. Owing to the fact that gold can serve as a safe haven during periods of heightened geopolitical and currency risks, and the knife’s edge of the U.S. dollar’s exchange value, we find the modest allocation to be helpful as a governor of risk. In addition, gold is currently trading well below its fair value price as suggested by our analysis.

View the complete PDF

Weekly Geopolitical Report – Reflections on Politics and Populism: Part I (July 16, 2018)

by Bill O’Grady

The rise of populism and the preference for unconventional leaders are upending the world order that the U.S. created after WWII.  Accordingly, across the West, we are seeing a steady rejection of centrist, establishment parties.  Here are some of the changes we have observed recently:

France: Emmanuel Macron was elected to the presidency last year without previous experience of holding an elected office.  He started a new party which now holds the majority in the French National Assembly.  His election and new party are clear rejections of the existing establishment parties.

Germany: Although Chancellor Merkel continues to hold power, her party, the CDU, had the weakest performance in last year’s election since 1949.  The SDU, the other party in the “grand coalition,” had its worst showing since WWII.  The Alternative for Germany (AfD), a populist right-wing party, was the first of its kind to win seats in the Bundestag in the postwar era and is the official opposition.

Italy: Voters rejected mainstream parties and elected a coalition consisting of the Five-Star Movement, a left-wing populist party, and the League, a right-wing populist party.

Mexico: Lopez Obrador, better known as AMLO, won the election held on July 1.  He is the first Mexican president since 1929 who doesn’t represent one of the mainstream parties.

United States: Donald Trump, who had never held elected office, won the presidency and has been mostly governing as a right-wing populist.

This list isn’t exhaustive.  Populists are currently governing in Hungary, the Czech Republic, Austria and Poland.  It is quite possible that Brazil’s October presidential election will give the office to Jair Bolsonaro, who seems to be running as a right-wing populist strongman.  In addition, Brexit is a populist movement; if Theresa May’s government, which is teetering toward a no-confidence vote, fails, there is a good possibility that a populist left-wing government led by Jeremy Corbyn will emerge.

In the media, there is much consternation about a number of developments, including non-establishment candidates on both the left and right defeating experienced political figures.  This report is our attempt to put context around these developments.

In Part I of this report, we will define the terms that we use to describe the political landscape.  These definitions will be used to characterize the four major political coalitions and their basic policy positions.  Part II will begin with general observations about the effects of class and identity.  From there, we will discuss actual historical developments that describe how these four coalitions interact.  As always, we will conclude with market ramifications.

View the full report

Asset Allocation Weekly (July 13, 2018)

by Asset Allocation Committee

Earnings season is upon us.  We normally don’t report on earnings season since we discuss it every day and update the P/E chart weekly, but we are seeing significant growth in earnings which warrants some reflection.

The primary reason for the jump in earnings has been the decline in corporate tax rates.

The chart on the left shows corporate profits from the National Product and Income Accounts, the profits data calculated as part of GDP.  This chart shows the pre- and post-tax profits as a percentage of GDP and the lower line shows the spread between the two.  A narrower spread indicates fewer profits lost to taxes.  The chart on the right shows the spread with a forecast derived from the highest marginal corporate tax rate.  There are two important factors to note.  First, we are seeing the spread narrow as the forecast would have suggested, shown by the narrowing of the Q1 spread.  Second, the forecast signals that post-tax corporate profits over the rest of the year should approach 10% of GDP.

The consensus forecast for Q2 is $39.20 per share,[1] which is up 19.9% over last year.  In addition, companies are repatriating money from their overseas accounts.

This chart shows foreign earnings retained abroad on a flow basis.  In Q1, nonfinancial corporate businesses moved $632.7 bn back to the U.S.[2]  Note the last time this occurred was in 2005 when a tax holiday on foreign earnings was relaxed.  The hope of policymakers was that these inflows would be used for investment to boost growth and, eventually, employment.  However, at least one-third has been used by S&P companies to buy back stock.[3]  The hopes of policymakers were always questionable; a decade of low interest rates meant that the investing environment was already favorable.  It would be odd for a project to need the implementation of a tax cut with historically low interest rates already in place.

If buybacks remain elevated, the number of shares outstanding will contract which will tend to support multiple expansion.

This chart shows the S&P 500 Index divisor; it takes mergers, share buybacks and new issuance into account.  Since 2011, the divisor has been steadily declining due to mergers and share buybacks overwhelming new issuance.  Note the difference from the 1990s bull market which was characterized by a rising divisor.  During this period, rising equity prices led to an increase in stock issuance.  That has not been the case in this bull market.  It is also interesting that the divisor fell from 9000 to 8700 after the 2005 tax holiday, suggesting that the last episode likely led to share buybacks as well.

The combination of rising earnings and a falling divisor will lead to a contraction of the P/E multiple without higher equity prices.  Although trade issues are a serious concern, we remain bullish on equities due to earnings and falling share levels.  If the trade situation stabilizes, we should see equity values rise into autumn.

View the PDF


[1] This is a Thomson-Reuters calculated number.

[2] In reality, most of it was already in U.S. banks but were in foreign accounts denominated in dollars.

[3] https://www.wsj.com/articles/stock-buybacks-are-booming-but-share-prices-arent-budging-1531054801

Weekly Geopolitical Report – The Return of AMLO (July 9, 2018)

by Thomas Wash

On July 1, Andres Manuel Lopez Obrador, or AMLO for short, became Mexico’s first leftist president in over three decades,[1] running on anti-establishment and anti-corruption platforms. The 64-year-old activist won with over 53% of the vote, the most since Mexico moved to a multi-party system.  For the first time in nearly a century, Mexico elected a president who did not belong to either of the two traditional parties, PRI or PAN. Furthermore, his political party, the National Regeneration Movement (MORENA), was also victorious, winning the majority in both the Senate and the Chamber of Deputies. As a result, AMLO will be the most powerful Mexican president since the PAN party ended PRI’s 70-year rule in 2000.

AMLO, who had run for president twice before, overcame stiff opposition from establishment candidates in the PRI and PAN parties. Since winning the presidency, AMLO has promised to balance the government budget, lower the crime rate and negotiate with the Trump administration on immigration and trade. His victory has caused market uncertainty as many people are not sure how he will handle Mexico’s relationship with the United States. The U.S. and Mexico have been re-negotiating NAFTA since last August and are expected to resume negotiations again next year. In addition, the U.S. and Mexico are still trying to find a solution to the immigration problem. In this report, we will examine how and why AMLO was so successful, briefly describe his history and then discuss how he might run his government. As usual, we will conclude with possible market ramifications.

View the full report


[1] The last leftist Mexican president was Miguel de la Madrid, who presided from 1982 to 1988.

Asset Allocation Weekly (July 6, 2018)

by Asset Allocation Committee

Over the past quarter, emerging market equities have weakened; the primary culprit was a strengthening dollar, although concerns about softer non-U.S. growth likely played a role as well.  The dollar’s strength appears to be caused by one of two factors.  The first possibility is interest rate differentials, which are partly due to the differences in economic growth.  The second possibility is that the potential of a trade conflict, which would likely reduce the global supply of dollars, is leading to the appreciation of the greenback.

The problem is that relative growth rates suggest the dollar is still somewhat overvalued.

This chart shows a model using the OECD’s leading indicators for Germany and the U.S.  Converting the estimated D-mark forecast to euros indicates a fair value of $1.3020.  Since relative growth rates drive the interest rate differences, it suggests it is less likely that interest rate differences are pushing the dollar higher.  In other words, it is obvious that U.S. interest rates exceed European rates but the exchange rate has already adjusted.  At the same time, if the financial markets expect further monetary policy tightening from the Federal Reserve, the elevated value of the dollar might be justified.

On the other hand, the impact of trade restrictions is different.  The U.S. has built a global trading system that was designed for steady declines in trade impediments.  From GATT to the WTO, the U.S. has fostered this system by consistently lowering tariffs and allowing nations to run trade surpluses with the U.S.  This wasn’t a flaw in the system; a reserve currency in a fiat currency regime essentially forces the U.S. to supply dollars to the world to facilitate trade.  The persistent trade deficit does impose costs on the U.S. economy but American political leadership, up until now, was willing to absorb those costs to maintain American hegemony.

At this juncture, it is unclear if the administration intends to completely upend the postwar trading system or if its actions are designed to improve America’s bargaining position.  Either outcome is possible.  If it turns out that the former is the goal, the dollar is likely to continue to appreciate, perhaps reaching historic highs.  If the latter is the goal, then the dollar may be vulnerable to a pullback.

This chart shows the relative performance of U.S. equities and emerging market equities; a rising blue line indicates emerging equities are outperforming emerging market equities.  The red line shows the JPM dollar index; the two series are inversely correlated at the 77.5% level, which means a stronger dollar leads to U.S. outperformance.  That finding is consistent with what has occurred over the past quarter.

However, there is evidence to suggest the recent U.S. outperformance is excessive.  The chart below shows a regression model of the relative performance of equities with the dollar index as the explanatory variable.  The lower line in the chart show shows the deviation from fair value.  Since 2010, emerging markets have generally underperformed relative to the dollar.  This could be due to a general avoidance of risk since the Great Financial Crisis but current levels are nearly a full standard error below fair value.

This analysis suggests that emerging markets are undervalued even in the face of recent dollar strength.  If the dollar pulls back, either because the Trump trade policy is posturing or the FOMC signals some moderation in its tightening path, emerging markets could recover.  In any case, they are attractive at current levels, although recovery will likely need a sign of policy restraint either on trade or the monetary front.

View the PDF