

Asset Allocation Weekly (July 13, 2018)
by Asset Allocation Committee
Earnings season is upon us. We normally don’t report on earnings season since we discuss it every day and update the P/E chart weekly, but we are seeing significant growth in earnings which warrants some reflection.
The primary reason for the jump in earnings has been the decline in corporate tax rates.
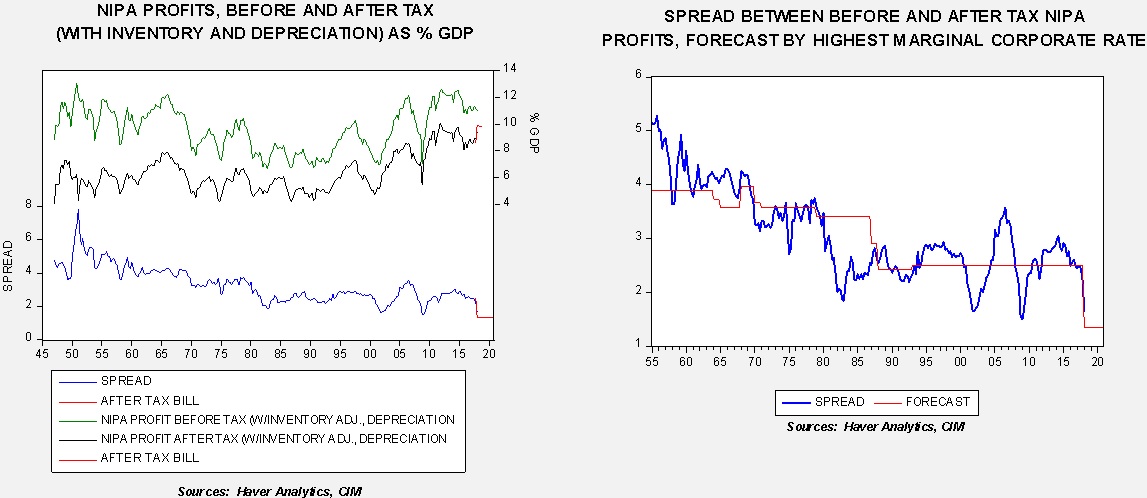
The chart on the left shows corporate profits from the National Product and Income Accounts, the profits data calculated as part of GDP. This chart shows the pre- and post-tax profits as a percentage of GDP and the lower line shows the spread between the two. A narrower spread indicates fewer profits lost to taxes. The chart on the right shows the spread with a forecast derived from the highest marginal corporate tax rate. There are two important factors to note. First, we are seeing the spread narrow as the forecast would have suggested, shown by the narrowing of the Q1 spread. Second, the forecast signals that post-tax corporate profits over the rest of the year should approach 10% of GDP.
The consensus forecast for Q2 is $39.20 per share,[1] which is up 19.9% over last year. In addition, companies are repatriating money from their overseas accounts.
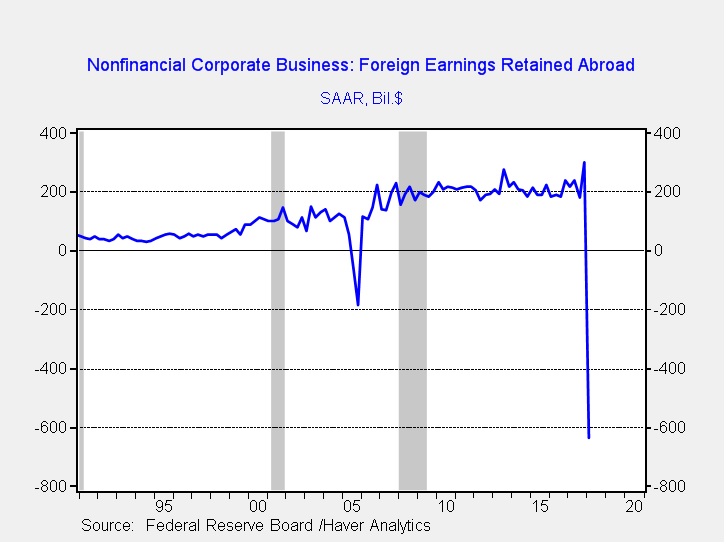
This chart shows foreign earnings retained abroad on a flow basis. In Q1, nonfinancial corporate businesses moved $632.7 bn back to the U.S.[2] Note the last time this occurred was in 2005 when a tax holiday on foreign earnings was relaxed. The hope of policymakers was that these inflows would be used for investment to boost growth and, eventually, employment. However, at least one-third has been used by S&P companies to buy back stock.[3] The hopes of policymakers were always questionable; a decade of low interest rates meant that the investing environment was already favorable. It would be odd for a project to need the implementation of a tax cut with historically low interest rates already in place.
If buybacks remain elevated, the number of shares outstanding will contract which will tend to support multiple expansion.
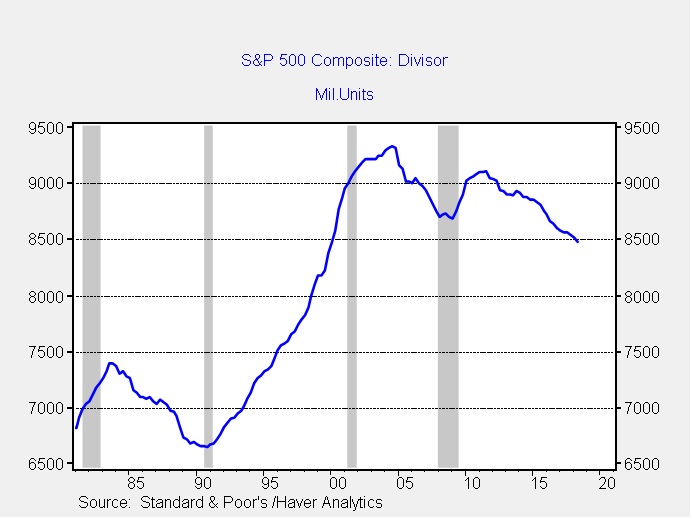
This chart shows the S&P 500 Index divisor; it takes mergers, share buybacks and new issuance into account. Since 2011, the divisor has been steadily declining due to mergers and share buybacks overwhelming new issuance. Note the difference from the 1990s bull market which was characterized by a rising divisor. During this period, rising equity prices led to an increase in stock issuance. That has not been the case in this bull market. It is also interesting that the divisor fell from 9000 to 8700 after the 2005 tax holiday, suggesting that the last episode likely led to share buybacks as well.
The combination of rising earnings and a falling divisor will lead to a contraction of the P/E multiple without higher equity prices. Although trade issues are a serious concern, we remain bullish on equities due to earnings and falling share levels. If the trade situation stabilizes, we should see equity values rise into autumn.
[1] This is a Thomson-Reuters calculated number.
[2] In reality, most of it was already in U.S. banks but were in foreign accounts denominated in dollars.
[3] https://www.wsj.com/articles/stock-buybacks-are-booming-but-share-prices-arent-budging-1531054801