

Asset Allocation Weekly (July 20, 2018)
by Asset Allocation Committee
Although earnings are rising, equity markets have been range-bound since February.
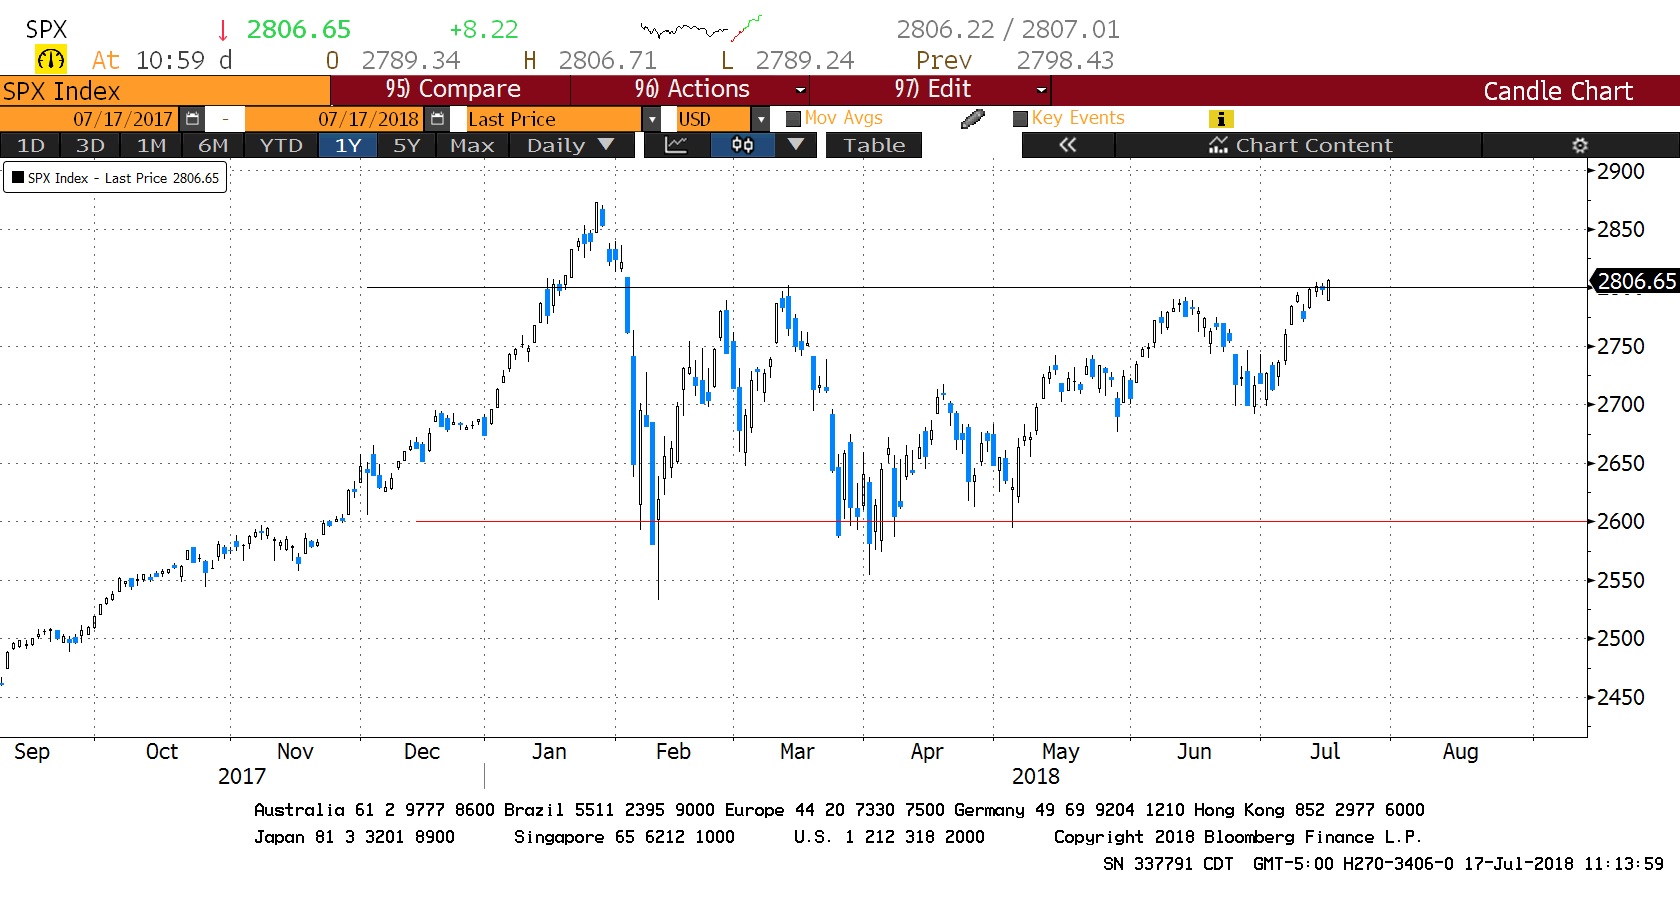
This chart shows the S&P 500; after peaking around 2870, prices have been in a range roughly from 2600 to 2800. Although monetary policy tightening is partly to blame, the Fed was lifting rates during the period when the market was making new highs. Instead, it appears the market reversal was caused by the threat of trade impediments.
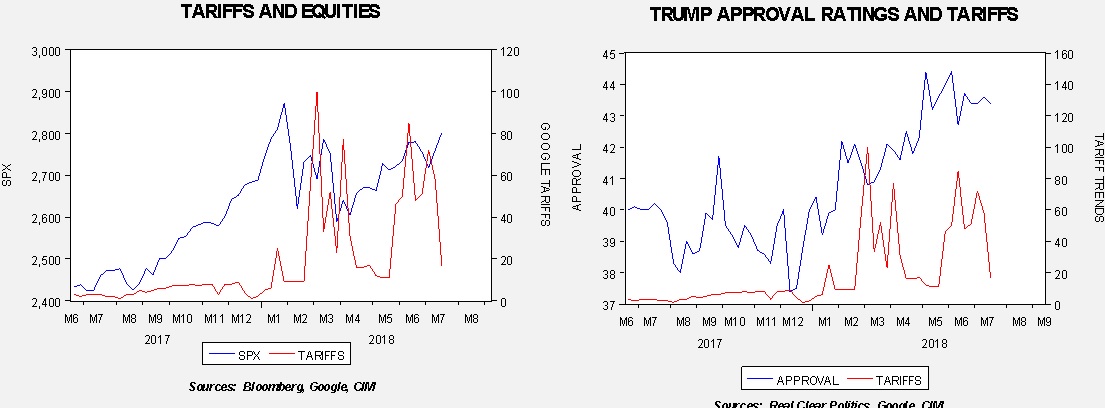
The chart on the left shows the S&P 500 and the number of times Google Trends reports the popularity of the word “tariff,” with 100 being most popular and zero being no reports of the word getting used. Note that when tariff chatter started to rise, the uptrend in equities stalled. The chart on the right shows President Trump’s approval ratings and the same Google Trends data. Approval ratings bottomed in December, about the time the tax bill passed. Approval ratings began to rise with the onset of tariff mentions. Note that as tariff mentions have declined recently the president’s trend in approval ratings has stalled and equities (on the left chart) have started to rally. Although the correlations are not perfect, overall, when remarks about tariffs are elevated, equities decline and the president’s approval ratings rise. Thus, it would make sense for the president to keep pushing on tariffs as it’s improving his political situation.
A major issue with trade policy is how the market discounts a turn to protectionism. That is mostly because we haven’t seen U.S. protectionism as official policy since the 1920s.
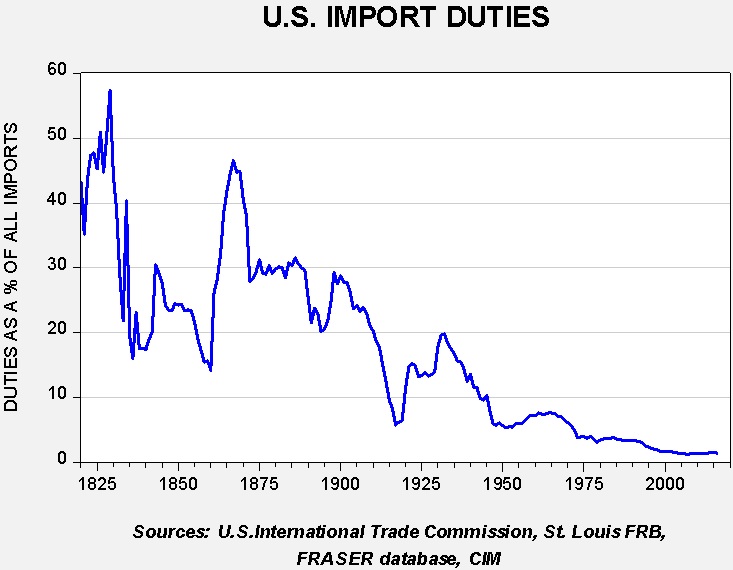
This chart shows the level of duties as a percentage of all imports. The U.S. was a high tariff nation, although tariffs did decline steadily until 1917. Tariff rates rose sharply after WWI into the early 1930s, culminating in the Smoot-Hawley Tariffs of 1930. Since then, tariff rates have steadily declined to the current low level of 1.4%. Simply put, there is no market analyst alive today who was an adult working in the markets the last time we had a major increase in tariff rates. And, if they were, it’s important to remember that this was under the gold standard so no one really has any experience in how a trade conflict will affect the world economy and financial markets in a floating fiat currency environment. All we can rely on is theory.
Our expectation is that tariffs will act as a supply constraint on dollars, which would be expected to be dollar bullish. However, as noted above, there is no reasonable way to indicate how much the dollar would rise because there isn’t a historical precedent to compare. So far, the financial markets appear to believe that the administration’s tariff threats are designed to prompt negotiations for more favorable trade terms. Thus, the dollar’s direction has been more a function of U.S. monetary policy—as the Fed continues to tighten the dollar has moved higher. However, if sentiment toward trade turns from mere posturing to deglobalization, the dollar could move significantly higher. A much stronger dollar would be very bearish for emerging markets and commodities and also a negative factor for developed markets as well. It would be bullish for Treasuries and small cap equities.